Credit scores sometimes feel like the GPAs of high school. It’s just a number but also has a lot of power of what you can be approved for (like GPAs determine what colleges you can get into). If you’ve struggled with credit, it may be tempting to call the 800 number you hear on the radio promising you an overnight solution to repair your credit. As tempting as it is, do not do it! Most of these are just scams that will get you to spend money you don’t need to.
You can work on repairing your credit yourself and you should.
Step #1 – Monitor your credit
The first step is seeing where you are at. You can get copies of your full credit reports from all the credit bureaus (Experian, TransUnion, and Equifax) by going to annualcreditreport.com or calling 877-322-8228. You are able to get your reports for free once a year via Annual Credit Report.
You can also sign up for a reputable credit monitoring service. These services help you by sending alerts anytime there is suspicious activity on your credit and also giving you the ability to check in often. You can find a list of some options here.
Step #2 – Dispute any errors
Once you have your reports, you should review them for accuracy. Confirm that your name, address, social security number, and all other personal information is correct. Then review all the accounts reported including balances. If you see any errors, you can tell the credit bureaus in writing what information you think is incorrect. Make sure to include copies of supporting documents (bank statements, credit card statements, etc). You can find a sample letter for disputing errors on your credit report from the Federal Trade Commission here.
According to the Federal Trade Commission, credit reporting companies must investigate the items you question within 30 days unless they consider your dispute frivolous. Once the investigation is complete, the credit reporting company must also give you the results in writing and give you another free copy of the report.
Step #3 – Control the things you can control
While sometimes there can be errors on your credit report that negatively affect you, a lot of the time your scores can be in your control. If you have a poor credit score because of things like missing payments, maxing out accounts, or applying for too much credit in a short period of time, work on improving these behaviors:
Always try to pay your bills on time even if it’s just the minimum payments.
Work on paying off your debt, especially high interest credit card debt.
Avoid applying for new credit. If you are trying to get a handle on your credit, one of the best things you can do is break the cycle of continuing to apply for new credit.
For more information, or if you have any questions, please reach out to your trusted wealth advisor at Warren Street Wealth Advisors.
Veronica Torres
Director of Operations, Warren Street Wealth Advisors
Investment Advisor Representative, Warren Street Wealth Advisors, LLC., a Registered Investment Advisor
The information presented here represents opinions and is not meant as personal or actionable advice to any individual, corporation, or other entity. Any investments discussed carry unique risks and should be carefully considered and reviewed by you and your financial professional. Nothing in this document is a solicitation to buy or sell any securities, or an attempt to furnish personal investment advice. Warren Street Wealth Advisors may own securities referenced in this document. Due to the static nature of content, securities held may change over time and current trades may be contrary to outdated publications. Form ADV available upon request 714-876-6200.
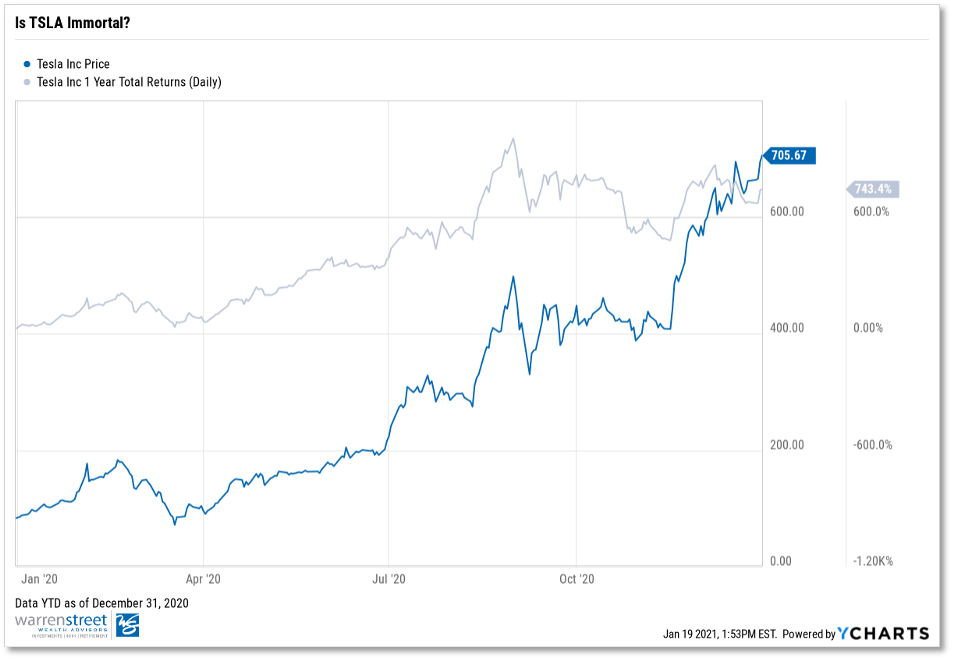
743%. That’s how much Tesla stock (Ticker: TSLA) returned in 20201. Most of us are aware of the bifurcation between the market’s seemingly invisible ceiling and the economy’s continued disarray, but nobody could have foreseen that Elon Musk and his army of “musketeers” would be amongst those most rewarded for owning increased allocations of TSLA stock.
In fact, 2020 was an eventful year for the electric vehicle company. Among a series of roller coaster weeks, a stock split announcement, and raging debate over analyst price targets, perhaps TSLA’s most noteworthy 2020 phenomenon was its inclusion in the S&P 500 Index – a profound move that has us concerned over the stock’s perceived immortality at the forefront.
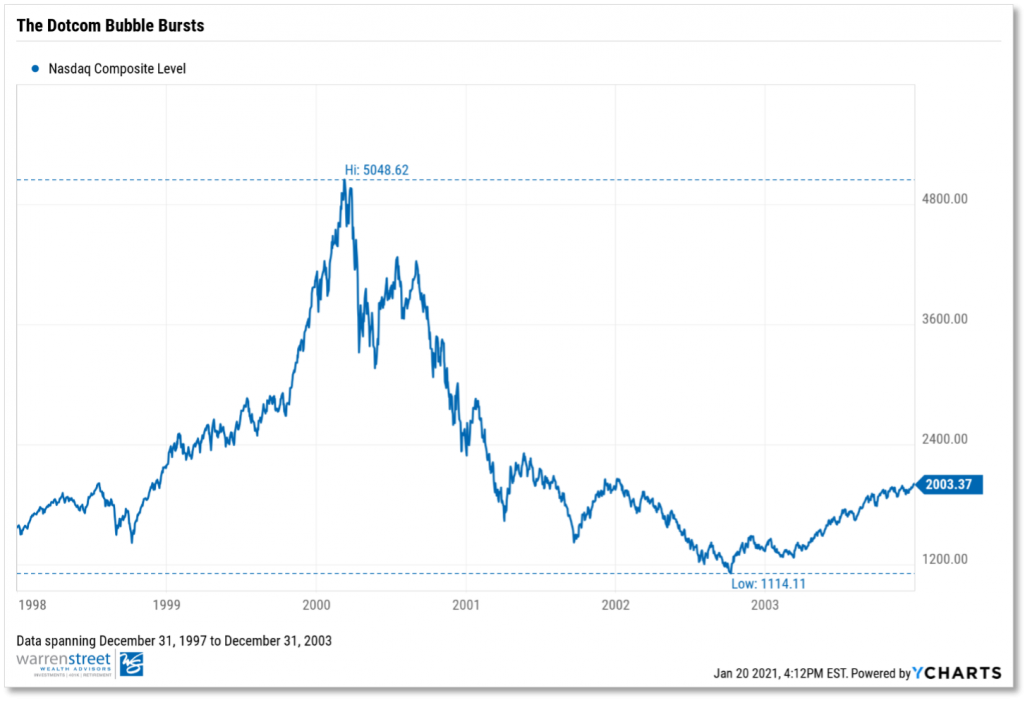
On December 21, 2020, the S&P 500 Index committee formally added the “profitable” carmaker to the index after denying TSLA index entry earlier in the year. The circumstances around this inclusion eerily resembles something we’ve seen before. Does “You’ve Got Mail” ring a bell? That’s right – we see multiple uncanny parallels between the TSLA and former net stock giant: American Online (AOL).
Echoes of The Past
On December 23, 1998, Standard & Poor’s announced it would make American Online the first “net” stock featured in the S&P 500 Index. Leading up to the announcement, AOL rallied 510% year-to-date2, before ending the year with a return of 585%. Compare this to TSLA, which had run-up 388%3 by the time the committee made its announcement on November 16, 2020. As mentioned previously, TSLA’s 2020 return was 743%. Notice here that a large proportion of TSLA’s 2020 return came in the last month and a half in the year…talk about upward volatility.
Arguably, the most intriguing similarity between these two stocks is the amount of price action driven by momentum and fear of missing out (FOMO). Investors overlooked red flags related to both AOL’s fundamentals and underlying profitability of tech stocks. AOL eventually lost 91%4 of its market value after a failed merger with Time-Warner cable. Meanwhile, valuations of tech stocks (represented by the Nasdaq Index) peaked in early 2000 before seeing 78%5 of its value disintegrate. Fast forward to the end of 2020, you have Tesla, a company whose “profitability” is primarily tied to energy credits, octupling (8x) its stock price to levels many investors deem uncomfortable.
Will TSLA suffer the same fate as AOL and other dotcom counterparts? Obviously 2021 is a different year. The carmaker makes electric-powered cars, not an instant messaging platform. We do acknowledge that historical performance is not indicative of future performance; and that correlation does not equal causation. However, it’s important to remember that those who don’t learn from history are doomed to repeat it.
How Much TSLA Do You REALLY Own?
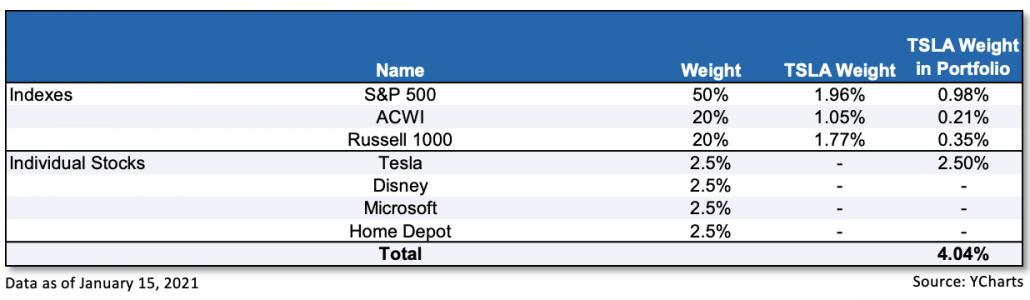
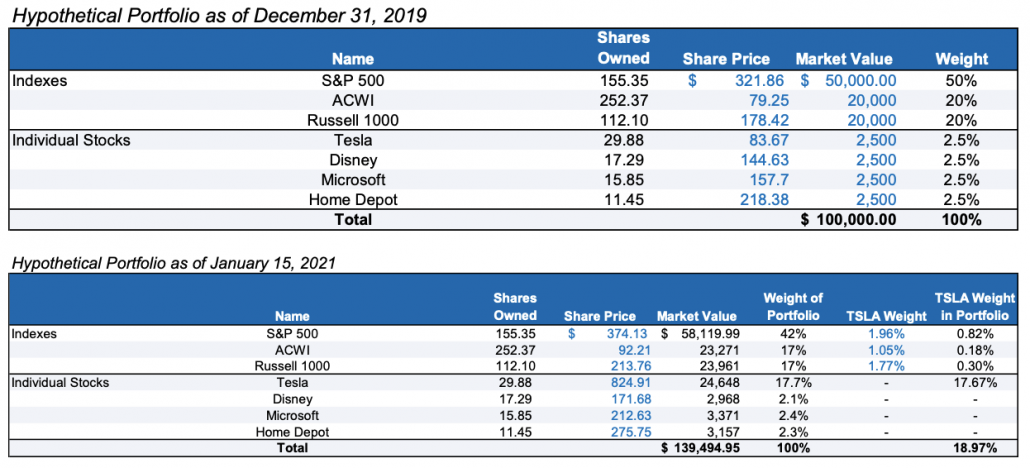
TSLA’s inclusion in the S&P 500 Index raises a new challenge for investors: hidden concentration risk. With TSLA now a part of the NASDAQ, Russell 1000, and widely regarded S&P 500, owning index funds inherently carries TSLA exposure. Borrowing from our friends over at WisdomTree, imagine a scenario where Portfolio A holds broad index funds in addition to a few well-known names.
What investors thought was a 2.50% allocation to TSLA is at 4.00%6. I know, I know. 4% doesn’t seem like a big deal. Besides, what investor puts 90% of their equity allocation into only broad U.S. ETFs? (You’d be surprised). The more important point though, is that volatile price action with TSLA can hide how much of the stock you really own.
At the end of 2019, TSLA shares were at $83.67. As of Friday, January 15, 2021 – the stock sits at $824.91 – almost ten times over its stock price just a year ago. Let’s say you owned Portfolio A on December 31, 2019. As of January 15 this year, TSLA would comprise 19% of Portfolio A’s exposure (see Appendix A). Obviously, price appreciation and concentration risk create their own problems (e.g., skewed returns, tax consequences), but when the underlying rationale for that price appreciation is in question by the investment community at large, you could have an even bigger problem on your hands.
Will TSLA Fall Back Down to Earth?
Today, it seems as if TSLA has really shot over the moon, multiplying its stock price ten times in a little over a year. Will the carmaker continue to defy odds throughout 2021? Or, is Tesla a ticking-time bomb waiting to explode?
We at Warren Street Wealth Advisors aren’t equity research moguls here to publish a Buy, Sell, or Hold on this highly debated stock. However, we do acknowledge that no company is immune from idiosyncratic risk. Whether Tesla can stay above the influx of foreign competition (e.g., NIO, Volkswagen), or whether or not valuations are outstretched represent just a few of many risks to the company’s stock price.
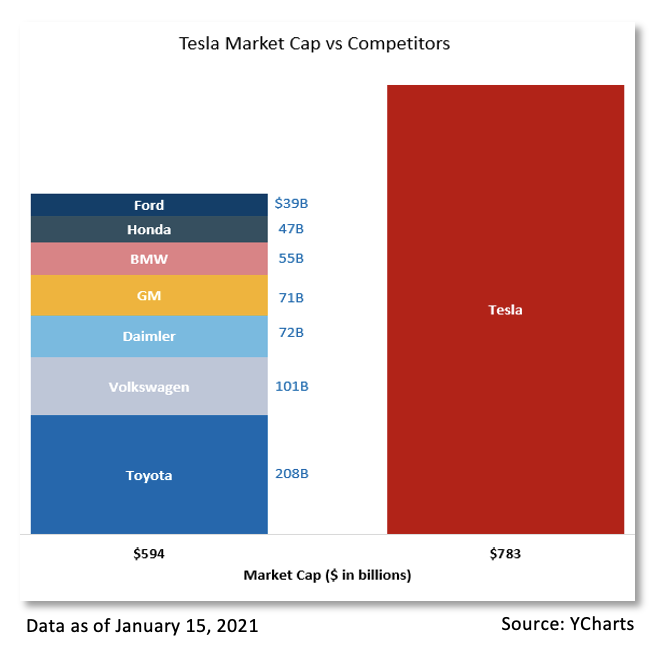
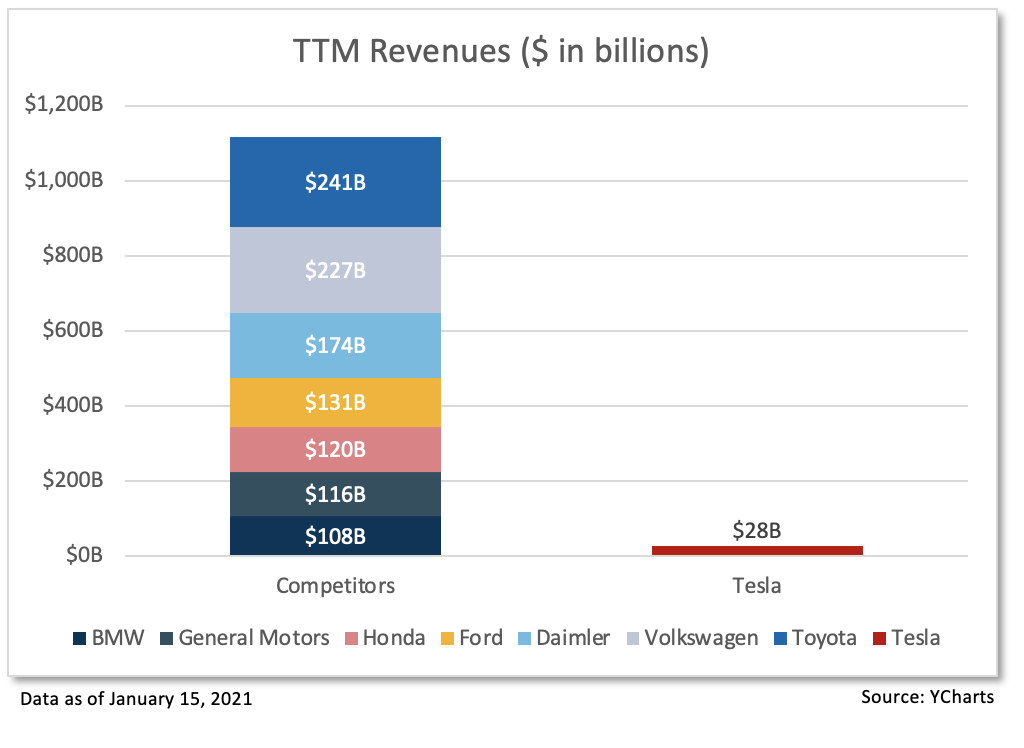
One observation fueling TSLA’s controversy is that despite having a much larger market cap relative to other established vehicle manufacturers (see above), the company only generated $28.2 billion in sales7. Compare this to a combined $1.1 trillion in sales7 for all its auto competitors listed above. How can a company, which does a fraction of its competitors’ sales, be worth more than all of them combined? Again, TSLA isn’t just a car company – it’s thought to be a generational leader driving the next revolution in clean energy; but nevertheless, some food for thought while you’re on the road.
Tesla’s ride sure was wild in 2020, and nobody can guarantee what will happen in 2021. However, as prudent investors, it’s important to not overlook the implications that a high-flying stock can have on client portfolios. We’re not here to argue whether Tesla’s run has just begun or if the stock’s price is dangerously inflated. But if the latter of those two ideas rings true, the world could be shocked when it sees electricity and a bubble come together.
Footnotes:
YTD total return as of 12/31/2020 sourced to YCharts.
YTD total return for 12/23/1998 and 12/31/1998 sourced to historicalstockprice.com.
YTD total return as of 11/16/2020.
AOL’s market cap plummeted from $226 billion to roughly $20 billion in 2003, sourced to Bezinga.
NASDAQ percent off high spanning 12/31/1997 to 12/31/2003.
4.04% is the summation of multiplying TSLA weight in index by index weight in portfolio.
Trailing twelve-month figures.
Appendix A
For any questions regarding international investments, emerging markets, or wealth management, please call 714-876-6200 or email phillip@warrenstreetwealth.com.
Phillip Law, Portfolio Analyst
Wealth Advisor, Warren Street Wealth Advisors
Investment Advisor Representative, Warren Street Wealth Advisors, LLC., a Registered Investment Advisor
The information presented here represents opinions and is not meant as personal or actionable advice to any individual, corporation, or other entity. Any investments discussed carry unique risks and should be carefully considered and reviewed by you and your financial professional. Nothing in this document is a solicitation to buy or sell any securities, or an attempt to furnish personal investment advice. Warren Street Wealth Advisors may own securities referenced in this document. Due to the static nature of content, securities held may change over time and current trades may be contrary to outdated publications. Form ADV available upon request 714-876-6200.
https://warrenstreetwealth.com/wp-content/uploads/2021/01/milan-csizmadia-d0V_DQO_xUM-unsplash-scaled.jpg25602048Phillip Law, CFAhttps://warrenstreetwealth.com/wp-content/uploads/2014/11/Warren_Street_logo-01.svgPhillip Law, CFA2021-01-29 22:15:402021-01-30 00:36:33Is Tesla Flying Too Close to the Sun?
Last week, the SBA reopened the Paycheck Protection Program (PPP) and will begin accepting applications for “Second Draw” forgivable PPP loans.
Here is a summary of the eligibility rules for Second Draw loans. Borrowers can draw loans of up to $2 million provided they:
Have previously received a “First Draw” PPP loan and used the full amount on eligible expenses
Have 300 or fewer employees
Document at least a 25% reduction in gross receipts in comparable 2020 and 2019 quarters
PPP borrowers may have their loans forgiven if the proceeds are spent on the following expenses: payroll (including benefits), mortgage interest, rent, utilities, worker protection costs related to COVID-19, uninsured property damage costs caused by looting or vandalism during 2020, and certain supplier costs and expenses for operations.
To receive full forgiveness, borrowers must spend at least 60% of the funds on payroll expenses over an 8-24 week period.
This is a high-level overview; if you have questions about the specifics as they apply to your business, please contact us. We are here to help!
Investment Advisor Representative, Warren Street Wealth Advisors, LLC., a Registered Investment Advisor
The information presented here represents opinions and is not meant as personal or actionable advice to any individual, corporation, or other entity. Any investments discussed carry unique risks and should be carefully considered and reviewed by you and your financial professional. Nothing in this document is a solicitation to buy or sell any securities, or an attempt to furnish personal investment advice. Warren Street Wealth Advisors may own securities referenced in this document. Due to the static nature of content, securities held may change over time and current trades may be contrary to outdated publications. Form ADV available upon request 714-876-6200.
https://warrenstreetwealth.com/wp-content/uploads/2021/01/vitaly-taranov-OCrPJce6GPk-unsplash-scaled.jpg17072560Emily Balmages, CFP®https://warrenstreetwealth.com/wp-content/uploads/2014/11/Warren_Street_logo-01.svgEmily Balmages, CFP®2021-01-26 02:17:272021-01-28 00:05:55PPP Reboot – More Small Business Relief
2020 has been a strange year for all of us, and although some financial planning deadlines have been modified due to the CARES Act, most 12/31 deadlines remain in place. Below are items we are considering as we wrap up the year with our clients. Should you have questions about whether or how any of the items below apply to you, please reach out to us as we will be happy to assist.
2020 Year-End Planning Items with 12/31 Deadline
Maxing out 401(k) contributions: Employees can contribute up to $19,500 (plus $6,500 extra for those over 50), into their 401(k)s for 2020. If you have not yet contributed the maximum amount and your cash flow allows, consider increasing your contributions now to reach the maximum contribution amount prior to year end.
401(k) Matching: If your company offers a 401(k) match, it makes sense to take advantage of the full match opportunity every year. If you have not received the full match for 2020, let us review your company’s 401(k) plan rules to determine if you can contribute enough to receive the full 2020 match before year end.
Charitable Giving for 2020: There are some additional charitable deductions this year as part of the CARES Act. There is a $300 deduction for taxpayers who don’t itemize, and for clients interested in large donations, taxpayers can deduct up to 100% of their adjusted gross income (up from 60%) for cash donations made to public charities. For clients with taxable accounts, we frequently recommend donating appreciated securities instead of cash via a donor-advised fund (DAF). This strategy works well when a taxpayer has highly appreciated securities in taxable accounts, and/or in a year when income is higher allowing a client to benefit from a larger charitable deduction.
Gifting: The annual gift exclusion amount for 2020 is $15,000 per taxpayer to each recipient. (Married couples can give $30k.) Make your annual gifts prior to 12/31 if you haven’t already!
Tax Loss/Gain Harvesting: At Warren Street, we employ a continuous monitoring of client accounts for tax loss harvesting opportunities. Similarly, if a client is experiencing a particularly low tax year, it may be the right time to strategically harvest capital gains.
Roth Conversions: Although market downturns are not fun, they can certainly provide an opportunity for strategic Roth Conversions. This is an annual planning item that we analyze for every Warren Street client.
LLC / Entity Formation: If you are in the process of business entity formation for 2020, you may need to have your documents signed and filed prior to the end of the calendar year.
If you have any questions about the above checklist or any other year-end planning questions, please feel free to reach out to your trusted wealth advisor. We are here to help!
Emily Balmages, CFP®, CRTP
Wealth Advisor, Warren Street Wealth Advisors
Investment Advisor Representative, Warren Street Wealth Advisors, LLC., a Registered Investment Advisor
The information presented here represents opinions and is not meant as personal or actionable advice to any individual, corporation, or other entity. Any investments discussed carry unique risks and should be carefully considered and reviewed by you and your financial professional. Nothing in this document is a solicitation to buy or sell any securities, or an attempt to furnish personal investment advice. Warren Street Wealth Advisors may own securities referenced in this document. Due to the static nature of content, securities held may change over time and current trades may be contrary to outdated publications. Form ADV available upon request 714-876-6200.
It’s no doubt that U.S. equities remain the protagonist of the past decade. The longest U.S. economic expansion, coupled with the blossoming of numerous tech stocks like Amazon and Tesla, helped the S&P 500 climb to record highs. That was soon followed by the U.S. stock market’s astounding recovery in 2020, which continues to capture the attention of global investors.
Many forget, however, that the decade before looked entirely different. Back then, we had an entirely different “darling” called emerging markets which left the S&P 500 in the dust.
Data spanning 12-31-1999 to 12-31-2009
During the 2000’s, emerging market investments drastically outperformed the S&P 500 by 188.1% on a total return basis. Steadying economic data and optimistic outlooks for EM nations including Brazil, Russia, India, and China, or the BRIC nations, painted narratives of a new global convergence. Meanwhile, U.S. stocks continued limping from the aftermath of the dotcom bubble.
The Case for Emerging Markets
EM investments invest in the securities of a less developed country with improving economic conditions and increased involvement with the global economy. Aside from the BRIC nations, this includes countries such as Vietnam, Indonesia, Africa, and Argentina. EM regions are attractive for the following reasons:
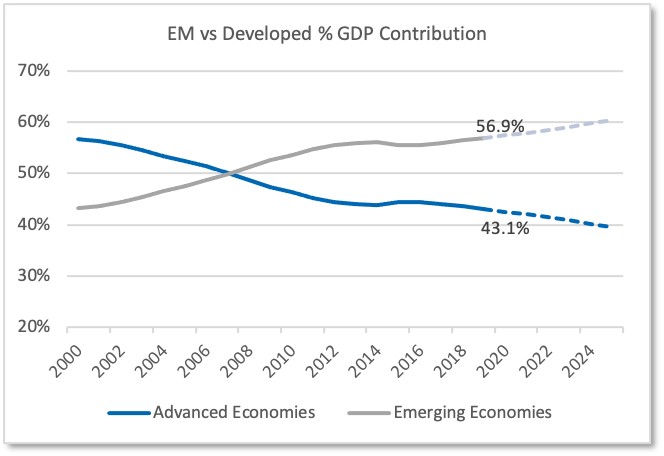
Growing Contribution to GDP: Over the past few years, emerging economies contributed an increasingly higher percent share to global productivity. EM contribution to GDP was 56.9% in 2019, while advanced economies contributed 43.1%. The International Monetary Fund (IMF) forecasts this trend to continue into 2024, making emerging markets an attractive long-term investment opportunity.
Hot Spot for Disruptive Innovation: Emerging markets typically lack the infrastructure and technologies of developed nations. This presents ample opportunity for the region’s younger, more tech-savvy population to embrace innovation. Global leaders including the World Bank have also recognized the tech disparity and have provided funding for infrastructure enhancements.
COVID-19 in Emerging Markets – Some Juggle While Others Struggle
Contrary to expectations, emerging markets have weathered the pandemic better than expected. A younger population and lower obesity rates have helped certain emerging countries wither down mortality rates. Accommodative fiscal and monetary policy through asset purchases and fiscal stimulus modeled after developed nations helped keep many economies afloat.
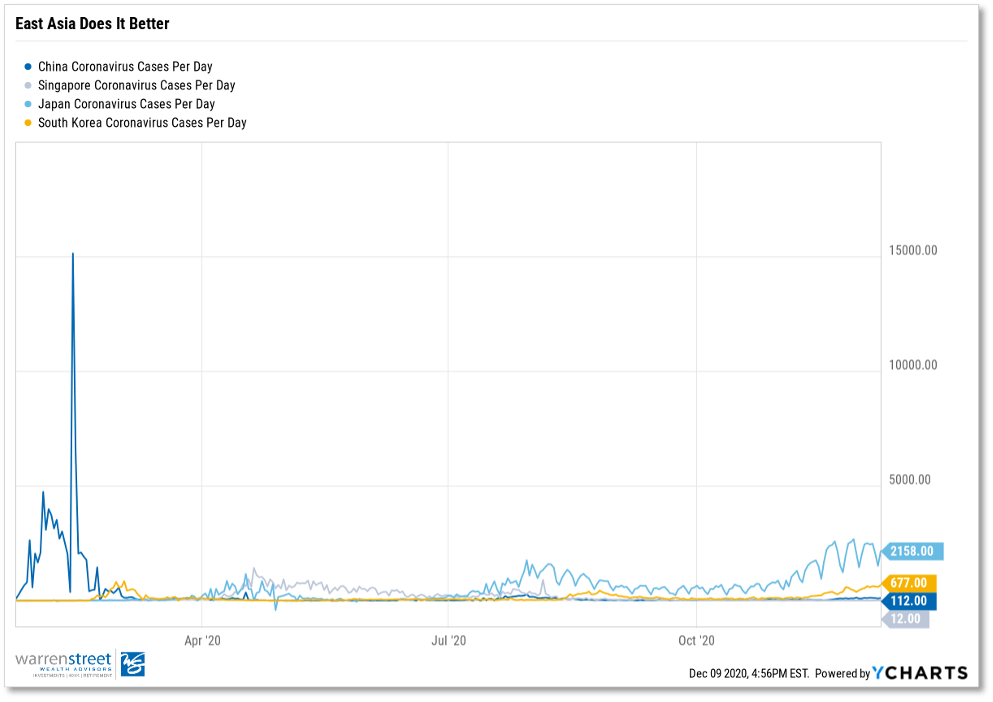
East Asian countries, China in particular, have exemplified great handling of the Coronavirus. As a result, EM has rallied 24.3% since the market bottomed (data spanning March 23 to December 8). China is also the only country expected to report positive GDP growth for 2020. Although it’s best to view Chinese data with a skeptical eye, investors cannot deny the nation’s swift return to economic activity.
Data as of 12-08-2020
Nevertheless, China’s success isn’t shared by all. Developing nations dependent on oil exports, tourism, or general commodities have and will continue to struggle as trade activity remains low. Certain EM hotspots including Russia and Brazil are also finding difficulty with containing virus spread. Highly indebted economies face risks of debt sustainability with limited room for policy enactment.
The Emerging Markets Story…to be Valued
EM equities experienced a mass exodus in March as investors questioned whether the infrastructure and economic inexperience of developing countries could properly combat the Coronavirus. Fund flows faced pressures until investors began acknowledging fruitful economic and health responses to COVID-19. Even after rallying this year, the long-term valuations for emerging markets look attractive.
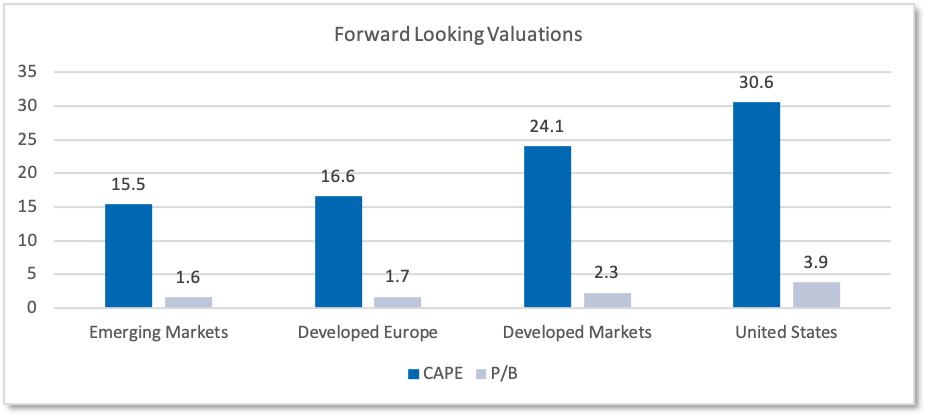
Data as of 9-30-2020. Source: StarCapital
According to StarCapital research, emerging markets have the cheapest cyclically adjusted price to earnings ratio (CAPE) and price-to-book (P/B) ratio relative to developed countries over the next 10-15 years. Factor in the expected structural improvements, emerging markets exhibit ample opportunity for value appreciation should the demographic and technological trends fall in line. You may also find comfort in knowing that emerging markets are expected to have the sharpest recovery post COVID-19.
Data as of 10-16-2020. Source: Wall Street Journal
What Will the Next Decade Look Like?
Despite some commendable pandemic responses and attractive valuations over the next decade, it is imperative to consider COVID-19’s impact on the region’s secular trends. Take China’s “Great Rebalancing,” for example. After years of export-driven GDP growth, the country adopted a “Great Rebalancing” plan to generate their economic prowess from organic consumer-driven activity rather than overseas trade.
When the Coronavirus struck, both Chinese businesses and consumers halted activity. Unwilling consumers, shocked by the events in Wuhan, emptied the streets as factories shut down. Once a recovery was en-route, business activity quickly climbed back to pre-pandemic levels, but scarred consumers left their homes thrift-conscious and hesitant. This led some to believe that China’s “Great Rebalancing” plan was at stake.
The Chinese customer today, has regained confidence, mainly from the government’s ability to eliminate almost any possibility of second wave. As we said earlier, China’s success is not shared by all, and whether or not secular trends will hold in other emerging nations — who have varying health and economic conditions – will be a mixed bag.
Bringing It All Home
Although prudent investors can exploit opportunities in countries that have exhibited short-term resiliency, the ability to maintain a long-term perspective and understand the landscape of your investments is keen. Here at Warren Street Wealth Advisers, our focus is not only to avoid home-country bias and to uncover the next areas of outperformance, but also to educate our clients about our long-term decision making.
For any questions regarding international investments, emerging markets, or wealth management, please call 714-876-6200 or email phillip@warrenstreetwealth.com.
Phillip Law, Portfolio Analyst
Wealth Advisor, Warren Street Wealth Advisors
Investment Advisor Representative, Warren Street Wealth Advisors, LLC., a Registered Investment Advisor
The information presented here represents opinions and is not meant as personal or actionable advice to any individual, corporation, or other entity. Any investments discussed carry unique risks and should be carefully considered and reviewed by you and your financial professional. Nothing in this document is a solicitation to buy or sell any securities, or an attempt to furnish personal investment advice. Warren Street Wealth Advisors may own securities referenced in this document. Due to the static nature of content, securities held may change over time and current trades may be contrary to outdated publications. Form ADV available upon request 714-876-6200.
https://warrenstreetwealth.com/wp-content/uploads/2020/12/clay-banks-b5S4FrJb7yQ-unsplash-scaled.jpg25601708Phillip Law, CFAhttps://warrenstreetwealth.com/wp-content/uploads/2014/11/Warren_Street_logo-01.svgPhillip Law, CFA2020-12-11 20:55:222020-12-11 21:30:18How Will Emerging Markets “Emerge” From 2020?
Earlier in 2020 the “Paycheck Protection Program” was passed, which allowed for much needed aid for struggling small businesses during the Coronavirus pandemic. One of the main features of the Paycheck Protection Program was the ability to potentially have your loan amount forgiven, tax free.
While this is a great benefit, one of the many grey areas that arose was whether or not expenses that were paid by the business using PPP funds were eligible for a tax deduction. While the funds may have been spent on business related items that would normally be tax deductible, it was unclear whether this same treatment would be available for those who received tax free PPP loan forgiveness.
On November 18th, 2020 the IRS and Treasury Department Secretary Steven Mnuchin issued some additional guidance to assist in clearing up some of the confusion. The statement issued expressed that “since businesses are not taxed on the proceeds of a forgiven PPP loan, the expenses are not deductible. This results in neither a tax benefit nor tax harm since the taxpayer has not paid anything out of pocket.” It then went on to state that “if a business reasonably believes that a PPP loan will be forgiven in the future, expenses related to the loan are not deductible, whether the business has filed for forgiveness or not.” Therefore, they encouraged businesses to file for forgiveness as soon as possible. In the case where a PPP loan was expected to be forgiven, and it is not, the statement outlined that businesses will be able to deduct those expenses.
As you can imagine, this was not the desired outcome for many business owners. Currently there is a fight within Congress, the Treasury Department, as well as in the business and tax communities regarding this interpretation of the PPP language. Many in Congress from both sides of the aisle argue that this interpretation of the language in the Bill does not align with Congressional intent. For example, Senate Finance Committee Chairman Chuck Grassley (R-Iowa) and Ranking Member Ron Wyden (D-Ore.) released a joint statement expressing their opinion that the expenses should be considered deductible. With Congress currently negotiating both a spending bill and second stimulus package, many hope the rules around deductibility of these expenses will be specifically outlined soon.
If you are a business owner impacted by this, unfortunately the best course of action is to remain patient with hopes of some additional Congressional action coming shortly. As always with Congress, it is unclear when they will act and what will be in the final version of the Bill. Ideally, this will be addressed prior to Congress’ holiday adjournment on December 18th, 2020. For the time being we are forced to assume that these expenses will not be deductible until additional Congressional action says otherwise. As always, when it comes to anything tax-related, your best course of action is always to work directly with your CPA and tax professional.
Investment Advisor Representative, Warren Street Wealth Advisors, LLC., a Registered Investment Advisor
The information presented here represents opinions and is not meant as personal or actionable advice to any individual, corporation, or other entity. Any investments discussed carry unique risks and should be carefully considered and reviewed by you and your financial professional. Nothing in this document is a solicitation to buy or sell any securities, or an attempt to furnish personal investment advice. Warren Street Wealth Advisors may own securities referenced in this document. Due to the static nature of content, securities held may change over time and current trades may be contrary to outdated publications. Form ADV available upon request 714-876-6200.
https://warrenstreetwealth.com/wp-content/uploads/2020/12/the-new-york-public-library-w8uU35aGU6A-unsplash-scaled.jpg25602463Justin D. Rucci, CFP®https://warrenstreetwealth.com/wp-content/uploads/2014/11/Warren_Street_logo-01.svgJustin D. Rucci, CFP®2020-12-11 20:08:392020-12-11 20:56:18What to Expect For Expense Deductions if You’ve Taken a Paycheck Protection Program Loan
Election seasons are highly polarized and leave investors from both sides of the political aisle paralyzed by what-ifs and fear of the other. This seems more true now than ever. Given COVID-19, supreme court implications, and an incredibly divided nation in terms of policy wishes, we expect a volatile finish to 2020. Due to an expected record number of mail-in ballots due to the election, it’s even possible the results aren’t known for days or even weeks. It’s normal to be concerned, but does the data support it? Does taking investment action make sense?
Believe it or not, I wrote the above days before President Trump and the First Lady contracted COVID-19. Can 2020 have any more twists and turns? Our team at Warren Street sends our thoughts and well wishes to them both, their families, and their staff. We hope a speedy and full recovery ensues. The diagnosis for President Trump is undoubtedly troubling given his age and possible pre-existing conditions, it’s sure to inject additional doubt into investors’ minds. CDC data however is still dramatically in his favor and it’s safe to assume he’ll receive best-in-class care. Historically, election seasons have in-fact provided for increased volatility in the markets. In addition, the dispersion in results and returns has been all over the map especially in the short term. You should find comfort however in the fact that long term returns have generally been positive regardless of who’s been at the Presidential helm or a split vs. unified congress. More details to come.
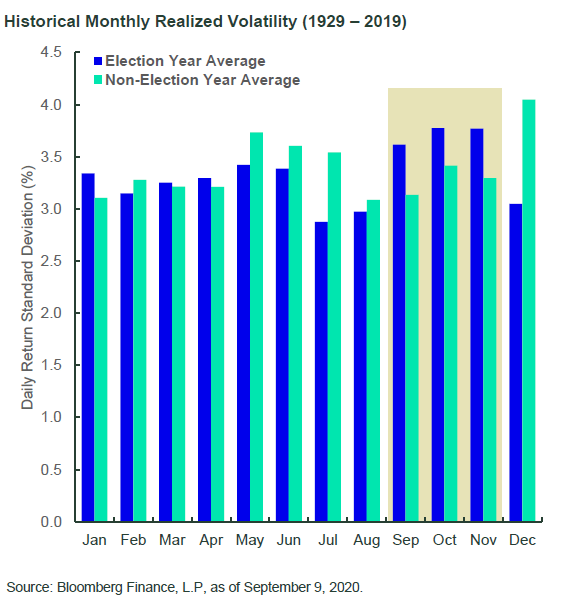
Let’s start with volatility (chart below). Taking a look back to 1929 you’ll see that the election year realized volatility exceeds non-election year volatility in September-November by a rather dramatic amount as measured by daily standard deviation in returns. I can’t say whether the current September 2020 volatility is caused or simply correlated to this phenomena. With U.S. stocks down over 7% 9/1-9/23 there’s plenty going on in the world to not simply chalk this up to election hysteria.
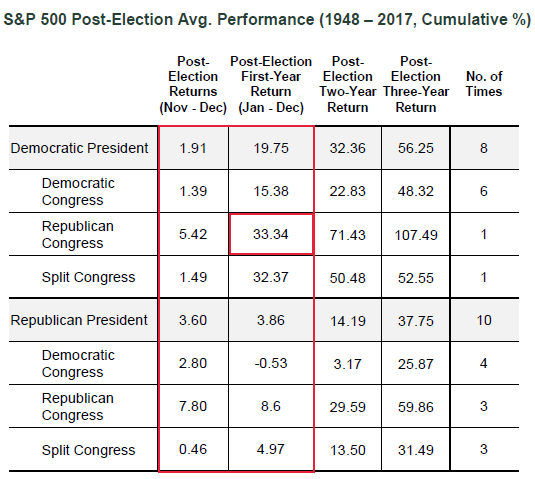
Now that volatility is out of the way, let’s talk returns, starting with short term returns. It is abundantly clear what investors prefer, and it isn’t what you’d think. The President is less significant than the balance of power. Returns tend to be best with a split congress, or in the best performing case a Democrat for President with a Republican congress. Why might that be? Gridlock. Investors love the status quo, but more so corporations love the predictability that comes with it. The ability to invest, forecast, and produce without the prospects of a changing playing field often lends itself to unimpeded growth.
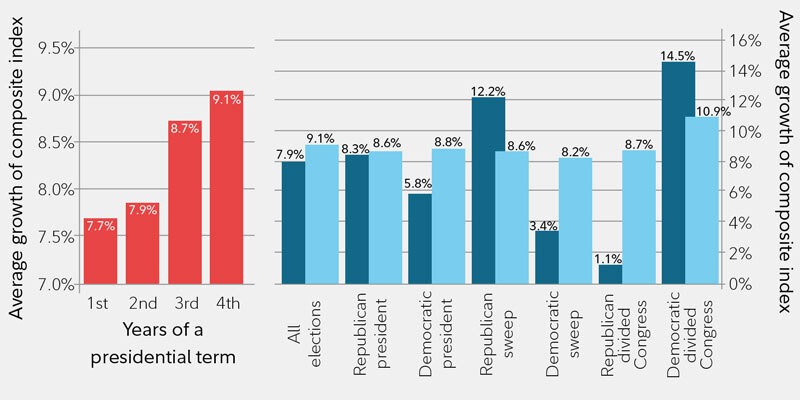
We all learned in 2016 that polling is VERY fallible. Here we find ourselves again with a rapidly changing landscape of polling results, and most of which seem to be consolidating into the margin for error. Meaning both the Presidential and the Congressional races can go any which way. If we were betting, we’d likely expect a blue wave (Biden win and Democrats take over the Senate). Most of this is because incumbents just simply don’t win while in a recession, it’s only happened once in the last 100 years. The bad news, a Democratic sweep is actually one of the worst outcomes for investment markets historically over the corresponding 2 years (blue below) post election. The good news, you can barely tell a difference after 4 years (light blue below) regardless of who is in office, Presidential or Congressional.
Source: FMRCo
So what do we do now? Proceed with caution. Obviously this election is unparalleled in so many ways, and because of that we can’t solely rely on historical data to give us permission to proceed with blinders on. Having said that, you can make a bullish case for U.S. and Global securities regardless of who wins. What types of companies and which geographies you favor might look very different however. Each party has a different impact on tax code, currency stability, trade relations, etc. It’s important to construct your portfolio with these varied outcomes in mind and not be married to one outcome to succeed.
If you want to review your current investment posture as we head toward the stretch of election season 2020, please don’t hesitate to reach out to our team.
Blake Street, CFA, CFP®
Wealth Advisor, Warren Street Wealth Advisors
Investment Advisor Representative, Warren Street Wealth Advisors, LLC., a Registered Investment Advisor
The information presented here represents opinions and is not meant as personal or actionable advice to any individual, corporation, or other entity. Any investments discussed carry unique risks and should be carefully considered and reviewed by you and your financial professional. Nothing in this document is a solicitation to buy or sell any securities, or an attempt to furnish personal investment advice. Warren Street Wealth Advisors may own securities referenced in this document. Due to the static nature of content, securities held may change over time and current trades may be contrary to outdated publications. Form ADV available upon request 714-876-6200.
https://warrenstreetwealth.com/wp-content/uploads/2020/10/element5-digital-2i7Dn2uMEQE-unsplash-scaled.jpg25601709Blake Streethttps://warrenstreetwealth.com/wp-content/uploads/2014/11/Warren_Street_logo-01.svgBlake Street2020-10-02 11:16:002020-10-02 18:16:36Will Your Vote Move the Market?
https://warrenstreetwealth.com/wp-content/uploads/2020/09/actionvance-n-2_KHgeAy0-unsplash-scaled.jpg17072560Phillip Law, CFAhttps://warrenstreetwealth.com/wp-content/uploads/2014/11/Warren_Street_logo-01.svgPhillip Law, CFA2020-09-15 22:13:112020-09-16 15:37:31Fiscal & Monetary Policy – How Long Can They Stay Heroes?
https://warrenstreetwealth.com/wp-content/uploads/2020/09/Screen-Shot-2020-08-31-at-5.26.36-PM-e1598985462379.png274412Blake Streethttps://warrenstreetwealth.com/wp-content/uploads/2014/11/Warren_Street_logo-01.svgBlake Street2020-09-01 18:08:452020-09-01 18:52:11Where Are We Now?
Wow! Our last published piece on the blog was “2019: A Year for the Record Books”. Two months later and the peace and quiet of yesteryear seem a distant memory. Scary days have arrived, thanks to the concern over how coronavirus might impact our global economy. As we draft this update, headlines are reporting the biggest weekly stock market losses since 2008.
We do not know whether the current correction will deepen or soon dissipate. It is important to remember that what was good advice in mild markets remains good advice today. Given the current climate, let’s take a look at a sound unemotional treatment plan for your nest-egg.
We continue to advise against panicked reactions to market conditions, or trying to predict an unknowable future. That being said, we are aggressively looking for ways to help our clients make lemonade out of this week’s lemons – such as through disciplined portfolio rebalancing and strategic tax loss harvesting. On Friday February 28th, we executed both on behalf of our private wealth clients.
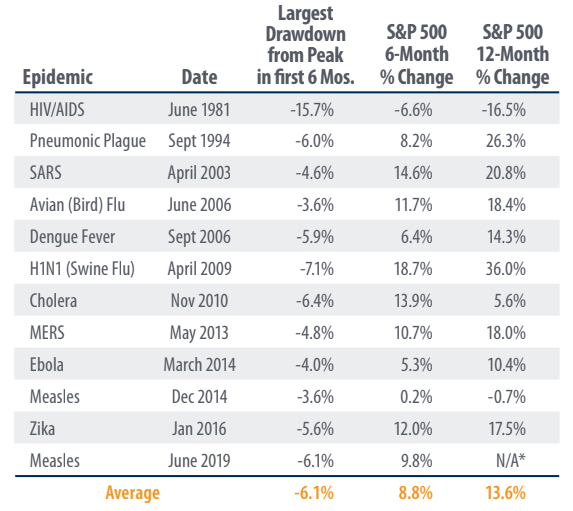
Other lemonade ideas include refinancing your mortgage as interest rates have hit historic lows or executing a ROTH conversion while your portfolio is down, turning the recovery into tax free growth. More than anything, as you’ll see below, a long term perspective during an epidemic pays.
*First Trust
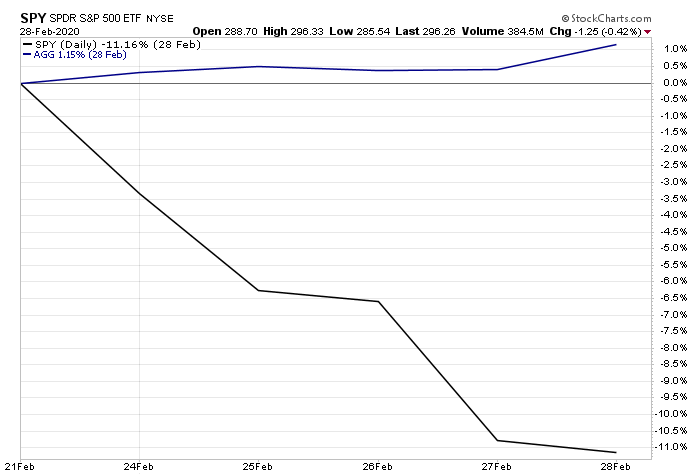
In 11 of the 12 cases above, the U.S. Stock Market was positive 6 months after an epidemic broke out, with an average return of 8.8%. In 9 of the 11 cases the U.S. Stock Market was positive 12 months after with an average return of 13.6%. It’s also important to note diversification worked last week with U.S. Bonds actually netting a positive return while U.S. stocks were down 11.5%.
@StockCharts – US Market represented by SPY. US Bonds by AGG.
If we can be of assistance or you want to talk through any of this, please do not hesitate to reach out to our team. In the meantime, here are 10 things you can do right now while markets are at least temporarily tanking.
1. Don’t panic (or pretend not to). It’s easy to believe you’re immune from panic when the financial sun is shining, but it’s hard to avoid indulging in it during a crisis. If you’re entertaining seemingly logical excuses to bail out during a steep or sustained market downturn, remember: It’s highly likely your behavioral biases are doing the talking. Even if you only pretend to be calm, that’s fine, as long as it prevents you from acting on your fears.
“Every time someone says, ‘There is a lot of cash on the sidelines,’ a tiny part of my soul dies. There are no sidelines.” – Cliff Asness, AQR Capital Management
2. Redirect your energy. No matter how logical it may be to sit on your hands during market downturns, your “fight or flight” instincts can trick you into acting anyway. Fortunately, there are productive moves you can make instead – such as all 10 actions here – to satisfy the itch to act without overhauling your investments at potentially the worst possible time.
“My advice to a prospective active do-it-yourself investor is to learn to golf. You’ll get a little exercise, some fresh air and time with your friends. Sure, green fees can be steep, but not as steep as the hit your portfolio will take if you become an active do-it-yourself investor.” – Terrance Odean, behavioral finance professor
3. Remember the evidence. One way to ignore your self-doubts during market crises is to heed what decades of practical and academic evidence have taught us about investing: Capital markets’ long-term trajectories have been upward. Thus, if you sell when markets are down, you’re far more likely to lock in permanent losses than come out ahead.
4. Manage your exposure to breaking news. There’s a difference between following current events versus fixating on them. In today’s multitasking, multimedia world, it’s easier than ever to be inundated by late-breaking news. When you become mired in the minutiae, it’s hard to retain your long-term perspective.
“Choosing what to ignore – turning off constant market updates, tuning out pundits purveying the latest Armageddon – is critical to maintaining a long-term focus.” – Jason Zweig, The Wall Street Journal
5. Revisit your carefully crafted investment plans (or make some). Even if you yearn to go by gut feel during a financial crisis, remember: You promised yourself you wouldn’t do that. When did you promise? When you planned your personalized investment portfolio, carefully allocated to various sources of expected returns, globally diversified to dampen the risks involved, and sensibly executed with low-cost funds managed in an evidence-based manner. What if you’ve not yet made these sorts of plans or established this kind of portfolio? Then these are actions we encourage you to take at your earliest convenience.
“Thus, the prudent strategy for investors is to act like a postage stamp. The lowly postage stamp does only one thing, but it does it exceedingly well – it adheres to its letter until it reaches its destination. Similarly, investors should adhere to their investment plan – asset allocation.” – Larry Swedroe, financial author
6. Reconsider your risk tolerance (but don’t act on it just yet). When you craft a personalized investment portfolio, you also commit to accepting a measure of market risk in exchange for those expected market returns. Unfortunately, during quiet times, it’s easy to overestimate how much risk you can stomach. If you discover you’re miserable to the point of breaking during even modest market declines, you may need to re-think your investment plans. Start planning for prudent portfolio adjustments, preferably working with an objective advisor to help you implement them judiciously over time.
“Our aversion to leverage has dampened our returns over the years. But Charlie [Munger] and I sleep well. Both of us believe it is insane to risk what you have and need in order to obtain what you don’t need.” – Warren Buffett, Berkshire Hathaway
7. Double down on your risk exposure – if you’re able. If, on the other hand, you’ve got nerves of steel, market downturns can be opportunities to buy more of the depressed (low-price) holdings that fit into your investment plans. You can do this with new money, or by rebalancing what you’ve got (selling appreciated assets to buy the underdogs). This is not for the timid! You’re buying holdings other investors are fleeing in droves. But if can do this and hold tight, you’re especially well-positioned to make the most of the expected recovery.
8. Tax-loss harvest. Depending on market conditions and your own circumstances, you may be able to use tax-loss harvesting during market downturns. A successful tax-loss harvest lowers your tax bill without substantially altering or impacting your long-term investment outcomes. This action is not without its tricks and traps, however, so it’s best done in alliance with a financial professional who is well-versed in navigating the challenges involved.
9, Revisit this article. There is no better time to re-read this article than when the going gets tough, when yesterday’s practice run is no longer an exercise but a real event. Maybe it will take your mind off the barrage of breaking news.
“We’d never buy a shirt for full price then be O.K. returning it in exchange for the sale price. ‘Scary’ markets convince people this unequal exchange makes sense.” – Carl Richards, Behavior Gap
10. Talk to us. We didn’t know when. We still don’t know how severe it will be, or how long it will last. But we do know markets inevitably tank now and then; we also fully expect they’ll eventually recover and continue upward. Since there’s never a bad time to receive good advice, we hope you’ll be in touch if we can help.
Investment Advisor Representative, Warren Street Wealth Advisors, LLC., a Registered Investment Advisor
The information presented here represents opinions and is not meant as personal or actionable advice to any individual, corporation, or other entity. Any investments discussed carry unique risks and should be carefully considered and reviewed by you and your financial professional. Nothing in this document is a solicitation to buy or sell any securities, or an attempt to furnish personal investment advice. Warren Street Wealth Advisors may own securities referenced in this document. Due to the static nature of content, securities held may change over time and current trades may be contrary to outdated publications. Form ADV available upon request 714-876-6200.
https://warrenstreetwealth.com/wp-content/uploads/2020/02/asdasd-1.png400600Blake Streethttps://warrenstreetwealth.com/wp-content/uploads/2014/11/Warren_Street_logo-01.svgBlake Street2020-02-29 01:43:462021-06-07 17:13:33Coronavirus: Here’s a Portfolio Treatment Plan