You’ve likely seen headlines comparing today’s AI-driven market to the late-1990s dot-com era. We take those comparisons seriously. This note outlines what’s different today, what still deserves caution, and, most importantly, how we’re positioning your strategy to hold up across a range of outcomes.1
Where Valuations Stand
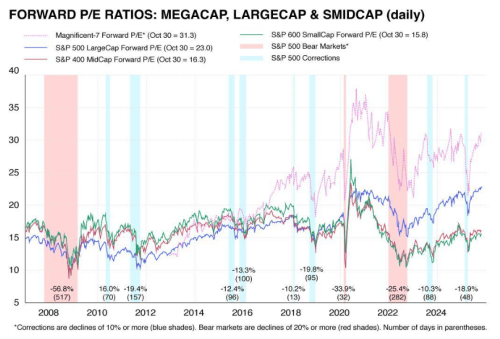
Stock prices have climbed, and by simple measures of “price versus earnings,” the market looks more expensive than its long-term average. That’s a reason for discipline. However, it’s also true that the broad market remains below the most extreme levels reached in the late 1990s. You can see this in the valuation charts that track the relationship between prices and earnings over time.2
What’s Different From Dot‑Com Era
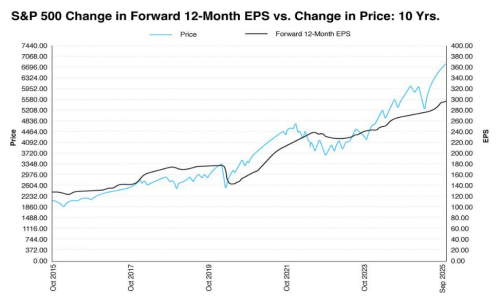
Back then, Barron’s magazine cover story in March 2000, called “Burning Up,” reported that 74% of 207 publicly traded internet companies had “negative cash flows” and at least 51 of those companies were projected to run out of money in the next 12 months. In contrast, today the largest parts of the market are producing real earnings, and overall profit margins across the major U.S. index remain above their five-year average. That doesn’t remove risk, but it does mean prices are supported by business results that we didn’t see from some companies in the dot-com cycle. FactSet’s latest quarterly review provides a good snapshot.3
AI Isn’t Just a Story—There’s Heavy Investment Behind It
A big reason certain companies have led is the build-out of the “plumbing” for AI: data centers, chips, software, and power. You can see this in government data, which shows manufacturing construction near record highs, much of it related to chip facilities, and in rising business spending on information-processing equipment and software. Those are dollars going into real plants, servers, and tools that support future productivity.4,5
Real Fundamentals – But Are AI Profits a Distant Dream?
Today’s AI landscape, where players boast robust business models and real fundamentals stemming from their core businesses, still is not without questions. While fortress balance sheets, resilient revenue, and strong earnings growth remain in place, the central point becomes: does the uncertain return on investment for AI justify the existing valuation levels, even if they aren’t as extreme as the Dotcom era?
We have to remember that many of today’s leading AI companies still look expensive based on profits they made last year. Meanwhile, the forward looking bull-argument rests entirely on whether their earnings will grow to meet the evergrowing mountain of expectations.
Intertwining Illusions of Growth
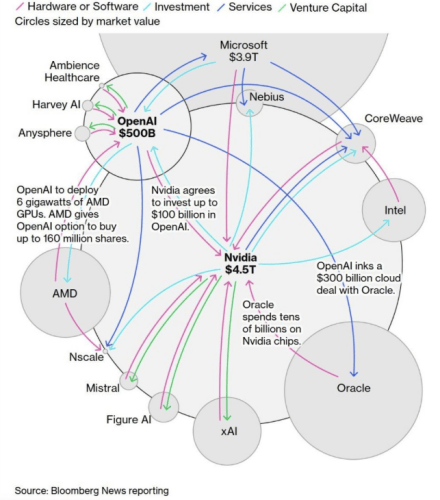
Beyond the frothy valuations, the AI hyperscaler ecosystem can feel like an Ouroboros (i.e., a snake that eats its own head). Okay, maybe that’s a bit extreme. However, it doesn’t take away from the increasingly circular dance of chipmakers, cloud providers, and foundational AI companies increasingly investing in one another.
Take for example, Microsoft’s $13billion investment in OpenAi in exchange for OpenAI agreeing to purchase $250 billion in Azure cloud services over the next decade. Microsoft is relying on OpenAI to find real, external customers to honor commitments in due time.
However, readers should ask – even if OpenAI succeeds in building an Artificial Generative Intelligence (AGI), will there be enough downstream demand for its products and services (especially if AI is displacing jobs)? Or will the primary customer base for AGI simply be the same tech giants who funded its creation? With more interdependence, one setback amongst one of these players could ripple across the entire industry.
Put simply, today’s “booming” AI revenue isn’t necessarily from new, organic customers with demand for AI services – it’s an internal recycling of investment capital that creates an illusion of growth where economic profit from external customers remains largely hypothetical. While long-term prospects for AI remain strong and we aren’t predicting a bubble, does being invested in an “expensive,” concentrated space predicated on nascent technologies warrant a closer look? We think it does.
How We’re Managing Your Strategy
That brings us to AI and concentration levels in US Markets. While we’re not sounding alarm bells or declaring an “AI Bubble,” we do recognize concentrated exposure in US Markets (and especially to AI) presents vulnerabilities. That’s why we continue to build adequately diversified portfolios that not only invest around the globe, but also across asset classes such as bonds, gold, and commodities. Recently, we’ve performed a partial rebalance of our market-cap weighted S&P 500 holdings (heavily concentrated to AI) towards US companies with stronger balance sheets and profitability (i.e., “quality” characteristics). Ultimately, we believe we’re in a state where diversifying our client’s sources of “risk” will be prudent for meeting their long-term goals.
If you’d like to meet and discuss how your portfolio is positioned for both stronger and more challenging environments, please give us a call to schedule a meeting.9,10
Bottom line, your portfolio is being actively managed with vigilance and care, and we’re always here if you’d like to discuss further.
Phillip Law, CFA
Senior Portfolio Manager, Warren Street Wealth Advisors
Investment Advisor Representative, Warren Street Wealth Advisors, LLC., a Registered Investment Advisor
The information presented here represents opinions and is not meant as personal or actionable advice to any individual, corporation, or other entity. Any investments discussed carry unique risks and should be carefully considered and reviewed by you and your financial professional. Nothing in this document is a solicitation to buy or sell any securities, or an attempt to furnish personal investment advice. Warren Street Wealth Advisors may own securities referenced in this document. Due to the static nature of content, securities held may change over time and current trades may be contrary to outdated publications. Form ADV available upon request 714-876-6200.
The S&P 500 Composite Index is an unmanaged index that is considered representative of the overall U.S. stock market. Index performance is not indicative of the past performance of a particular investment. Past performance does not guarantee future results. Individuals cannot invest directly in an index. The return and principal value of stock prices will fluctuate as market conditions change. And shares, when sold, may be worth more or less than their original cost.
The term “Magnificent 7” refers to a group of seven influential companies in the S&P 500, including Apple, Microsoft, Alphabet (Google), Amazon, Nvidia, Tesla, and Meta Platforms.
The S&P MidCap 400 is a benchmark for mid-sized companies. The index is designed to measure the performance of 400 mid-sized companies,
The S&P SmallCap 600 is a benchmark for small-cap companies. The index is designed to track companies that meet inclusion criteria, which include liquidity and financial viability.
4. Fred.StLouisFed.org, September 25, 2025. “Total Construction Spending: Manufacturing (TLMFGCONS) (manufacturing construction near record highs)” https://fred.stlouisfed.org/series/TLMFGCONS FRED
https://warrenstreetwealth.com/wp-content/uploads/2025/11/AI-Headlines-and-Your-Portfolio-Context-That-Helps.png10801080Phillip Law, CFAhttps://warrenstreetwealth.com/wp-content/uploads/2014/11/Warren_Street_logo-01.svgPhillip Law, CFA2025-11-19 07:06:002025-11-18 13:15:16Decoding the AI Hype: How Today’s Market Compares to the Dot-Com Bubble
If you’re a business owner, you’ll eventually step away from the company you’ve built. You might cash out to the highest bidder or work out a deal to sell the business to the next generation of your family or even to employees. The question is will you be able to make this transition on your own terms? The reality is that most business owners don’t have a clear, documented exit plan. And if you find yourself among them, you could find it leaves you in a tight spot when it’s time for you to step down.
Delaying planning your exit risks settling for a below-market sale price, losing control of choosing your successor or rushing into choices that don’t reflect your vision. Delays also leave you with little time to take steps to boost the business’s valuation and ensure business continuity. A clear exit plan helps maximize options and value. If you haven’t mapped out yours yet, there’s no time like the present. Consider these steps:
Put a Price on Your Business
Proper valuation of your business is the first step in exit planning. Some back-of-the-envelope math can provide a decent starting point. But to really understand what your business is worth, meet with a valuation expert. Besides a healthy dose of objectivity, these professionals bring market expertise and a knowledge of valuation standards. They can identify intangible sources of value you may have overlooked and help ensure your valuation passes muster with potential buyers and the IRS.
There are three main approaches to determining value:
The asset approach adds up the value of your company’s tangible and intangible assets, then subtracts liabilities.
The income approach calculates value according to your business’s expected future cash flows.
The market approach compares your business to recent sales of similar companies.
You may find one approach is more apt than another for the type of business you own, but a comprehensive valuation is likely to incorporate all three in one way or another. Bear in mind that valuation isn’t a one-time event. As your business grows and market conditions change, you’ll likely want to update your valuation.
Clarify Your Vision
Before you can build an effective exit plan, it’s necessary to clarify your goals. Be as specific as possible as you define what a successful transition looks like to you.
Some questions to keep in mind: Do you want to maximize the sale price, selling at the highest price possible? Do you intend to keep the business within your family or pass it to a handpicked successor? What are your obligations to employees? Is it important that your business maintains a consistent set of values when you’re gone? What timeline makes sense for you? How involved—if at all—do you want to be with the business after you exit?
The answers to these questions will guide the decisions that follow. They can be deeply personal, and we’re here to be a resource as you consider what’s truly important to you.
Shape Your Exit
With valuation and goals in hand, there are a range of steps you can take to support your transition. What you do will depend largely on the type of exit you’re planning. For some owners, you might make strategic adjustments to boost the value of your business, such as reducing unnecessary expenses or diversifying revenue streams to make your company more attractive to buyers.
If your plan involves transferring the business to a family member or a long-time employee, the sooner you identify them, the better. That way you’ll have plenty of lead time to train them in the leadership skills necessary to provide a smooth handoff. Depending on your situation, you might consider a sale, a gift or a combination of the two. Be aware that gifts to family members above the lifetime gift and estate tax exemption ($15 million for individuals in 2026) might trigger gift taxes. Meanwhile, sales to employees could trigger capital gains taxes. If your business is structured as an S corp or C corp, you might consider an employee stock ownership plan (ESOP), which could defer or even eliminate capital gain taxes if structured properly.
Seeking an external buyer? Preparation is equally as important. In addition to boosting your valuation, you’ll need to organize your financial records, legal documents, contracts, employee agreements and operational procedures. One thing to consider is the type of deal structure that works best for you: Would you like to be paid over time or in one lump sum? And would you like to exit the company immediately or would you be open to staying on in an advisory capacity to help the new owner learn the ropes?
Begin the process of finding and vetting buyers early. These could be industry competitors, investment groups or individual entrepreneurs who may be a good fit. A business broker can help you identify potential buyers and spread the word through their network.
Charting the Future
For many business owners, exit planning rarely tops the to-do list. After all, there are plenty of day-to-day demands competing for attention, let alone the fact that it can be difficult for owners to think about the day they’ll no longer lead the company they built. Yet the most successful exits are those planned in advance, allowing owners to optimize value, identify an ideal buyer or successor, and prepare their employees for a smooth transition.
If you’d like to start a conversation about exit planning, we’d be happy to help you explore your options, develop a strategy that meets your financial goals and protects your legacy. here to help ensure your financial strategy stays aligned with your goals.
Emily Balmages, CFP®
Director of Financial Planning, Warren Street Wealth Advisors
Investment Advisor Representative, Warren Street Wealth Advisors, LLC., a Registered Investment Advisor
The information presented here represents opinions and is not meant as personal or actionable advice to any individual, corporation, or other entity. Any investments discussed carry unique risks and should be carefully considered and reviewed by you and your financial professional. Nothing in this document is a solicitation to buy or sell any securities, or an attempt to furnish personal investment advice. Warren Street Wealth Advisors may own securities referenced in this document. Due to the static nature of content, securities held may change over time and current trades may be contrary to outdated publications. Form ADV available upon request 714-876-6200.
https://warrenstreetwealth.com/wp-content/uploads/2025/11/image.png9001600Emily Balmages, CFP®https://warrenstreetwealth.com/wp-content/uploads/2014/11/Warren_Street_logo-01.svgEmily Balmages, CFP®2025-11-07 08:52:472025-11-07 08:52:58Business Exit Strategies on Your Terms
Investors finally got the interest rate cut they were waiting for last month, but comments from the Federal Reserve Chair have some of them scratching their heads. Let’s see if we can make sense of these mixed signals.
Jerome PowellBrings Investors Up Short
The Fed reduced its target federal funds rate by 0.25% on September 17. Rate cuts tend to make equity investors optimistic: They figure lower interest rates will reduce borrowing costs, goosing economic activity and hopefully boosting corporate earnings and stock prices. This time around, investors may think the Fed cut helps validate the S&P 500’s nearly 35% gain since it bottomed in early April.
Then, a week after cutting rates, Fed Chair Jerome Powell uttered these words:
“By many measures…equity prices are fairly highly valued.”
Powell’s seemingly innocuous statement sounded like a loud needle scratch to some investors. Fed chairs don’t often comment on stock prices, so the fact that he chose this moment to highlight steep valuations raised questions.
Is Powell—a renowned economist with more and better information than just about anybody—saying stocks are too highly valued? Are prices about to drop? Should you sell before it’s too late?
Are Stocks Expensive Right Now?
On the surface, it’s hard to quibble with Powell’s take. The most common way to gauge the broad stock market’s valuation is to look at the price-to-earnings (P/E) ratio of the S&P 500. And it’s high: As of September 26, the S&P 500’s P/E was 20%above the average of the past 10 years.1
But the topic deserves a little more context. Certain parts of the stock market are driving up the average, so it’s probably more accurate to say that some equity prices are fairly highly valued.
Specifically, tech stocks have risen on investor optimism about the potential for AI to drive future earnings. The tech sector had a P/E ratio over 30 as of October 1, compared to about 23 for the S&P 500 as a whole. By contrast, the energy, financials, health care, materials and utilities sectors all had P/Es in the teens.2
Should You Sell When Stocks Are Pricey?
Everybody knows the investing adage “Buy low, sell high.” However, applying this in practice isn’t always straightforward. Fact is, pricey stocks can get more expensive, such that exiting stock positions solely based on valuations can materially harm portfolio outcomes in the short-term. In fact, a study by LPL Financial comparing historical stock market valuation to returns over the next 12 months found “no relationship whatsoever.”3
Just ask another renowned Fed Chair, Alan Greenspan. Almost 30 years ago, he famously described “irrational exuberance” in the stock market—and the S&P 500 surged more than 100% over the following four years.4
While valuations are a poor short-term timing tool, it’s true that high valuations can temper future returns.5 To address this, we have recently implemented a rebalancing strategy across our client accounts. This essential process automatically takes profits from assets that have become highly valued and redirects those funds to areas we believe have better forward-looking potential, ensuring your allocation stays on target.
Run-ups in the prices of some investments can throw off your asset allocation—the percentage of your portfolio you have devoted to specific investment types. That’s why we periodically rebalance your portfolio, resetting your allocations to your long-term targets. This process automatically reduces how much you have in assets that have gained the most and redirects those resources toward assets that have lagged.
Your financial plan is designed to weather the short term so you can focus on the long term. But if there’s ever a news story that gives you pause, you can always reach out to us to help put it into perspective.
Phillip Law, CFA
Senior Portfolio Manager, Warren Street Wealth Advisors
Investment Advisor Representative, Warren Street Wealth Advisors, LLC., a Registered Investment Advisor
The information presented here represents opinions and is not meant as personal or actionable advice to any individual, corporation, or other entity. Any investments discussed carry unique risks and should be carefully considered and reviewed by you and your financial professional. Nothing in this document is a solicitation to buy or sell any securities, or an attempt to furnish personal investment advice. Warren Street Wealth Advisors may own securities referenced in this document. Due to the static nature of content, securities held may change over time and current trades may be contrary to outdated publications. Form ADV available upon request 714-876-6200.
https://warrenstreetwealth.com/wp-content/uploads/2025/10/Fed-Rate-Cut.png10801080Phillip Law, CFAhttps://warrenstreetwealth.com/wp-content/uploads/2014/11/Warren_Street_logo-01.svgPhillip Law, CFA2025-10-08 09:59:362025-10-08 09:59:58Rate Cut vs. Reality: Making Sense of Powell’s Mixed Signals
As summer winds down, your thoughts may drift toward a final escape. Whether your idea of a perfect getaway is one last trip to a pristine beach, fishing in a mountain lake, or playing the back nine between pickleball matches, many of our clients have come to us over the years with the same question—should I buy a vacation home or just continue to rent?
As financial professionals, our answer is, “It depends.”
Renting a house for a week or two can be less expensive and time-consuming than buying a vacation property. Renting is a short-term commitment, while buying a second home often requires an ongoing investment of time and money. Renting allows you to choose different vacation destinations every year without maintenance and upkeep concerns. However, buyers can decide to rent out the property when they’re not there.
We caution our clients to consider the pros and cons before making decisions. While we aren’t real estate experts, we’ve compiled some information that you may find helpful.
Buying A Vacation Home
Non-Financial Considerations Many financial considerations must be pondered with a vacation property. Will you buy it outright or take out a mortgage? Are you interested in renting it when you’re not there? Will it impact your cash flow? There are also many nonfinancial issues you may want to consider, the most important being how a second home will affect your lifestyle.
Here are a few more aspects to consider before signing on the dotted line:
How Much Time Will You Spend There?1 If you only intend to spend a few weeks a year there, is renting a better choice? The expense and hassle of owning a second home may not be worth it unless you stay a few months each year to enjoy the place. Over time, you can develop friendships and become part of the community, making your second house more of a home.
How Does a Second Home Fit Into Your Travel Patterns?1 By owning a vacation home, you may spend less time traveling to other locations. Consider whether focusing vacation time on one location fits your desired travel patterns. For example, if you believe you’ll be happy spending all your free time in Florida, then buying may be right for you. However, you may feel tied down to one place if you like to travel the world.
Will a Second Home Increase Your Stress?1 Before buying, be aware of the potential stress of owning a second home. Like your primary residence, you’ll need to deal with utilities, maintenance, repairs, and other considerations. While you may find these issues worth the benefits of owning a vacation home, you should enter ownership with your eyes wide open.
Will Purchasing a Vacation Home Enhance Your Experiences and Relationships?1 If your vacation home becomes a hub for family and friends to visit and for you to engage in social activities and adventures with them, owning a second home can increase your happiness. Clients who enjoy their vacation homes the most tend to create memories through experiences with family and friends at their second homes. On the other hand, buying a vacation home primarily as a relaxing retreat may not add much to your overall happiness—despite the weather and scenery.
What Are the Potential Advantages of Buying a Vacation Property2 There are many good reasons to buy a vacation home. After considering the aforementioned nonfinancial factors, it may be the right course of action for you and your family. Here are some potential benefits:
Possible Real Estate Appreciation: One potential advantage to buying a vacation property is that the value of the real estate may increase over time. Of course, there are no guarantees, and your property could lose value.
Renting Costs for Your Vacation: Owning a property in a vacation spot means you won’t need to pay for weekly accommodations.
Perhaps Generate Rental Income: Another benefit to buying a vacation property is the opportunity to generate rental income. If you choose a vacation home in a bustling short-term rental market, you may have the chance to rent out your place when you’re not in town.
Convenience: Owning a vacation home can be more convenient than arranging short-term rentals. It’s also more familiar, comfortable, and allows you to host friends and family.
Retirement: A vacation home can be part of your retirement strategy. Some clients have used their second homes in later life and moved in permanently.
Potential Disadvantages of Buying a Vacation Property
Of course, where there are pros, there are cons. While we don’t want to rain on anyone’s parade, as financial professionals, we strive to provide a fair and balanced view. So, here are some of the potential downsides of buying a vacation property:
Money Management: Buying a property can be costly, especially a second home in an expensive vacation area. In addition to initial costs, there are also ongoing maintenance and other costs. If money is an issue, buying another house may not be your best choice.2
Financing: If you cannot self-finance your purchase, financing a vacation home can be challenging because of different mortgage requirements. A higher credit score and a larger down payment are often required to qualify for a mortgage. So, if you are not paying in cash, expect a more complicated financing experience than purchasing a primary residence.2
Property Management: If you plan to generate rental income when you’re not using your vacation home, you may want to hire a property manager to find renters, collect rent, and clean the place. This could add up to 15% of the rental income.2
Inconsistent Rental Income: Rental income often depends on the season or certain times of the year. There are usually seasonal periods when no one might rent. Vacation property rental income is impacted directly by the destination and its popular times, which can affect income.2
Lack of Disaster Aid: FEMA disaster assistance is limited to your primary home, i.e., where you live for more than six months out of the year. Second homes or vacation homes used as vacation rentals don’t qualify for FEMA assistance. Thus, if hurricanes, wildfires, or floods destroy or damage your second home, you must rely on other options.3
Markets for Luxury Second Homes
While demand for luxury second homes rose during the pandemic, you may think that today’s relatively high interest rates, tight inventory, and uncertain economic environment would’ve damaged the market. They haven’t.4
Despite the numerous challenges hitting residential real estate, the luxury housing market has remained strong. According to The Agency’s 2025 Red Paper, the number of U.S. homes selling for $1 million-plus increased by 5.2% in the first half of 2024, while the median price for high-end properties rose by 14.2%. Compared with the broader market, in which overall home sales fell by 12.9%, the median price increased by just 5% over the same period.4
With more cash on hand and fewer financial constraints, wealthy homebuyers are often less reliant on loans. According to The Agency’s report, homebuyers paid cash for nearly half of all luxury homes sold in the first quarter of 2024.4 So, if you’re in the market for a high-end second home, you’re in good company.
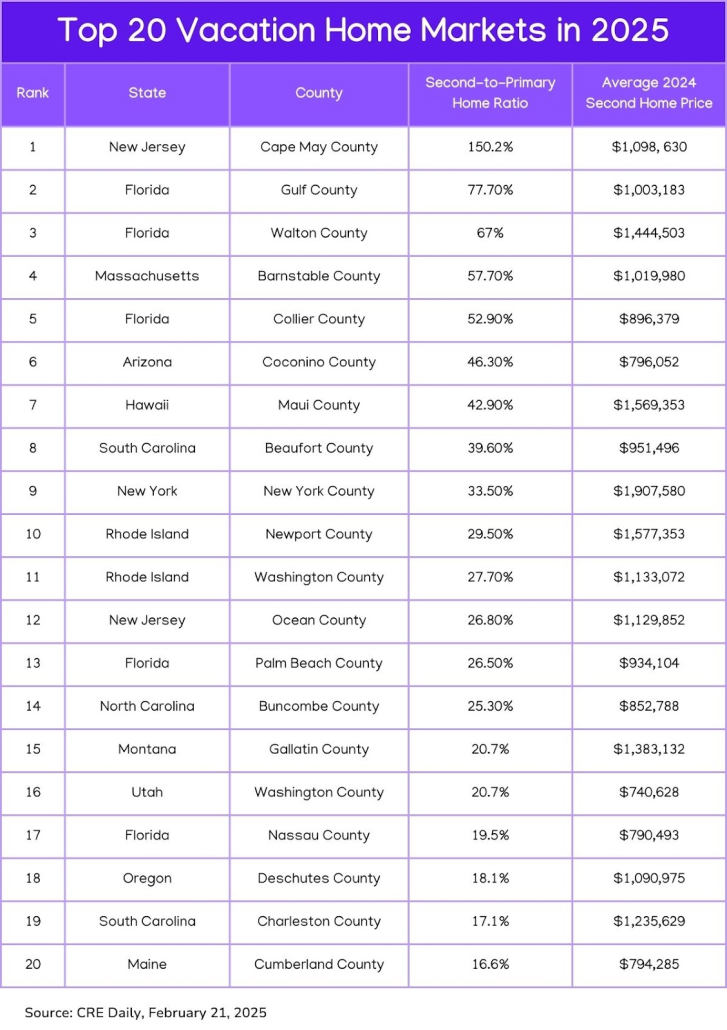
Real estate company Pacaso analyzed the markets with the most significant year-over-year growth in luxury second-home transactions from 2023 to 2024 and average prices for second homes. They believe these second-home destinations could see more growth this year.4
As you’ll see in the chart below, Cape May County, New Jersey, with its Victorian charm and sandy beaches, ranked as the top spot for second home purchases in 2025, with Gulf County, Florida, coming in as a distant runner-up.4
Suppose you’re looking for a second home selling at under $1 million. Washington County, Utah, near Zion National Park; Coconino County, Arizona, near Flagstaff; and Cumberland County in south-central Maine along the coast are popular locations.4
Insurance Considerations for Second Homes
Unless you have the resources to “self-insure,” you might want to consider homeowners insurance to protect your real estate purchase. Second home insurance is a specialized policy designed to cover properties that are not your primary residence. Policies differ because a second home may have additional risks not associated with your primary residence.
Standard homeowners’ insurance for a full-time residence costs an average of $1,754 per year, but you might pay more for a second home insurance policy. For example, American Family estimates that vacation home policies are typically two to three times more expensive than home insurance for a full-time residence.5
The additional risks that cause second home insurance to be higher include:6
Vacancy Periods: Unoccupied homes are more vulnerable to theft or damage.
Location-Based Risks: Coastal or mountainous properties may face specific hazards like hurricanes, floods, or wildfires.
Higher-End Property: If your second home is a luxury property, consider high-value property insurance.
Rental Use: If you rent to others, you may face additional liability concerns, such as tenant-caused damages and liability for injuries sustained by renters or their guests.
Banks will require that your second home be insured if you take out a mortgage. If you are paying cash, the insurance coverage you want, if any, is up to you. If you seek coverage, you should evaluate risks, compare providers, and determine if the policy aligns with your needs and property usage.
Including a Vacation Home in Your Estate
If you buy a vacation home, consider what happens to the property after you’re gone. If a family vacation home is part of your estate, you should put the time and effort into outlining your intentions for the next generation. Your heirs should know what they’re getting and the time, effort, and resources they’ll need to put into the property to keep it functioning well. You know your family’s dynamics and that not all of your heirs will have that same level of interest or involvement in the family vacation home. Thus, be mindful of this and flexible when creating your strategy.7
Consider working with your financial professional and estate team to determine the best way to transfer your vacation home based on your situation. Here are a few choices you may want to evaluate:7
Sell the house outright or gift it to one or more of your children.
Establish a trust in which one or more trustees are responsible for owning and maintaining the property. Using a trust involves a complex set of tax rules and regulations. Before moving forward with a trust, consider working with a professional familiar with the relevant rules and regulations.
Form an LLC or other legal entity where your heirs will be owners and follow specific governance rules and operating agreements in how the property is used.
As financial professionals, we can offer insights into how your vacation house may contribute to your overall estate strategy.
Tax Implications of Owning a Second Home
As we mentioned before, we’re not tax experts, but we work with people who are. We’re outlining some general information, but it’s not a replacement for real-life advice. Consult your tax, legal, and accounting professionals for more specifics regarding your second home.
If your second home is a residential home, you may be able to deduct mortgage interest up to $750,000 as long as the second home is the one that secures the loan. If your mortgage on your second home originated before Dec. 16, 2017, you can deduct up to $1 million in mortgage interest. You also can deduct state and local property taxes––up to $10,000 combined for all real estate taxes between your homes.8
If you rent your property for 14 days or less during the year, you may not need to report this as income to the IRS.8
If you rent your second home for more than 14 days a year, the IRS considers it an investment property. If your second home is an investment property, you might be able to deduct mortgage interest or real estate taxes on your personal income tax return. Still, you may be able to deduct those costs against your rental business income.8
When you sell your second home, you must be aware that you may not receive the same capital gains tax deduction when selling your primary residence – $250,000 for single filers and $500,000 for married.8
Renting a Vacation Home
If you have gone through all the pros and cons of buying a vacation home and are leaning toward renting, this approach also has two sides. Let’s start with the positives.
Potential advantages of renting a vacation home2
Little Responsibility: If you choose to rent a vacation home, your only responsibility is to leave the house the same way you found it. None of the property maintenance or utilities fall onto a short-term renter to take care of, which means you can enjoy your holiday and then dump your garbage on the way out, turn out the lights, and lock the door behind you.
Variety of Options: Renting vacation homes means renting a different home anywhere you go. You won’t be limited to revisiting the same place over and over. Instead, you can change locations each time you go on vacation and experiment with the type of property to see what you enjoy best – in town or out, kid-friendly or over 55, nightlife or peace and quiet, etc.
Cost Considerations: Renting a vacation home can be a more affordable way to go on various vacations in many areas. After all, you will not pay a mortgage, maintenance fees, or other charges.
Disadvantages of Renting a Vacation Home
Anyone who has rented a vacation home knows that there are some downsides. Here are a few of them:
Cost: In 2024, the expected average daily rate for U.S. vacation rentals is $326.9 This number will fluctuate based on the type of home you rent. A luxury rental could be significantly higher.
Not Your Space: When renting a vacation property, you live in someone else’s home. For many people, it’s never as comfortable as staying in a place you own. You may find problems with the house, it may not have all the features you are accustomed to, and you may need a learning curve to figure out how to use everything from the TV to the thermostat.2
Availability: You may need to book your vacation homes well in advance during peak seasons. Chances are you want to go away at the same time of year, but others have the same idea. Availability can be problematic if you book too late or the area is extremely popular.2
Inconvenient: Renting a vacation home can be a hassle. You have to choose the home, make sure it’s available when you want, and then go through the booking process with the owner, the property manager, or a third-party website. If anything accidentally breaks during your stay, you’ll also be liable to cover it. There can also be unexpected fees that drive up the price.2
Make Your Decision Carefully
I’m sure you’ve gone on vacation to a terrific location and fallen in love with it. The experience might have been so wonderful that you thought about buying a home to spend more time there. That’s how the time-share industry became so popular in the 1970s and 80s—catering to impulse buyers.
However, it’s important to remember that while you might be swayed by the most enjoyable aspects of your vacation, you should consider the negative factors that owning a second home can bring. Between costs, extra work of taking care of another property, and the impact on your other travel habits, owning a vacation home can have drawbacks. You also may want to factor in how being away could impact your relationships back home.
Before you commit to buying a vacation property, you might want to consider living there for a month or two first. Spending an extended amount of time in a rental property at your intended vacation home location may provide you with a more realistic view of the area.
There is no right or wrong answer on whether to buy or rent a vacation home. Please take the time to weigh the pros and cons thoroughly before deciding. Please do not hesitate to contact us if we can help or just be an impartial sounding board.
Veronica Cabral
Wealth Advisor, Warren Street Wealth Advisors
Investment Advisor Representative, Warren Street Wealth Advisors, LLC., a Registered Investment Advisor
The information presented here represents opinions and is not meant as personal or actionable advice to any individual, corporation, or other entity. Any investments discussed carry unique risks and should be carefully considered and reviewed by you and your financial professional. Nothing in this document is a solicitation to buy or sell any securities, or an attempt to furnish personal investment advice. Warren Street Wealth Advisors may own securities referenced in this document. Due to the static nature of content, securities held may change over time and current trades may be contrary to outdated publications. Form ADV available upon request 714-876-6200.
https://warrenstreetwealth.com/wp-content/uploads/2025/09/Buy-vs-Rent.png10801080Veronica Cabral, CFP®https://warrenstreetwealth.com/wp-content/uploads/2014/11/Warren_Street_logo-01.svgVeronica Cabral, CFP®2025-09-04 10:39:142025-09-04 10:39:19Is It Smarter to Buy or Rent a Second Home?
There are a lot of things in life where the right move is pretty intuitive. Avoid the top rung of a ladder when you’re changing a lightbulb. Don’t click on that suspicious link in your email inbox.
But when it comes to your money, making smart decisions isn’t always so easy. In fact, there are a lot of times in investing where the intuitive move isn’t the best. A stand-out example is risk: For the most part, our brains and bodies tell us to avoid it. While it may seem smart to dial down risk in your investment portfolio, taking a too-conservative approach might leave you far short of your long-term goals. Making sound financial decisions often involves embracing counterintuitive strategies. Let’s explore a few more.
Less Action Often Leads to Better Results
Scenario: All too frequently, news headlines scream about stocks soaring or plummeting. When alarm bells like these ring, your impulse may be to take action. Zoom out and you’ll realize that a doom-and-gloom news cycle is practically a given. Buying and selling investments based on it is not a good idea.
Counterintuitive advice: The urge to act on market movements can be hard to resist. However, investing is a long-term endeavor, and often the best move is to do nothing at all.
Consider the story of the Voya Corporate Leaders Trust highlighted by Jason Zweig of The Wall Street Journala few years back. Established in 1935, this fund was designed to counteract the speculative excesses that contributed to the 1929 market crash. Its approach was radical: The fund purchased equal shares of 30 stocks and committed to holding them indefinitely. No new stocks could be added, and existing ones could only be sold under extraordinary circumstances, such as bankruptcy or mergers.
Despite being on “permanent autopilot” for nearly a century, the Voya fund has outperformed many actively managed funds—and even the S&P 500 at times. Patience and a hands-off approach can pay off over time.
Your Portfolio Shouldn’t Match the S&P 500
Scenario: When the S&P 500 has had a bang-up year, as it did in 2024—and 2023—you may be tempted to wonder why your portfolio didn’t keep up. In fact, it might lead to what’s known as “tracking error regret,” which occurs when investors second-guess their diversified approach because their returns don’t match a popular benchmark.
Counterintuitive advice: Your portfolio is not built to match the S&P 500, which represents just one slice of the market—the 500 largest U.S. companies.
Instead, it’s designed for reasons that are unique to you, whether it’s funding retirement, paying for kids’ college education or leaving your wealth for the next generation. A well-diversified portfolio is a powerful tool to help you meet those goals. Consider the classic 60/40 portfolio, which allocates 60% to equities and 40% to bonds. While it’s not likely to outperform an all-equity portfolio over the long run, it is structured to provide a buffer during periods of market turmoil.
Remember, it’s not the S&P 500’s performance that matters. What really matters is sticking with the right plan that will help you meet your financial goals.
Embrace the Bear
Scenario: When bear markets happen, it certainly doesn’t feel good. In fact, it may feel like you’re watching your wealth evaporate before your eyes. The impulse might be to cut your losses and sell. But bear markets have a tendency to change course. (In fact, they historically always have.)
Counterintuitive advice: Market downturns provide an opportunity to rebalance your portfolio. Bear markets can be prime buying opportunities. When prices are low, you are essentially given the chance to buy shares of a company or a fund when they’re on sale. You may consider trimming positions in asset classes that have grown and buying more shares in those whose valuations have dropped.
Rebalancing in this way helps you stick closer to the asset allocation strategy that’s at the center of your financial plan.
Putting It All Together
Whether it’s sticking to a diversified portfolio, viewing market downturns as opportunities or making smart spending decisions, counterintuitive strategies can help you stay on track toward your financial goals.
As you reflect on your investments this year, remember that your portfolio is unique to you. It’s designed to meet your specific needs and long-term objectives. And sometimes, the best move is simply to trust your plan and let time do the heavy lifting. We’re here to field any questions you may have along the way.
Phillip Law, CFA
Senior Portfolio Manager, Warren Street Wealth Advisors
Investment Advisor Representative, Warren Street Wealth Advisors, LLC., a Registered Investment Advisor
The information presented here represents opinions and is not meant as personal or actionable advice to any individual, corporation, or other entity. Any investments discussed carry unique risks and should be carefully considered and reviewed by you and your financial professional. Nothing in this document is a solicitation to buy or sell any securities, or an attempt to furnish personal investment advice. Warren Street Wealth Advisors may own securities referenced in this document. Due to the static nature of content, securities held may change over time and current trades may be contrary to outdated publications. Form ADV available upon request 714-876-6200.
https://warrenstreetwealth.com/wp-content/uploads/2025/07/Counterintuitive-Money-Advice.png10801080Phillip Law, CFAhttps://warrenstreetwealth.com/wp-content/uploads/2014/11/Warren_Street_logo-01.svgPhillip Law, CFA2025-07-24 09:03:022025-07-24 09:03:07Counterintuitive Money Advice: Investing Against the Grain
The “One Big Beautiful Bill Act” (OBBBA), signed July 4, 2025, is poised to significantly impact nearly every aspect of your financial life. From your tax bill to your healthcare and your children’s future savings, understanding the nuances of this bill is crucial for effective financial planning.
Here’s a breakdown of what the OBBB means for you:
Tax Planning: More in Your Pocket, But Mind the Details
The OBBB makes permanent many of the individual income tax rates and brackets from the 2017 Tax Cuts and Jobs Act (TCJA), providing long-term clarity. But there’s more:
Expanded Standard Deduction: The standard deduction sees a permanent expansion, making tax filing simpler for many and potentially reducing the need to itemize.
Temporary Deductions (2025-2028): Get ready for some new, but temporary, tax breaks.
No Tax on Tips/Overtime: If you earn qualified tip income (up to $25,000) or overtime premium pay (up to $12,500 for individuals, $25,000 for joint filers), you may be able to deduct it. Keep an eye on income phase-outs.
Senior Tax Deduction: Individuals 65 and older meeting income thresholds ($75,000 single, $150,000 joint) can claim an additional $6,000 deduction, aiming to offset federal taxes on Social Security.
Auto Loan Interest Deduction: A temporary deduction of up to $10,000 for interest on loans for U.S.-assembled vehicles is available, subject to income phase-outs.
Increased SALT Deduction Cap: For five years, the State and Local Tax (SALT) deduction cap temporarily increases to $40,000 (from $10,000), with income-based phase-outs. This is a win for residents of high-tax states.
Enhanced Child Tax Credit: The Child Tax Credit permanently increases to $2,200 per child and will be indexed for inflation.
Business Tax Incentives: Businesses will see the reinstatement of 100% bonus depreciation and permanent Section 199A (Qualified Business Income) deduction, encouraging investment.
Estate and Gift Tax Relief: The unified credit and Generation-Skipping Transfer Tax (GSTT) exemption thresholds are permanently increased to $15 million per individual, offering substantial relief for high-net-worth individuals.
Your Action Plan: Review your current tax strategies with a financial advisor to maximize these new permanent and temporary provisions. Consider whether itemizing still makes sense for you.
Healthcare & Social Programs: A Shifting Landscape
The OBBB includes significant cuts to federal funding for vital social programs:
Medicaid Changes: Expect cuts to Medicaid funding and new work requirements for many adult beneficiaries. If you or your loved ones rely on Medicaid, be aware of potential reduced coverage or new eligibility hurdles.
SNAP (Food Assistance) Adjustments: The Supplemental Nutrition Assistance Program (SNAP) also faces federal funding cuts and expanded work requirements.
Affordable Care Act (ACA) Implications: New eligibility verification requirements are imposed for ACA marketplace coverage, and enhanced tax credits for ACA coverage are set to expire. This could lead to higher out-of-pocket premium payments for many, particularly older adults. The CBO estimates these changes could lead to a significant increase in the uninsured population.
Your Action Plan: Reassess your healthcare and benefits planning. Explore alternative options if you’re impacted by changes to Medicaid or ACA, and adjust your budget accordingly.
Retirement & Savings: New Avenues and Program Shifts
The bill introduces both opportunities and challenges for your long-term financial goals:
“Trump Accounts” for Children: A brand-new savings option for newborns. These “Trump Accounts” receive an initial federal contribution of $1,000, with parents able to contribute up to $5,000 annually. Classified as IRAs, gains are tax-deferred until age 18. This is a new consideration for long-term savings for your children.
Student Loan Program Overhaul: Federal student loan programs are undergoing significant alterations, potentially ending subsidized and income-driven repayment options. Limits are also placed on Pell Grant eligibility. Current and future students will need to adjust their education financial planning.
HSA and 529 Expansion: Good news for healthcare and education savings. Eligible uses for Health Savings Accounts (HSAs) and 529 education savings plans are expanded, offering more flexibility.
Social Security Outlook: While the bill provides some temporary tax relief for seniors, its overall impact on the national debt could accelerate the insolvency of Social Security. This is a long-term consideration for retirement planning.
Your Action Plan: Evaluate “Trump Accounts” alongside existing savings vehicles like 529 plans. If you have student loans or are planning for higher education, understand the new repayment and eligibility rules. Review how you leverage your HSA and 529 plans for maximum benefit.
Investment & Business Considerations: Adapting to Policy Shifts
The OBBB also brings changes that could influence your investment portfolio:
Clean Energy Tax Credits: Many clean energy tax credits from the Inflation Reduction Act are being phased out, which may impact investments in renewable energy and electric vehicles.
Fossil Fuel Promotion: The bill promotes increased domestic oil and gas production, which could influence investment strategies in the energy sector.
Your Action Plan: Consider how these policy shifts might affect your investment portfolio. Diversification and a long-term perspective remain key.
Overall Financial Planning Implications: A Holistic Approach
The “Big Beautiful Bill” is a game-changer. It necessitates a comprehensive review of your financial strategy.
Review Tax Strategies: Don’t miss out on new deductions!
Reassess Healthcare and Benefits Planning: Understand potential impacts on coverage and eligibility.
Evaluate Savings Options: Explore new opportunities like “Trump Accounts” and expanded HSA/529 uses.
Update Estate Plans: High-net-worth individuals should revisit their estate plans due to increased exemptions.
Adjust Investment Portfolios: Align your investments with the new economic realities. If you’re a client of ours, we’ve already done this for you.
The “One Big Beautiful Bill” is far-reaching. Given its complexity, consulting with a qualified financial advisor and tax professional is highly recommended to understand how these provisions specifically impact your unique financial situation and to adjust your plans accordingly. Schedule time with a Warren Street advisor today. .
Justin D. Rucci, CFP®
Wealth Advisor, Warren Street Wealth Advisors
Investment Advisor Representative, Warren Street Wealth Advisors, LLC., a Registered Investment Advisor
The information presented here represents opinions and is not meant as personal or actionable advice to any individual, corporation, or other entity. Any investments discussed carry unique risks and should be carefully considered and reviewed by you and your financial professional. Nothing in this document is a solicitation to buy or sell any securities, or an attempt to furnish personal investment advice. Warren Street Wealth Advisors may own securities referenced in this document. Due to the static nature of content, securities held may change over time and current trades may be contrary to outdated publications. Form ADV available upon request 714-876-6200.
https://warrenstreetwealth.com/wp-content/uploads/2025/07/Big-Beautiful-Bill.png10801080Justin D. Rucci, CFP®https://warrenstreetwealth.com/wp-content/uploads/2014/11/Warren_Street_logo-01.svgJustin D. Rucci, CFP®2025-07-10 12:14:072025-07-10 12:15:13The “Big Beautiful Bill”: What It Means for Your Finances
As we approach the end of 2024, it’s an opportune time to reflect on the year’s financial developments and consider what 2025 may bring. We believe in understanding both the past and potential future of our economic landscape, which may help inform financial decisions.
This year has brought its share of financial developments, from market fluctuations to policy changes that have shaped the economic environment. Shifts in various sectors, interest rate movements, and global events have influenced financial strategies across the board.
Looking ahead to 2025, we anticipate new opportunities and challenges in the financial world. Our team watches current trends and indicators to provide some insights for the coming year.
In this review, we’ll examine the key financial events of 2024 and their impact and potential implications. We’ll then turn our attention to 2025, offering our perspective on trends that may emerge in the coming months.
Whether you’re a long-standing client or simply interested in staying informed, we believe this overview may provide some insights for your financial strategies as we move into the new year.
Key Economic Factors in 2024
Interest Rates
During the September meeting, the Federal Reserve voted to lower interest rates by 0.5 percent, the first reduction in rates since 2020. While the pivot was long-anticipated, the size of the cut surprised many pundits following the Fed’s all-out fight against inflation launched two years ago. The move, unusual in an election year, brought the benchmark federal funds rate to a range between 4.75% and 5%. Some anticipate the Fed may adjust interest rates again in 2024.1
Inflation
The decision to trim interest rates moved the central bank into a new phase, and preventing further weakening of the U.S. labor market is now an important priority. For most of the past 2½ years, the Fed focused on fighting inflation. With the Consumer Price Index receding from 6.4% in January 2023 to 2.9% this July, the Fed pivoted attention to the softening job market. By comparison, the seasonally-adjusted unemployment rate rose to 4.2% in August, up from 3.7% in January.1
GDP Growth
Real GDP growth rose by 3.0% quarterly annualized in Q2 2024, up from 1.6% in Q1 2024. This increase was led by stronger domestic demand and a surge in inventories. The Conference Board Economic Forecast estimates a 0.8% annualized GDP growth for Q3 and 1% annualized for Q4. With the third and final Q3 GDP estimate due to be released on December 19, attention will shift to Q4 and 2025. Looking into 2025, some economists watch the Atlanta Fed’s GDPNow tool, which gives a running estimate of real GDP growth based on available economic data for the current measured quarter.2
Market Performance
Equity markets have seen strong, if uneven, performance in 2024. As of the end of October, the S&P 500 index was up 19.62% while the Dow Jones Industrial Average rose 10.81%. The tech-heavy NASDAQ increased 20.54%.3
Bonds have also shown volatility in 2024. As of October 31, the total return of the 10-Year Treasury Note was 4.28%.4
Past performance does not guarantee future results. Individuals cannot invest directly in an index. The return and principal value of financial markets will fluctuate as conditions change.
Key Takeaways
Up Markets Can Still Experience Volatility
While equity markets had strong overall performance in 2024, stocks did not go up in a straight line. There were some scary moments for investors, like April 12, when inflation and geopolitical worries saw the Dow Jones Industrial Average slide by 1.24%, the S&P 500 tumble by 1.46%, and the Nasdaq pull back by 1.62%. That bad day for the markets was dwarfed by August 5, when worries about slowing U.S. economic growth caused the Dow to fall more than 1,000 points, or 2.6%, while the broader S&P 500 lost 3% and the Nasdaq fell 3.4%.5,6
As disconcerting as these pullbacks felt at the time, stocks returned to record highs by September. An important lesson from this year is that stocks can, and often do, go down. It’s also critical to know that, on average, stocks have corrected approximately every two years, and that correction typically lasts a few months. Corrections, which are declines of between 10% and 20% from a recent high, can occur for a variety of reasons, including when unexpected news shakes investors’ confidence. Selling investments during a downturn may lock in your losses and lower your potential long-term returns.7
Don’t Fight the Fed
The past year has reinforced the influence the Federal Reserve has over the markets and investor psychology. The Fed held rates steady for much of 2024. It wasn’t until the September meeting that they made an adjustment. Markets reacted to every Fed meeting and Chairman Jerome Powell press conference. With inflation down from its highs (but not yet at the Fed’s 2% target) and employment softening, but not cratering, the Fed may have orchestrated the oft-talked-about “soft landing” for the economy. The lesson learned for next year is to pay attention to what the Fed is doing and remember the old Wall Street saying, “Don’t fight the Fed.”
Markets Shift Focus in an Instant
We all know that stocks can be volatile, but we only seem to care when they are volatile on the downside. Those 24 hours of angst between August 5 and 6, when the Dow dropped more than 1,000 points due in part to angst over the Bank of Japan boosting interest rates at a time when investors were borrowing the yen on the cheap to buy higher-risk stocks and derivatives. I doubt many of us had “Bank of Japan” on our radar, but market psychology can shift abruptly from “it’s all good” to “the sky is falling” without much justification. Focus can flip from concerns over an overheating economy to fears of a job-crushing recession on a dime. One lesson we hope you take away from 2024 is not to let emotions control your investment decisions. A solid financial strategy should be designed to withstand short-term market moves and keep you on track toward your long-term financial goals.9
Artificial Intelligence (AI) is Here to Stay
AI has been a major market story in 2023 and 2024 and shows no signs of slowing. While AI has been advancing for decades, innovations in machine learning have found exciting and extraordinary new use cases in areas from healthcare to manufacturing. One popular chatbot jump-started the current AI interest, reaching 100 million monthly active users just two months after its launch, making it the fastest-growing consumer application in history.8
AI is being seen as the most innovative technology of the 21st century and has the potential to both enhance and disrupt major industries. Innovations in electricity and personal computers unleashed investment booms of as much as 2% of U.S. GDP as the technologies were adopted into the broader economy. Now, investment in artificial intelligence is ramping up quickly and could eventually have an even bigger impact on GDP, according to Goldman Sachs Economics Research.10
The AI lesson to take away from 2024 is that AI is not just focused on a handful of companies. Company interest in AI has already increased rapidly, with more than 16% of enterprises in the Russell 3000 mentioning the technology on earnings calls, up from less than 1% in 2016.10
Asset Allocation is Essential
Asset allocation is an approach to help manage, but not eliminate, investment risk in the event that security prices decline. The strategy involves spreading your investments across a wide range of assets to spread the risk associated with concentrating too heavily on any single investment. Simply put, diversification is the “don’t keep all your eggs in one basket” approach to portfolio construction.
Asset allocation is more than choosing a single investment, like one that is based on the S&P 500 stock index. One of the more significant and concerning trends in recent years has been the rise of market-cap-weighted indexes, which has led to increased concentration in just a few dominant stocks, mostly in the technology sector. Due to their outsized market capitalizations, these stocks, dubbed “The Magnificent 7,” may make up a disproportionate part of some investor portfolios. Another lesson from 2024 is that the downside can be significant when heavily concentrated stocks pull back simultaneously.11
Emergency Preparedness is Always Critical
The year 2024 has shown us that unexpected economic downturns or crises can impact investors without warning. You should consider having an emergency fund to cover living expenses so you aren’t forced to make short-term decisions that could impact your long-term goals. You should also work with a financial professional to discuss risk management strategies that can keep you moving toward your goals.
Prepare for What You Can, Don’t Overreact to What You Can’t
With the presidential election now behind us, potential tax and regulation policy transitions remain. Politically speaking, implementing policy goals and regulations is more challenging than making pledges. Be ready to shift strategies for you, your loved ones, and your heirs if necessary. In other areas, there may be little you can do other than to try not to overreact to what comes down from Washington. Working with financial, tax, and estate professionals can help you navigate what may happen in 2025 and beyond.
Applying Lessons and Looking Forward to 2025
As we reflect on the financial landscape of 2024, it’s clear that the market continues to evolve in response to global events, technological advancements, and economic policies. The lessons from this past year underscore the importance of maintaining a balanced, long-term perspective with your personal finances.
To summarize the key takeaways from 2024:
Market volatility remains a constant, emphasizing the need for diversified portfolios.
The Federal Reserve’s decisions continue to impact market dynamics.
Emerging technologies, particularly AI, are reshaping industries and potentially creating new investment opportunities.
Global events can rapidly shift market focus, reinforcing the value of a well-structured financial strategy.
Looking ahead to 2025, we anticipate continued evolution in the financial sector and are committed to staying on top of these changes and providing you with timely insights and guidance. Our team is dedicated to helping you navigate the complexities of the financial world and working towards your long-term goals.
We will continue to monitor key economic indicators, policy changes, and market trends, sharing our analysis through our regular blog posts and communications. Our aim is to provide you with the information and support you need to make informed financial decisions in the coming year and beyond.
Remember, personal finance is a collaborative effort. While we provide the insights, your personal goals and circumstances are at the heart of every strategy we develop. We encourage you to reach out to us with any questions or concerns as we move into 2025.
Thank you for your continued trust in our team. We look forward to guiding you through another year of financial opportunities and challenges.
Bryan Cassick, MBA, CFP®
Wealth Advisor, Warren Street Wealth Advisors
Investment Advisor Representative, Warren Street Wealth Advisors, LLC., a Registered Investment Advisor
The information presented here represents opinions and is not meant as personal or actionable advice to any individual, corporation, or other entity. Any investments discussed carry unique risks and should be carefully considered and reviewed by you and your financial professional. Nothing in this document is a solicitation to buy or sell any securities, or an attempt to furnish personal investment advice. Warren Street Wealth Advisors may own securities referenced in this document. Due to the static nature of content, securities held may change over time and current trades may be contrary to outdated publications. Form ADV available upon request 714-876-6200.
3. Yahoo.com, October 31, 2024. The S&P 500 Composite Index is an unmanaged group of securities considered to be representative of the stock market in general. Past performance does not guarantee future results. Individuals cannot invest directly in an index. The return and principal value of stock prices will fluctuate as market conditions change. And shares, when sold, may be worth more or less than their original cost.
4. Yahoo.com, October 31, 2024. U.S. Treasury Notes are guaranteed by the federal government as to the timely payment of principal and interest. However, if you sell a Treasury Note prior to maturity, it may be worth more or less than the original price paid.
A small slice of equity compensation can boost your income, while a larger slice might bring a significant financial windfall. However, luck and careful management play crucial roles. Balancing the risks and rewards of your equity compensation is essential. Understanding how it fits into your overall financial plan can help you maximize benefits and avoid concentration risk—the danger of having too much wealth in one stock.
Equity Compensation Basics
Equity compensation comes in various forms, such as stock options, restricted stock units, or employee stock purchase plans. The equity package you receive might come with a vesting schedule, which determines how quickly you’re able to take ownership of your shares. For companies, these vesting schedules accomplish an important goal: They help keep you around longer.
Understanding every part of your equity compensation package is essential. This includes vesting rules, types of shares, expiration dates for exercising stock options, and tax implications. Missing an expiration date can mean losing the chance to buy company stock at a discount, and knowing the tax details can help you manage your tax burden and retain more of your hard-earned equity. While you don’t need to master every detail, it’s crucial to understand your equity compensation offer.
At Warren Street, we guide clients through the wealth-building potential of their executive compensation packages. We help you maximize opportunities, integrate the package with your broader financial goals, and collaborate with other resources. For example, your company’s HR department or benefits administrator can provide details, your accountant can advise on taxes, and a lawyer can help with legal aspects and estate planning related to your equity compensation.
Understanding the Risks of Equity Compensation
One downside of equity compensation is that it can tie up a large portion of your wealth in a single stock. This is known as concentration risk.
Not all risk is bad. In fact, a foundational part of investing is taking on risk in exchange for potentially higher returns. This is systemic risk—the risk inherent in the financial markets at large. However, concentration risk means your wealth is closely tied to one company’s performance, posing significant danger if the company faces issues like scandals or competitive disruptions.
Relying on your employer for income and savings can be risky. If the company performs poorly, you could lose both your job and a significant part of your wealth. For example, during the 2020 pandemic, ridesharing company stock prices tended to lose value as ridership plummeted. These companies laid off thousands of workers, and employees lost both jobs and equity value.
“But” you may counter, “I know my own company, and I’m confident its future is bright.” This is a common reaction—and may be a sign you’re falling into a common behavioral tendency known as familiarity bias. It can lead you to the false assumption that your own company is safer, and your familiarity may actually be keeping you from making a level-headed investment decision. Instead, lean on objective data and research rather than feelings to inform your investment decisions.
Solving Concentration Risk
Minimize concentration risk by diversifying, carefully divesting company shares, and investing in broad market funds. This approach smooths out volatility, maximizes long-term returns, and manages systemic risks.
If you work for a privately held company, selling your shares can be more tricky—and perhaps not possible. In that case, we can help you explore options to reduce risk. For example, that may mean building a larger emergency fund to give you more protection from the unexpected or exploring financial strategies to hedge your equity position.
No matter your equity compensation package, you don’t have to navigate its complexities alone. Contact us to discuss your options and maximize your financial potential.
Bryan Cassick, MBA, CFP®
Wealth Advisor, Warren Street Wealth Advisors
Investment Advisor Representative, Warren Street Wealth Advisors, LLC., a Registered Investment Advisor
The information presented here represents opinions and is not meant as personal or actionable advice to any individual, corporation, or other entity. Any investments discussed carry unique risks and should be carefully considered and reviewed by you and your financial professional. Nothing in this document is a solicitation to buy or sell any securities, or an attempt to furnish personal investment advice. Warren Street Wealth Advisors may own securities referenced in this document. Due to the static nature of content, securities held may change over time and current trades may be contrary to outdated publications. Form ADV available upon request 714-876-6200.
https://warrenstreetwealth.com/wp-content/uploads/2024/08/Equity-Compensation-Opportunities-Risks.png10801080Bryan Cassick, MBA, CFP®https://warrenstreetwealth.com/wp-content/uploads/2014/11/Warren_Street_logo-01.svgBryan Cassick, MBA, CFP®2024-09-05 08:07:002024-11-07 09:16:54Equity Compensation: Benefits and Risks You Need to Know
So much of investing is beyond our control (picking stock prices, timing market movements, and so on) that it’s nice to know there are several “power tools” that can potentially enhance overall returns. Tax-loss harvesting is one such instrument, but — like many tools — it’s best used skillfully, and only when it is the right tool for the task.
The (Ideal) Logistics
When properly applied, tax-loss harvesting is the equivalent of turning your financial lemons into lemonade by converting market downturns into tangible tax savings. A successful tax-loss harvest lowers your tax bill, without substantially altering or impacting your long-term investment outcomes.
Tax Savings
If you sell all or part of a position in your taxable account when it is worth less than you paid for it, this generates a realized capital loss. You can use that loss to offset capital gains and other income in the year you realize it, or you can carry it forward into future years. We can realize losses on a holding’s original shares, its reinvested dividends, or both. (There are quite a few more caveats on how to report losses, gains, and other income. A tax professional should be consulted, but that’s the general premise.)
Your Greater Goals
When harvesting a loss, it’s imperative that we remain true to your existing investment plan. To prevent a tax-loss harvest from knocking your carefully structured portfolio out of balance, we reinvest the proceeds of any tax-loss harvest sale into a similar position (but not one that is “substantially identical,” as defined by the IRS). Typically, we then return the proceeds to your original position no sooner than 31 days later (after the IRS’s “wash sale rule” period has passed).
The Tax-Loss Harvest Round Trip
In short, once the dust has settled, our goal is to have generated a substantive capital loss to report on your tax returns, without dramatically altering your market positions during or after the event. Here’s a three-step summary of the round trip typically involved:
Sell all or part of a position in your portfolio when it is worth less than you paid for it.
Reinvest the proceeds in a similar (not “substantially identical”) position.
Return the proceeds to the original position no sooner than 31 days later.
Practical Caveats
An effective tax-loss harvest can contribute to your net worth by lowering your tax bills. That’s why we keep a year-round eye on potential harvesting opportunities, so we are ready to spring into action whenever market conditions and your best interests warrant it.
That said, there are several reasons that not every loss can or should be harvested. Here are a few of the most common caveats to bear in mind.
Trading costs – You shouldn’t execute a tax-loss harvest unless it is expected to generate more than enough tax savings to offset the trading costs involved. As described above, a typical tax-loss harvest calls for four trades: There’s one trade to sell the original holding and another to stay invested in the market during the waiting period dictated by the IRS’s wash sale rule. After that, there are two more trades to sell the interim holding and buy back the original position.
Market volatility – When the time comes to sell the interim holding and repurchase your original position, you ideally want to sell it for no more than it cost, lest it generate a short-term taxable gain that can negate the benefits of the harvest. We may avoid initiating a tax-loss harvest in highly volatile markets, especially if your overall investment plans might be harmed if we are unable to cost-effectively repurchase your original position when advisable.
Tax planning – While a successful tax-loss harvest shouldn’t have any impact on your long-term investment strategy, it can lower the basis of your holdings once it’s completed, which can generate higher capital gains taxes for you later on. As such, we want to carefully manage any tax-loss harvesting opportunities in concert with your larger tax-planning needs.
Asset location – Holdings in your tax-sheltered accounts (such as your IRA) don’t generate taxable gains or realized losses when sold, so we can only harvest losses from assets held in your taxable accounts.
Adding Value with Tax-Loss Harvesting
It’s never fun to endure market downturns, but they are an inherent part of nearly every investor’s journey toward accumulating new wealth. When they occur, we can sometimes soften the sting by leveraging losses to your advantage. Determining when and how to seize a tax-loss harvesting opportunity, while avoiding the obstacles involved, is one more way we seek to add value to your end returns and to your advisory relationship with us. Let us know if we can ever answer any questions about this or other tax-planning strategies you may have in mind.
Bryan Cassick, MBA, CFP®
Wealth Advisor, Warren Street Wealth Advisors
Investment Advisor Representative, Warren Street Wealth Advisors, LLC., a Registered Investment Advisor
The information presented here represents opinions and is not meant as personal or actionable advice to any individual, corporation, or other entity. Any investments discussed carry unique risks and should be carefully considered and reviewed by you and your financial professional. Nothing in this document is a solicitation to buy or sell any securities, or an attempt to furnish personal investment advice. Warren Street Wealth Advisors may own securities referenced in this document. Due to the static nature of content, securities held may change over time and current trades may be contrary to outdated publications. Form ADV available upon request 714-876-6200.
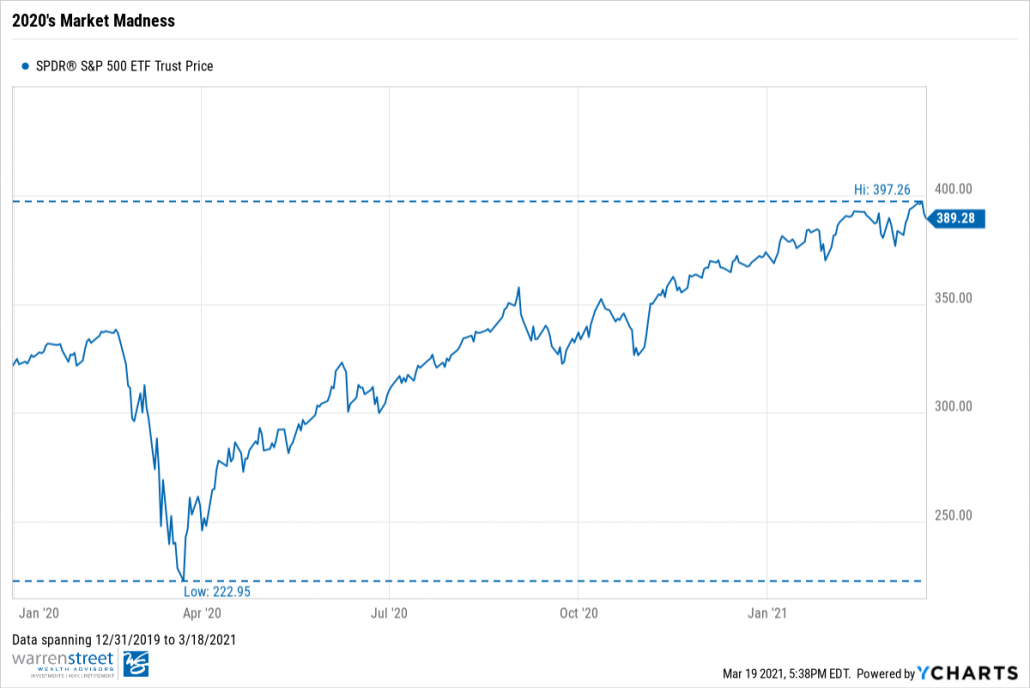
During this time last year, the NCAA canceled March Madness. With college basketball off the table, we were given a different type of madness: Market Madness. The S&P 500 drew down a total of 34% from peak to trough as COVID-19 wreaked havoc across global markets. This week marked the one year anniversary of that drawdown’s market bottom.
In September 2020, we wrote about the astounding fiscal and monetary policy action delivered by both the Federal Reserve and congressional lawmakers in response to the coronavirus. Although we complimented both the central bank and congress, the 2020 Most Valuable Player award quite honestly belongs to Jerome Powell and the Fed.
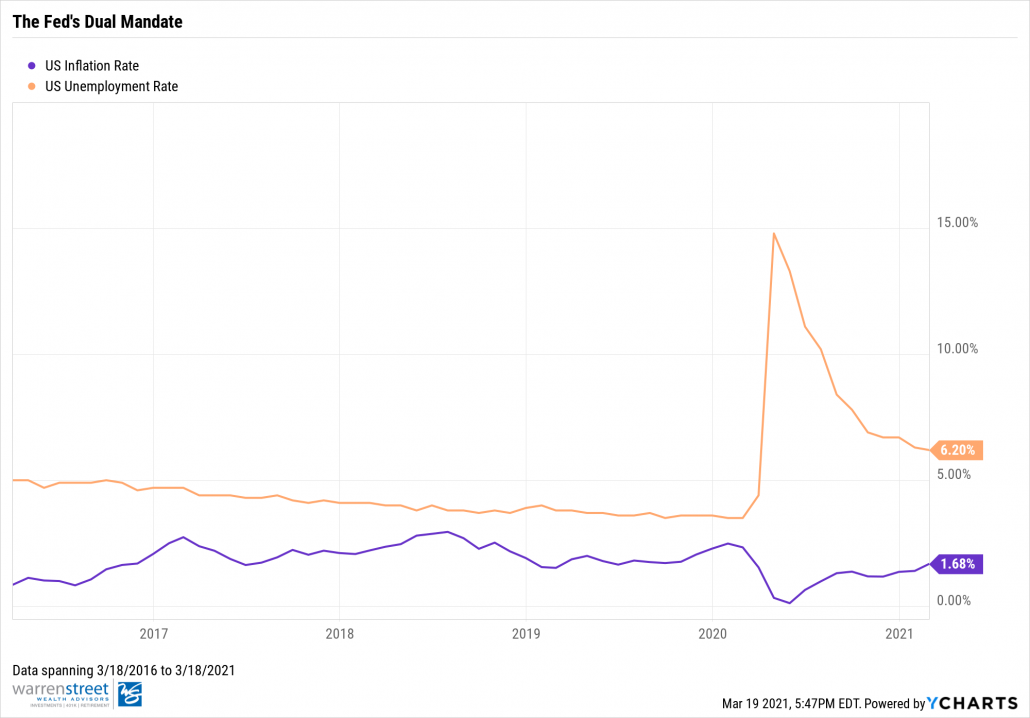
Today, after fending off last March’s Market Madness, the ball is no longer in the Fed’s court. Instead, The Fed is embodying a more reactive approach, awaiting signs of inflation to cross their 2% target before considering rate hikes or tools such as yield-curve control. Now, it’s our congressional leaders’ turn to play offense using fiscal policy. Their most recent time-out play is the $1.9 trillion stimulus package with embedded $1,400 stimulus payments expected to boost inflation.
Is Inflation Bad?
Let’s take a step back and consider why the Fed is setting a target with inflation. It’s important to distinguish that inflation isn’t as daunting as what’s ingrained in our history books. Sure, the inflationary tales of Zimbabwe and the Weimar Republic might seem scary, but the truth is such situations are rare and due to mismanaged policy in less-developed nations. Typically, mild inflation is a sign of rising consumption and increased demand. Today, this type of inflation can be recognized as reflation1; and in our case, reflation would signify that a return to normalcy is en route.
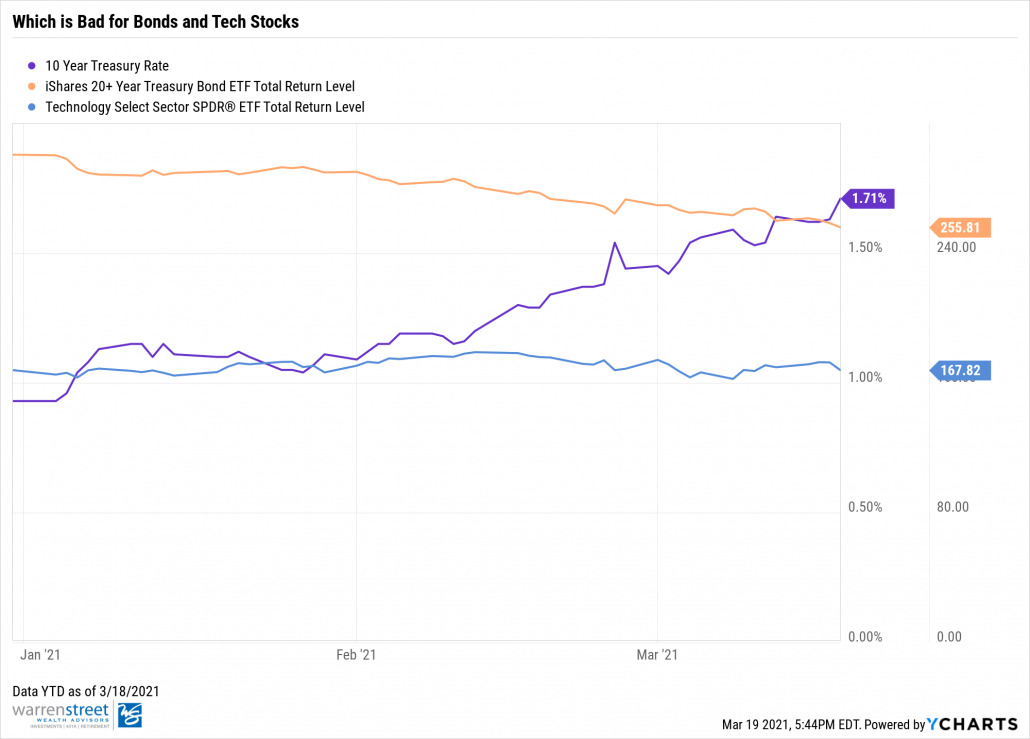
Market expectations for inflation are no laughing matter. A re-opening is expected to usher in increased spending in the form of pent-up demand. Input prices such as lumber and copper are already soaring. The five year breakeven treasury rate, which measures investor expectations for inflation, rose to its highest over point ever since 2014. Bonds, whose kryptonite is inflation, witnessed a sell-off that trickled into tech stocks.
But are markets correct to expect this much inflation? Or are markets overshooting their expectations by falling for this inflation pump fake? Perhaps our stay-at-home habits will prevail in the long-run and spending will not stay elevated, resulting in lower inflationary pressures. If so, we could see a rebound in bond prices and tech names. Nevertheless, this is the hotly debated topic among investors at the moment.
Run The Play
This brings us back to the analogy with our administration’s most recent time-out-play. The $1.9 trillion relief bill is bringing hope to the workers, businesses, institutions, and communities that have struggled throughout this pandemic. As you can see in the chart below, the $1,400 stimulus payments represent a large percent of the package totalling $422 billion. It makes sense for investors to expect increased inflation as consumers now have higher disposable incomes and propensity to consume – but there is a catch.
Source: Committee For a Responsible Federal Budget (CRFB)
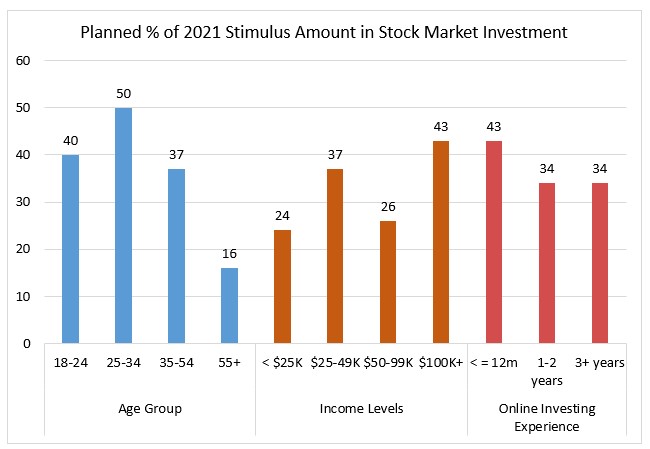
What will happen to actual inflation if these stimulus payments don’t make it back into the economy, but instead find their way into the stock market? A survey by Deutsche Bank revealed that individuals between the ages of 25 to 34 intend on placing 50% of the received payment into the stock market. Ultimately, the survey found that younger and high income earners eyed the stock market as the targeted destination for this income.
Source: Deutsche Bank Asset Allocation, dgDIG, RealVisionFinance Data presented on 3/08/2021
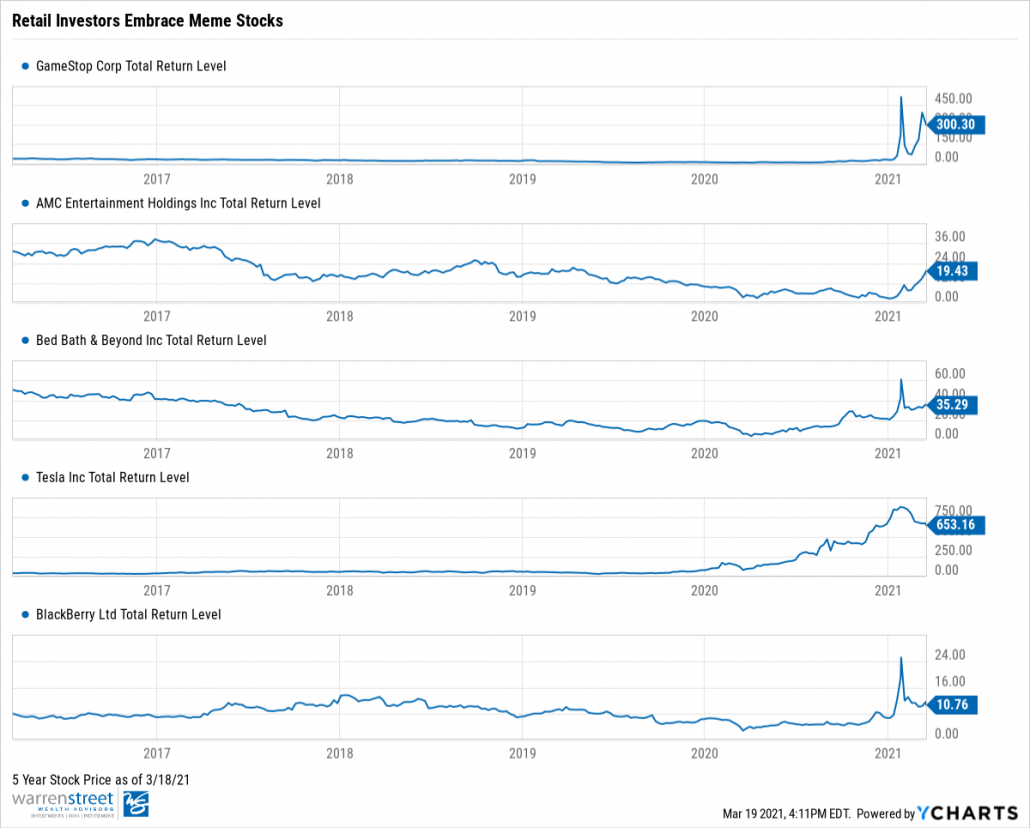
The Deutsche Bank survey, like any other, is going to be scrutinized for sampling error, but we don’t see something like the above being too far-fetched. The recent retail frenzy with “meme stocks2” like GameStop, Blackberry, and AMC has given rise to retail investing. Popular communities like r/WallStreetBets on Reddit have become a breeding ground for investors to commingle. Even more likely are your neighbors, who watched people get rich on the market’s 2020 rally, itching to pummel some of their stimulus money into the S&P 500.
These $1,400 payments are intended to increase demand for goods and prompt businesses to hire more workers, eventually raising wages. If these payments seek risk-assets instead, we could see a halt in the reflation narrative and a prolonged unemployment recovery.
Another risk to consider is the risk of financial stability. We’re seeing speculative behavior, especially from retail investors piling into stocks with less regard for the underlying fundamentals. At the end of the day, it’s quite possible to see a lack of wage growth in the economy while management teams of inefficient and highly-indebted companies get rewarded for little to no profitability.
The Bottom Line
We aren’t here to debate whether or not you should save or spend the money, let’s leave that to Reddit and Twitter. However, should a substantial portion of stimulus payments see capital markets as a more attractive destination than the underlying economy, the risks to reflation and financial stability must not be overlooked.
We’ll see whether or not the $1.9 trillion time-out play will win the economic recovery game and prevent further Market Madness… if not, let’s hope it at least takes us into overtime.
Footnotes:
Reflation represents increased price levels as a result of monetary or fiscal policy as a means to combat deflation.
“Meme stocks” are stocks that have gained traction from retail audiences such as Reddit or investment communities. GameStop and AMC are just a few of the many names with this retail comradery, earning these stocks the nickname “meme stocks” and causing a surge in prices throughout early 2021.
Investment Advisor Representative, Warren Street Wealth Advisors, LLC., a Registered Investment Advisor
The information presented here represents opinions and is not meant as personal or actionable advice to any individual, corporation, or other entity. Any investments discussed carry unique risks and should be carefully considered and reviewed by you and your financial professional. Nothing in this document is a solicitation to buy or sell any securities, or an attempt to furnish personal investment advice. Warren Street Wealth Advisors may own securities referenced in this document. Due to the static nature of content, securities held may change over time and current trades may be contrary to outdated publications. Form ADV available upon request 714-876-6200.