2019: A Year for the Record Books

Key Takeaways

2019 turned out to be one of the best years for the financial markets in recent history. To understand how we got there, it’s helpful to consider where we began. Factset did a very good job of this on its website insight.factset.com: “As we began 2019, the big economic stories were the Fed’s series of interest rate hikes (four in 2018), the ongoing U.S. government shutdown, the December 2018 stock market drop (S&P 500: -9.2%, DJIA: -8.7%), and the escalating U.S.-China trade war. As the year progressed, we saw movement on all fronts.” The bullet points below provide a useful summary:

  • The Fed’s 2018 interest rate hikes were partially reversed as the FOMC cut rates three times in the second half of the year in reaction to a growing number of signals flashing recession.
  • The 35-day U.S. government shutdown, which ended on January 25, 2019, was the longest U.S. government shutdown in history. With many federal agencies closed and federal employees across the country furloughed or working without pay, the Congressional Budget Office estimates that the shutdown cost the economy $11 billion, $3 billion of which was permanently lost.
  • The ups and downs of U.S.-China trade negotiations sent global stock markets on a roller coaster ride throughout the year. As the year comes to a close, the U.S. has reached a so-called “Phase 1” trade agreement with China that reduces some of the tariffs imposed over the last 18 months and stops the imposition of a new set of tariffs set to go into effect on December 15. For its part, China has agreed to purchase more U.S. agricultural products. While the agreement helps to diffuse global anxiety surrounding the growing trade tensions, it fails to address significant concerns around technology and intellectual property rights. Still, equity markets have responded positively to the news, surging to new highs.

With this context in mind, how did the markets do in 2019?

Risk assets powered forward in December. After a rocky ride of positive and negative returns during the year, emerging markets stocks charged to the front of the pack in December. EM Equity crossed the finish line in the middle of the field with a return of 18.4%, about half the return of the winning asset class, U.S. Growth stocks (36.4%). U.S. Large Cap was 2nd at 31.5%, U.S. Value stocks came in 3rd at 26.5%, and International stocks were 4th at 24.63%. Though bonds trailed the field at 8.7%, this is more than twice the 10-year average for the Barclay’s Aggregate Bond Index, which was supercharged by falling Treasury yields as the Fed repeatedly lowered its short-term interest rate target.

The S&P500 total return for 2019 was the 18th best since 1926, 8th best since 1970, and 4th best since 1990[1]. The Barclays Aggregate bond index had its 13th best year since 1980[2].

What can we expect from the markets in 2020?

An era of the ‘haves’ and ‘have nots’. Technological innovations from industrial automation to ‘fracking’ to high speed data connections and the ‘internet of things’ has brought the world out of scarcity and into surplus. But this abundance is not felt by all – perhaps not even by most. Those with access to these technologies, either via infrastructure or financial resources, unlock a brave new world of possibilities. Those without such access are left behind. While wages generally have begun to increase, median incomes are not rising fast enough, causing the gap between economic winners and losers to widen. This situation has sparked political protests and dissatisfaction among working-class people around the world. Combined with the uncertain outcome of the presidential election in the U.S., never-ending Brexit negotiations in the U.K., and military conflicts and political posturing around the world, the global economy could stumble if government agents make a serious misstep.

Despite these risks, the IMF continues to forecast stronger global economies in 2020 and beyond. According to the latest update to the IMF World Economic Outlook[3], global growth is forecast to improve from 2.9% in 2019 to 3.3% in 2020 and 3.4% in 2021 due to easing trade tensions, strong labor markets and service sectors, and accommodative monetary policy. IMF economists also see welcome indications that the global slump in manufacturing and trade may have bottomed out.

This positive outlook is contingent on the recovery of less-developed countries currently dealing with stressed political and/or economic conditions: Argentina, Iran, Turkey, Brazil, India, and Mexico. Advanced economies such as Europe and the U.S. are likely to continue to grow less than 2% per year.

This outlook could change quickly if new trade tensions emerge or social unrest around the world intensifies. The IMF ‘vulnerabilities’ table below reports that the financial condition of sovereign nations is vulnerable to economic shocks. This vulnerability is due in part to a lack of room for fiscal or monetary agents to maneuver given high budget deficits and the very low level of government interest rates in many countries. Businesses and households in developed economies are generally solid, but households in emerging economies remain insecure.

Bottom line: Economic expansions don’t die of old age. U.S. and international economies successfully navigated a year full of social and political tensions and uncertainty, despite being in the late stage of a record-setting expansion. Low interest rates and muted inflation are enabling businesses and households to take on new ventures where they see a suitable potential reward. And unlike the expansion which preceded the financial crisis of 2008-2009, ‘asset bubbles’ and excessive risk-taking have been limited due to the many disruptions experienced during 2019 and the uncertain future outlook.

While risks to this outlook are clear and present, we are cautiously optimistic that policymakers and financial markets will continue to thread the needle between crisis and excess, and that 2020 will be a relatively peaceful and prosperous new year.

Marcia Clark, CFA, MBA

Senior Research Analyst, Warren Street Wealth Advisors

DISCLOSURES

Investment Advisor Representative, Warren Street Wealth Advisors, LLC., a Registered Investment Advisor

The information presented here represents opinions and is not meant as personal or actionable advice to any individual, corporation, or other entity. Any investments discussed carry unique risks and should be carefully considered and reviewed by you and your financial professional. Nothing in this document is a solicitation to buy or sell any securities, or an attempt to furnish personal investment advice. Warren Street Wealth Advisors may own securities referenced in this document. Due to the static nature of content, securities held may change over time and current trades may be contrary to outdated publications.

Form ADV available upon request 714-876-6200


[1] https://www.slickcharts.com/sp500/returns

[2] https://www.thebalance.com/stocks-and-bonds-calendar-year-performance-1980-2013-417028

[3] https://blogs.imf.org/2020/01/20/tentative-stabilization-sluggish-recovery/

September 2019 Market Review

With competing economic data, where should investors turn?

Oil shocks, impeachment, and Brexit – Oh My!

Key Takeaways

  • U.S. stock and bond markets closed the 3rd quarter with an impressive – though volatile – year-to-date return. The S&P 500 index ended September up nearly 19%, the best 3-quarter return since 1997, while the Barclays Aggregate Bond index posted an outstanding return near 8%.
  • Economic data remained mixed. The U.S. Consumer Confidence index fell by -9.1%, much more than expected, but unemployment fell to 3.5%, the lowest in 50 years.
  • The House of Representatives initiated an impeachment investigation of President Trump after a ‘whistleblower’ leaked information about the President asking Ukrainian officials to investigate Democratic candidate Joe Biden’s son.
  • Drone strikes on Saudi Arabian oil installations shut down 50% of Saudi oil production, about 5% of world production, briefly sending oil prices off the rails and adding to recession fears.
  • Prime Minister Boris Johnson was deemed to have acted illegally by shutting down the U.K. Parliament, putting pressure on him to come to a Brexit resolution with the European Union.
  • Conclusion: The U.S. economy remains on track for a good year. Despite the markets’ willingness to shrug off trade wars and geopolitical uncertainty, significant challenges are still out there. Investors should prepare  for renewed market turbulence as these issues resolve themselves over the coming months.

Stock and bond markets rebound from August’s slump

The 3rd quarter was quite a roller coaster ride! Gold and other ‘safe’ assets were the go-to market segments for the quarter. Gold led the way with a return of +4.26%[1], despite a slip in late September. U.S. bonds took second place, edging out U.S. stocks with a return of 2.34% versus 1.75%. International stocks were the top performers in September at +3.7%, but continued to lag the U.S. for the quarter at -0.79%. Emerging markets equities were in second place for the month at +1.91%, but are far behind for the year and quarter, losing -4.75% between July 1st and September 30th.

Market returns 7/1/2019 – 10/4/2019

https://stockcharts.com/h-perf/ui

The financial markets continued to react strongly to economic news and geopolitical events, though the magnitude of the swings began to subside. This moderation is a bit surprising given the unexpected -9% drop in Consumer Confidence and the Purchasing Manufacturers Index falling to its lowest level since June 2009. But investor fatigue is bound to set in sooner or later, and current events just seem to build on a base with which investors have become wearily familiar.

Source: https://ycharts.com/indicators/us_pmi

The economy created only 136,000 new jobs in September – certainly nothing to brag about, but good enough this late in the expansion. At the same time, the unemployment rate fell to 3.5% – the lowest in half a century – and the overall employment ratio increased to 61%, the highest since December 2008. Apparently, the U.S. job market is alive and well…at least for the time being.

Despite competing political and economic pressures, U.S. and developed international stock markets are on track for a very strong year. As of October 7, the S&P 500 was up more than 19%, gold was up over 16%, and the Europe, Australasia, and Far East index was up nearly 12%. But be wary of another 4th quarter slump like we saw in 2018! Given mixed economic data, the impeachment inquiry of President Trump, and continuing trade tensions, any of these could derail the markets – at least temporarily – between now and December 31st.

Market returns 1/1/2019 – 10/4/2019

https://stockcharts.com/h-perf/ui

One of the less-reported casualties in the U.S.-China trade war is the agricultural sector. Inflation-adjusted prices for corn, wheat, and soybeans have been declining for decades, largely due to increased productivity and reduced global population growth. Add trade tariffs and the wettest 12 months on record[3], and farmers are facing a ‘perfect storm’ of negative events. Smaller farms are going out of business, and the number of farms in the U.S. is heading below 2 million, the lowest in nearly a century.

But despite the significant challenges facing the agriculture and manufacturing sectors, the U.S. economy is holding steady. Personal income and consumer spending rose in August for the second month in a row. Retail sales were good, and housing showed signs of renewed activity.


As reported by the Wall Street Journal on September 25, U.S. home-price growth is slowing and mortgage rates are historically low at around 4%[4]. With such low interest rates, home price affordability remains within reach as indicated by the sharp drop in the Case-Shiller Home Price Index in 2019, shown on the chart above.

Forecasters expect housing to contribute slightly to GDP for the first time since 2017 as home sales and construction increased in August.

With so much going on in the world, it’s hard to know which direction to turn! For a straightforward summary of the likely impact of these competing economic factors on global growth, we refer you to the graphic below prepared by The Conference Board (publisher of the Leading Economic Indicator index.)

The Conference Board economic outlook

Bottom line: the U.S. economy is on track for solid growth in 2019, slowing somewhat thereafter. A recession is not in the forecast for the next 12 months, though demographic factors point to slower growth worldwide in the coming years.

Given the myriad challenges facing the global economy right now, negative surprises are definitely a possibility as we navigate the final quarter of 2019. Investors may just have to close their eyes, hold on tight to a prudent investment plan, and ride out the inevitable turbulence in the coming months.

Marcia Clark, CFA, MBA

Senior Research Analyst, Warren Street Wealth Advisors


DISCLOSURES

Investment Advisor Representative, Warren Street Wealth Advisors, LLC., a Registered Investment Advisor

The information presented here represents opinions and is not meant as personal or actionable advice to any individual, corporation, or other entity. Any investments discussed carry unique risks and should be carefully considered and reviewed by you and your financial professional. Nothing in this document is a solicitation to buy or sell any securities, or an attempt to furnish personal investment advice. Warren Street Wealth Advisors may own securities referenced in this document. Due to the static nature of content, securities held may change over time and current trades may be contrary to outdated publications.

Form ADV available upon request 714-876-6200

[1] Performance represented by ETFs designed to track various market segments: SPY (S&P 500), AGG (Barclay’s Aggregate Bond index), EEM (emerging markets equity), EFA (developed international equity), GLD (gold prices)

[2] Performance represented by ETFs designed to track various market segments: SPY (S&P 500), AGG (Barclay’s Aggregate Bond index), EEM (emerging markets equity), EFA (developed international equity), GLD (gold prices)

[3] https://www.wsj.com/graphics/us-farmers-miserable-year/?mod=article_inline&mod=hp_lead_pos5

[4] https://blogs.wsj.com/economics/2019/09/25/newsletter-housings-maybe-rebound-chinas-decoupling-warning-and-consumers-cloudy-crystal-ball/?guid=BL-REB-39607&dsk=y

The bulls are back! But for how long?

Key Takeaways

  • The U.S. economy just exceeded the record for the longest business cycle expansion since economists started recording expansions in the 1930s (120 months plus 1 day)
  • Global trade tensions are impacting manufacturing sectors all around the world; only the U.S. and France show continued expansion, with Germany falling the most
  • Despite these concerns, June 2019 was among the strongest months for the U.S. stock market since 1955, driven largely by the FOMC decision to keep interest rates low and expectations of moderating trade tensions between the U.S. and China
  • An astonishing 100% of futures markets participants expect the Fed to cut the Federal Funds rate between 0.25% and 0.50% in July. Conventional wisdom states that when 100% of market participants expect something, it’s time for rational investors to exit.
  • Conclusion: Forecasts for multiple cuts in the Federal Funds rate are overdone; investors should be prepared for the stock market to react badly if expected rate cuts don’t materialize in July.

When the FOMC announced they would not raise the Federal Funds rate in June, global stock markets cheered.

Despite continuing uncertainty about trade tariffs, the decision not to raise rates was a relief to investors. Stock prices in both Europe and the U.S. jumped immediately after the announcement and held their gains through the rest of the week. Treasury bond prices rallied as well, bringing the 10-year interest rate below 2% for the first time since November 2016.

Source: finance.yahoo.com

This enthusiasm may be warranted as the U.S. economy has reached the longest expansion since economists started recording expansions in the 1930s (120 months plus 1 day), edging past the expansion of 1991 to 2001.

But the markets seem a bit schizophrenic lately in their response to economic data.

Longest expansion since 1930s

After their meeting in mid-June, Federal Reserve officials indicated that monetary policy can remain accomodative because concerns about a weakening economy had increased.

Here is the schizophrenic part: If the economy is indeed slowing, shouldn’t the stock market be cautious since corporate profits are expected to slow? But despite a few bad days and weeks from time to time, the U.S. stock market has hit new highs in 2019. If the Fed becomes more confident about the economy and raises interest rates slightly, this should signal stronger future corporate profits and boost the stock market. But instead of cheers, the prospect of the Fed continuing to ‘normalize’ short-term interest rates has been met with stock market tumbles.

This fearful reaction might be based on historical precedents which are no longer relevant. Some past expansions were indeed derailed by the Fed increasing rates too much. But the last 3 recessions in the U.S. were not sparked by interest rate increases but by market excesses: the Dot Com boom and bust in 1999-2000 and the housing price bubble in 2007-2008 being prime examples.

To better gauge when and if the economic expansion has run its course, investors would be wise to worry less about the Federal Funds rate and more about asset values, business activity, and the strength of labor markets.

According to Dr. David Kelly, chief global strategist for J.P. Morgan Asset Management, the four key areas to watch in regard to ‘expansion killers’ are home building, business fixed investment, motor vehicle sales, and change in inventories.

Dr. David Kelly’s ‘expansion killers’

Recessions since the late 90s have been associated less with interest rates and more with booms and busts in at least one of these areas. Since none of these factors are in ‘boom’ territory, it’s difficult to imagine a ‘bust’ scenario around the corner. As Dr. Kelly said, it’s hard to hurt yourself when jumping out a basement window.

The only leading indicator sitting on the second floor – rather than the basement – is the level of U.S. stock prices relative to earnings. As reported by Ned Davis Research, S&P 500 valuations in June were higher than average, but not by much. Whether you look at current earnings or forward earnings projections, the stock market seems to be fairly valued.

U.S. stock market valuation seems fair

In any case, the Fed may have less ability to influence the economy than people think.

These days inflation seems more responsive to changes in global dynamics such as oil prices rather than domestic economic factors. Changing the Federal Funds rate isn’t likely to make much difference in the current economic environment.

Low wage growth keeps inflation under control

Despite record low unemployment, wage growth has remained subdued helping keep inflation low as participants have begun returning to the job market after being sidelined during the ‘Great Recession’ of 2008-2009.

Range-bound oil prices are also putting downward pressure on inflation. OPEC has been trying to limit oil production for 2 years now, with mixed results. Their goal is to balance excess supply with less demand given the slowing Chinese economy, tariffs, and other political concerns. Despite these efforts, oil supplies are plentiful and prices remain restrained.

U.S. oil production offsets OPEC cuts

Has the Fed done too much? Or perhaps too little? When looking at the Federal Funds rate from a historical perspective, the FOMC has been extraordinarily cautious in its pace of increasing interest rates. Fed governors could certainly make a mistake, but it seems like their slow and steady pace is a wise approach for the foreseeable future. There’s no urgent need to raise rates, and limited value in lowering rates.

FOMC has been cautious ‘normalizing’ interest rates

The primary risk to the global economy, particularly the manufacturing sector, isn’t interest rates but rather trade tensions. The U.S. and France are the only developed economies with manufacturing sectors still in expansion territory. Overseas, Germany’s manufacturing sector has fallen the most as much of its manufactured goods have traditionally been exported to the U.S. and other countries.

With most of the developed world struggling to stay in positive territory, global demand and supply dynamics are likely to keep U.S. inflation near or below the Fed’s 2% target indefinitely.

Global manufacturing feels the bite of tariffs

Despite the modestly positive economic landscape, an astonishing 100% of Eurodollar futures participants expect the Fed to cut the rates between 0.25% and 0.50% in July.

Since the Fed’s decision in June to keep interest rates the same, futures market participants began enthusiastically betting on not just one 0.25% cut, but two cuts in the Federal Funds rate when the FOMC meets in July. Conventional wisdom states that when 100% of market participants expect something, it’s time for rational investors to exit.

After the first flurry of press reports forecasting a rate cut in July, more Fed officials have been speaking publicly about their base case economic scenario being steady, not requiring a rate cut. In recent days futures markets have slowly begun migrating away from projecting two rate cuts in July to only one, but even one cut isn’t justified by the data…at least not yet.

Futures expectations for July rate cuts

If we look forward to the end of the year, according to the CME Group ‘Countdown to FOMC’ as of July 1st over 13% of futures market participants think the Fed Funds rate will end the year between 2% and 2.25% (0.25% below the current level); another 13% believe the rate will be between 1.25% and 1.50% (1% below the current level!); and the median expectation is split with about 35% forecasting a Fed Funds rate between 1.5% and 1.75% (0.75% below the current level) and another 35% forecasting the Fed Funds rate to be between 1.75% and 2.0% by December (0.50% below the current level).

Barring a steep recession in the near term, expectations for multiple cuts in the Federal Funds rate are misguided. As my colleague at WSWA put it, the Fed is stuck in the unenviable position of a parent in the supermarket with a fractious child demanding candy before dinner. The right thing is to say No, but it’s difficult for both the parent (the Fed) and bystanders not to give in to the pressure.

Futures forecast for rate hikes by December


With all this uncertainty, where can investors find good opportunities?

The answer is: In the global equity markets, particularly in Europe. The U.S. market should be fine going forward, but the best returns may have already come and gone. Though European economies are having a tough time right now, the European stock markets have been punished perhaps more than is warranted. In fact, the price of European stocks as of May 31st is less than 13 times compared to the U.S. stock market at close to 16 times earnings.

International stock valuation cheaper than U.S.

The way ahead in Europe is not going to be smooth, but long-term investors should consider dipping into international markets where stock valuations are more attractive. Overseas countries are generally behind the U.S. in their business cycles and have more growth to come.

Conclusion: Investors and the Fed should stay the course. Sometimes the best decision is to do nothing…for now.

Yes, the global economy is struggling right now. Corporations and governments have been issuing too much debt. Trade tensions and uncertainty make it difficult for businesses to develop long-term growth strategies. Political tensions across Europe and the U.K. are adding uncertainty to global economies.

Despite these concerns, the Fed should not lower interest rates. In fact, there is a case to be made to raise rates to balance outcomes between savers and speculators, plus keep some dry powder for the next recession.

Long-term investors should consider international assets. This is not the environment to make big bets either in or out of the financial markets. Instead, investors should stay engaged in the markets and be selective about segments likely to provide a reasonable risk/return profile over the remaining business cycle. With government bond yields extremely low and U.S. stock prices fully valued, carefully selected international securities may be the right choice for patient investors able to handle some bumps along the way.

Marcia Clark, CFA
Senior Research Analyst

DISCLOSURES

Investment Advisor Representative, Warren Street Wealth Advisors, LLC., a Registered Investment Advisor

The information presented here represents opinions and is not meant as personal or actionable advice to any individual, corporation, or other entity. Any investments discussed carry unique risks and should be carefully considered and reviewed by you and your financial professional. Nothing in this document is a solicitation to buy or sell any securities, or an attempt to furnish personal investment advice. Warren Street Wealth Advisors may own securities referenced in this document. Due to the static nature of content, securities held may change over time and current trades may be contrary to outdated publications.

Form ADV available upon request 714-876-6200

March 2019 Market Commentary

Key Takeaways

    • The rally in U.S. stocks slowed in March but still posted the best 1st quarter in recent memory at 13.65%, though stock markets remain volatile as investors seem to overreact to fears of the Fed increasing interest rates too much or not increasing rates at all
    • A slightly better-than-expected jobs report for March helped calm fears about mixed economic data in the U.S., supporting the Fed’s decision to keep short-term interest rates low for the foreseeable future
    • The OECD lowered its forecast for European GDP growth to a paltry 1.0% in 2019 and 1.2% in 2020; German government bonds fell into negative territory after the ECB reported weak manufacturing data
    • Overall, improved labor conditions, lower headline inflation, and accommodative monetary policy should help support real income growth and household spending in most developed countries


  • Conclusion: Recent market swings seem driven more by fear than by fundamentals. Economic data isn’t great, but the data doesn’t support a forecast for a global recession; U.S. markets are likely to hang on to gains until or unless weakness in the economy becomes more clear.


Is the U.S. economy getting better? Or getting worse?

The S&P 500 had its best 1st quarter return in recent memory, yet the Federal Reserve Bank kept interest rates low to avoid derailing the economy. Which of these forward-looking indicators is correct? To answer this question, let’s start at the beginning. You may have learned in school that GDP – the primary measure of economic strength – is simply the value of all goods and services sold in a country over a given period of time. In essence, GDP represents the value of business transactions. These transactions flow into company financial statements and impact the ability of these companies to pay dividends or launch new ventures. This increased cash flow is recognized by investors, who become willing to pay more for shares of those businesses in the stock market, pushing stock prices up. If the economy is up, stock prices are up too.

Easy, right? All the dominoes line up and we understand how the market works…or maybe not?

Here is the conundrum: stock prices are a ‘leading economic indicator’ because investors buy today expecting gains in the future. Interest rates are also leading indicators because investors need to forecast future interest rates – which typically move up and down with economic activity – before they’re willing to tie up their money for 10 or 20 years. Stock and bond prices don’t usually go up together.

Source: https://www.pimco.com/en-us/resources/education/everything-you-need-to-know-about-bonds

If interest rates go up, prices of existing fixed-rate bonds go down in order to compete with new bonds issued with higher coupon (interest) rates. But rising interest rates usually indicate more demand for funds, which is often associated with a strong economy, which means more profits, and consequently higher stock prices.

The upshot of all this is when stock prices go up, bond prices are usually flat or negative. Conversely, when stock prices go down, bond prices are usually positive as investors sell volatile stocks and seek safer assets such as government bonds.

Source: https://stockcharts.com/h-perf/ui

As you can see from the chart above, bond prices as represented by the long-term Treasury ETF (ticker ‘TLT’ – blue line) usually go up when stock prices go down (represented by the Dow Jones Industrial Average – black line), and vice versa. This effect was particularly dramatic during the 4th quarter of 2018.

Despite the strong start for stocks in 2019, if you look back 6-months from October to March, bonds have been among the best performing asset classes. Bonds may not be sexy, but they sure are welcome when markets get rough! But wait – look at the red box in February and March. Bond and stock prices are moving together. Why??

The charts below from the Bureau of Economic Analysis may hold some of the answers. In a nutshell, the problem is Change. And I don’t mean the kind of change you find in your sofa cushions…

Chart 1: The U.S. economy is growing, but slower than in recent quarters.


Consumer spending takes a breath after spiking in April

Chart 2: Disposable income is increasing, but consumer spending is down.

Chart 3: Companies are adding value to GDP, but at a slower pace than previously.

The economic data is okay, but clearly slowing from the strong levels of 2017-2018. Does ‘slowing’ economic activity mean a recession is around the corner? I don’t think so, and many commentators are coming around to this view. What’s really moving the market, then? In addition to economic fundamentals, the stock market seems to be overreacting to the possibility of interest rates going up…or going down. Does being afraid of both situations make any sense? Probably not.

If the Fed increases rates too aggressively, they could indeed stall the economy. But we should take comfort in the persistent ‘data dependent’ stance of the Fed. They have no intention of being aggressive with interest rate hikes, so the stock market should probably find something else to worry about. In fact, institutional investors seem to agree that short-term rates are going nowhere any time soon. Federal Funds futures contracts are predicting the Fed will decrease rates by the end of 2019, though the Fed’s own ‘dot plot’ shows a possibility of one rate increase by the end of the year.

Source: https://www.cmegroup.com/trading/interest-rates/countdown-to-fomc.html

Source: https://www.federalreserve.gov/monetarypolicy/files/fomcprojtabl20190320.pdf

The Fed is also cautious about raising short-term rates too quickly and causing the Treasury yield curve to become ‘inverted’. An inverted yield curve is one where short-term interest rates are higher than longer term rates. This isn’t normal! Investors and lenders usually require higher rates to lock up their money for a longer period of time. An inverted curve is usually driven by…here’s that word again…Change.

The yield curve can invert under three basic scenarios:


  • The Fed is aggressively increasing short-term interest rates to cool down an overheated economy


  • Investors are demanding less return for longer maturities because they believe inflation, and consequently future interest rates, will be lower than they are currently


  • Differing supply and demand pressures on the short and long portions of the yield curve, sometimes driven by interest rate differentials between the U.S. and other developed countries


An inverted yield curve has preceded many recessions in the past few decades, which is why it makes people uncomfortable. But the inversion has happened as much as 2 years before the recession, so I’m not sure that the curve is actually predicting anything. It’s more helpful to analyze the economic situation driving the curve shape, rather than drawing conclusions from the curve alone. You might take comfort in knowing that post-inversion recessions have only happened when the 10-year Treasury yield was at least 0.50% below the Fed Funds rate, which we’re nowhere near. Right now my money is on Option #3 – a supply demand imbalance, not an imminent recession. Nonetheless, the current Treasury curve is slightly inverted between the 1 year and 5 year maturities and the Fed doesn’t want it to get worse and spook investors.

Source: Morningstar.com

It doesn’t make much sense for investors to be afraid of interest rates going up and also afraid of interest rates going down. But that seems to be the case at the moment and is a key driver of recent volatility in the U.S. stock market. Let’s be ‘data dependent’ for a minute and draw our own conclusions based on what we can see in the global economic landscape:

  1. The Fed is being cautious about raising or lowering interest rates because economic data doesn’t point strongly either up or down and they don’t want to spook the financial markets
  2. Though corporate earnings forecasts are lower than 2018, the majority of S&P 500 companies reporting slower earnings projections for the 1st quarter of 2019 have experienced positive stock price movement; S&P 500 gains year-to-date have been felt broadly across many sectors
  3. U.S. manufacturing output slipped to its lowest level in 2 years, despite trade tensions between the U.S. and China moderating somewhat rather than getting worse
  4. Challenges persist overseas, particularly in Europe, as trade tariffs hit European and Asian businesses harder than the U.S.; factory output in the Eurozone fell in March at the fastest pace in 6 years
  5. Manufacturing data in China, the second largest economy in the world, was stronger than expected in March; the Chinese economy is expected to slow to a still robust 6% GDP growth in 2019 and beyond
  6. European markets are stabilizing as the U.K. Parliament seems to be making progress identifying a viable ‘Brexit’ strategy; economic disaster in Europe due to stalled trade with Britain seems unlikely
  7. Trade tariffs aside, improved labor conditions, lower headline inflation, and accommodative monetary policy should help support real income growth and household spending in most developed countries
  8. Emerging economies are avoiding much of the global slowdown as many smaller countries benefit from strong capital investment, improving income growth, and economic and political reforms in recent years

What conclusions can we draw from all this data?

The economic data is certainly mixed, but most indicators point to slower growth in 2019, not a recession. From what we can see today, global economies, and consequently financial markets, should stay in modestly positive territory for the near term. We can sleep well at night knowing the ship is headed in the right direction…for now.


ASSET CLASS and SECTOR RETURNS as of MARCH 2019

Source: Morningstar Direct

Source: S&P Dow Jones Indices

Marcia Clark, CFA, MBA
Senior Research Analyst
Warren Street Wealth Advisors

Warren Street Wealth Advisors, a Registered Investment Advisor. The information contained herein does not involve the rendering of personalized investment advice but is limited to the dissemination of general information. A professional advisor should be consulted before implementing any of the strategies or options presented. Any investments discussed carry unique risks and should be carefully considered and reviewed by you and your financial professional. Past performance may not be indicative of future results. All investment strategies have the potential for profit or loss. 

DISCLOSURES

Investment Advisor Representative, Warren Street Wealth Advisors, LLC., a Registered Investment Advisor


The information presented here represents opinions and is not meant as personal or actionable advice to any individual, corporation, or other entity. Any investments discussed carry unique risks and should be carefully considered and reviewed by you and your financial professional. Nothing in this document is a solicitation to buy or sell any securities, or an attempt to furnish personal investment advice. Warren Street Wealth Advisors may own securities referenced in this document. Due to the static nature of content, securities held may change over time and current trades may be contrary to outdated publications.

Form ADV available upon request 714-876-6200


2015: A First Quarter Review

A quick summary of economies & markets for you.


On Wall Street, the opening quarter of 2015 played out like the first quarter of 2014: gains for the Nasdaq and S&P 500, a small loss for the Dow. In another resemblance, uncertainties emerged about the strength of the economy. Hiring data and consumer confidence readings were mostly strong, yet Q1 did not see notable consumer spending or retail sales gains. Commodities suffered as the dollar rally continued. The pace of home sales wavered, but the big picture of the housing market was still very positive. While our central bank considered near-term tightening, economic signals in Asia and Europe led other central banks to ease.1

Domestic economic health. The first quarter brought some good news and some question marks. Monthly job creation reached 201,000 in January, 264,000 in February and then just 126,000 in March – a sudden drop that made some analysts conclude that the strong dollar was now eating into company profits and expansion. The unemployment rate was down to 5.5% in March; the broader U-6 rate including the underemployed with the unemployed was at 10.9%. Wages were up 2.1% on an annualized basis, but that was countered by a slight reduction in the average workweek.2

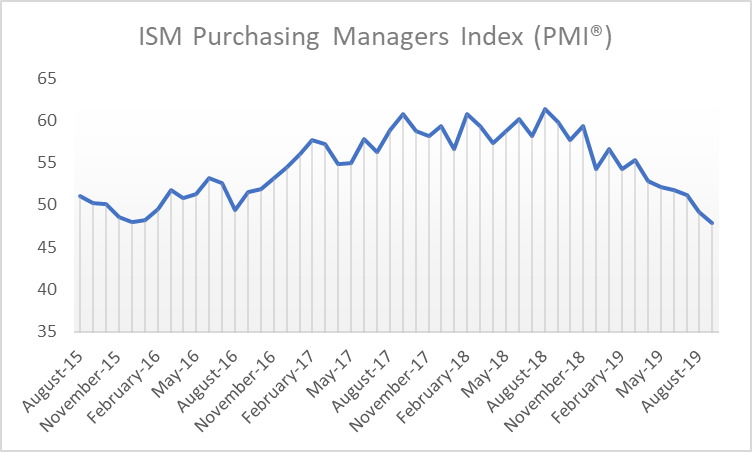
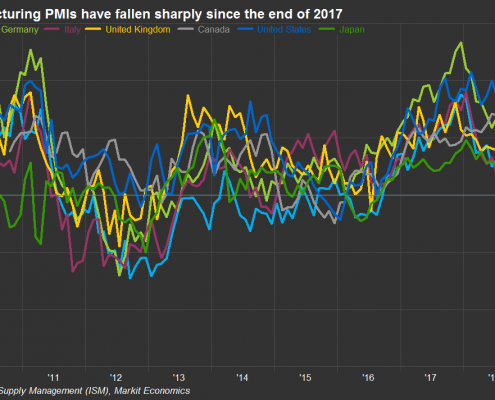
Another question mark involved the manufacturing sector. In March, the Institute for Supply Management’s respected factory PMI slipped to 51.5 – down for the fifth consecutive month. (It was at 53.5 in January, 52.9 in February.) ISM’s service sector PMI was more encouraging, coming in at 56.7 for January, 56.9 for February and 56.5 for March.3,4

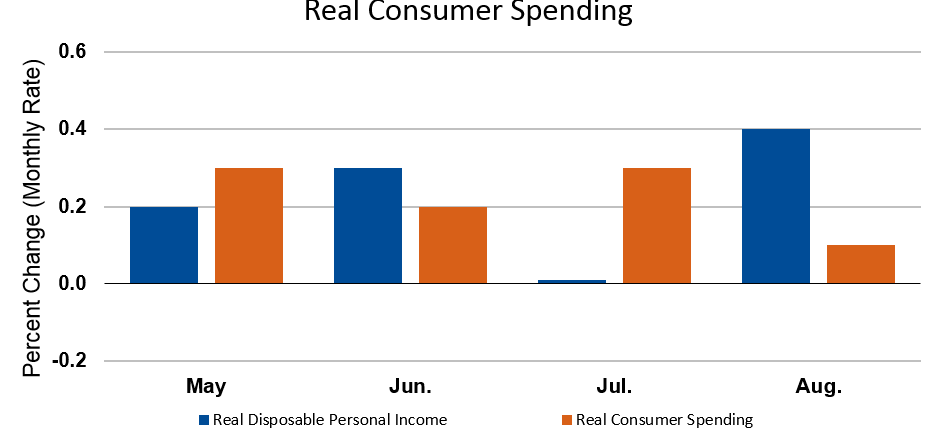
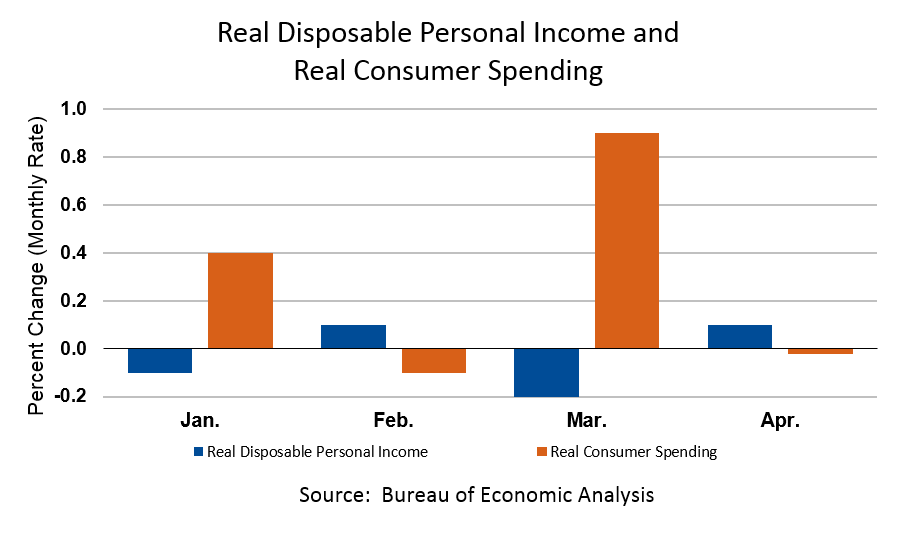
Personal spending figures were also unimpressive, and so were retail sales numbers (although lower gas prices impacted both indicators). According to the Commerce Department, household spending fell off 0.2% in the first month of 2015 and then ticked up 0.1% in February. Retail purchases were down 0.8% for January, 0.6% for February. Household incomes did rise by 0.3% in January and another 0.4% a month later. The plunge in gas prices helped send the Consumer Price Index south 0.7% in January, but then it advanced 0.2% for February.5,6

Consumers may not have spent freely in Q1, but they were upbeat. The Conference Board’s consumer confidence index came in at an impressive 103.8 in January, and rebounded to 101.3 in March after a dip to 98.8 in February. The University of Michigan’s consumer sentiment index ended the quarter at 93.0 after reaching 98.1 in January and 95.4 in February. (For both indices, readings above 90 are considered quite strong.).7,8

On the factory front, the Producer Price Index moved south like the CPI, falling 0.8% in January and 0.5% for February with the drop in fuel and energy costs as a major influence. Headline hard goods orders rose 2.0% in January, then fell 1.4% in February.5,6

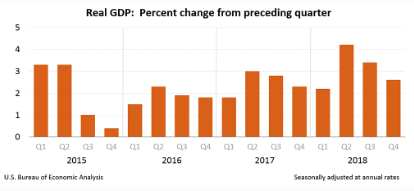
The Bureau of Economic Analysis made its third, final estimate of Q4 GDP: 2.2%, unchanged from the second estimate. By the end of the quarter, some economists thought Q1 GDP would pale in comparison. The Atlanta Fed projected Q1 growth at 0.1%, and S&P Capital IQ felt Q1 would bring a 3.0% dip in corporate profits.2,5

The Federal Reserve found a new way to say what it had actually been saying for the past few quarters – and the subtle change in wording in its March policy statement seemed reassuring. It removed the word “patient” from its statement (as Wall Street analysts thought it would), but it also cut its 2015 GDP forecast to 2.3-2.7% and its 2015 inflation projection to 0.6-0.8%, an indication that any notions of raising interest rates in spring or summer may have subsided.9

Global economic health. Outside our borders, the quarter was notable for two developments: the European Central Bank’s new quantitative easing effort and a wave of interest rate cuts.

Strong measures were clearly needed to try and improve the euro area economy. In February, the region’s consumer prices were down 0.3% year-over-year while its jobless rate was twice that of the United States (11.3%). So on January 22, the ECB stated that it would by €60 billion worth of eurozone bonds per month through September 2016, in imitation of the Federal Reserve’s QE programs.10,11

By quarter’s end, some signs of an economic pickup had emerged: Europe’s stock markets were lifted, and indicators showed improved money supply credit, household confidence and retail sales (which had improved 3.7% annually).12

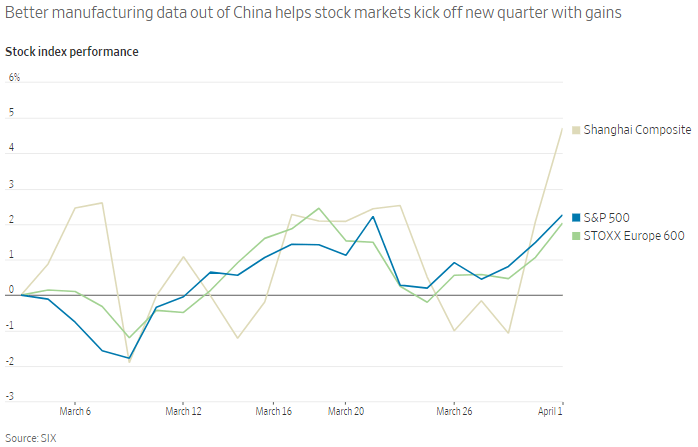
Fading oil prices meant reduced inflation in emerging market economies. Several took swift action against deflation risks: India and China cut their benchmark interest rates twice in Q1, and easing also occurred in Indonesia, Thailand, Australia, South Korea and Singapore. Asia Pacific factories were not exactly humming: China’s official manufacturing PMI barely showed growth in March at a reading of 50.1, and there were significant drops in factory orders in Japan and Indonesia and exports in South Korea by March.13

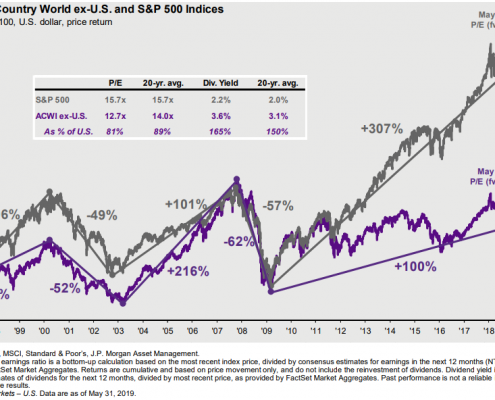
World markets. The first quarter brought some sizable stock market gains – just not in the United States. The onset of quantitative easing in the eurozone sent that region’s indices soaring – the DAX jumped 22.03% for the quarter, the FTSE MIB 21.80%, the STOXX 600 15.99% and the CAC 40 17.91%. In addition, England’s FTSE 100 advanced 3.15%.14

Every consequential Asia Pacific benchmark posted a Q1 gain except Pakistan’s KSE 100, which retreated 5.91%. The Shanghai Composite advanced 15.87%, the Sensex 1.67%, the Nikkei 225 10.06%, the Jakarta Composite 5.58%, the Kospi 6.55%, the Hang Seng 5.49% and the S&P/ASX 200 8.88%. In the Americas, Argentina’s MERVAL rose 26.32%, Mexico’s IPC All-Share 1.34%, Canada’s TSX Composite 1.85% and Brazil’s Bovespa 2.29%.14

As for the key Dow Jones and MSCI indices, the Europe Dow went +1.22%, the Global Dow +0.66%, the Asia Dow +7.02% and the Dow Jones Americas +0.31%. The MSCI World Index rose 1.82%; the MSCI Emerging Markets Index gained 1.91%.14,15

Commodities markets. The quarter saw a 7.9% fall for the broad Thomson Reuters/Jefferies CRB Index and an 8.97% rise for the U.S. Dollar Index. So Q1 gains were rare.16,17

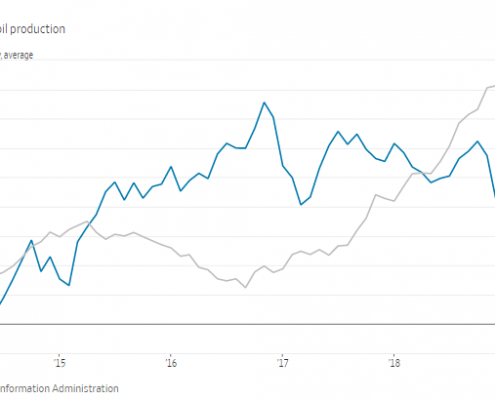
Looking at the performance of CRB components, we see unleaded gas way out in front of other energy futures – ahead of everything else, in fact, with a 7.6% Q1 advance. Oil slipped another 10.6%, natural gas 12.7% and heating oil 8.1%. Light sweet crude ended Q1 at a NYMEX price of $47.60.16,18

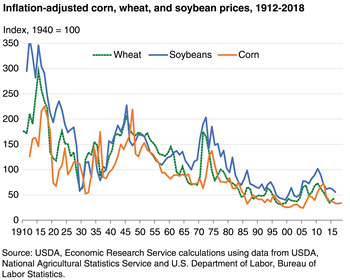
Amid crops, cotton posted a 3.5% quarterly improvement. Elsewhere, losses abounded: corn declined 3.9%, soybeans 4.8%, cocoa 5.9%, oats 10.9%, wheat 14.0%, sugar 14.2% and coffee 19.6%.16

Gold ended Q1 just $0.90 lower on the COMEX, going -0.1% for the quarter to settle at $1,183.20 an ounce on March 31. That same day, silver settled at $16.60 an ounce. Silver had a much better Q1, going +6.4%. Palladium futures fell 7.9% in the quarter, platinum futures 5.5%.19

Real estate. By quarter’s end, the annual change in new and existing home sales was nicely positive. The year-over-year difference is what matters most, and the latest available reports from the Census Bureau and National Association of Realtors showed new home sales up 24.8% on an annualized basis and resales up 4.7% in the past 12 months.20,21

The housing industry also closely watches a markedly lagging indicator as well as an indicator of future sales activity. In March, the latest available S&P/Case-Shiller home price index (January) had an overall year-over-year gain of 4.5% versus 4.6% in December. NAR’s pending home sales index rose 1.2% in January, and then another 3.2% in February. A look at construction activity in February (as recorded by the Census Bureau) reveals building permits up 7.7% annually but housing starts decreased 3.3% in  year, with a 17.0% drop in February putting the pace of new projects at a 13-month low.5,22

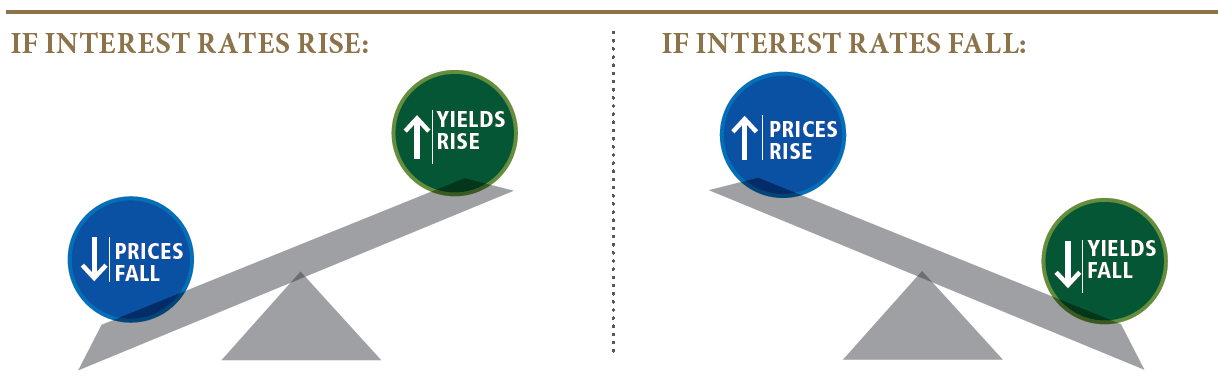
Interest rates descended on most mortgage types during the quarter. The average rate on the 1-year ARM moved north 0.06% to 2.46% between Freddie Mac’s December 31 and March 26 Primary Mortgage Market Surveys, but the average interest on 30-year and 15-year fixed rate loans lessened 0.18% (to 3.69% and 2.97%, respectively). Interest on a 5/1-year adjustable rate mortgage averaged 3.01% in the December 31 survey and 2.92% in the March 26 survey.23

Looking back … looking forward. Small caps rallied in Q1: the Russell 2000 gained 3.99%, wrapping up the quarter at 1,252.77. Other end-of-quarter settlements were as follows: S&P 500, 2,067.89; Dow, 17,776.12; Nasdaq, 4,900.88. The CBOE VIX “fear index” closed the third month of 2015 at -20.36%. The hottest stateside equities index in Q1 was the NYSE Arca Biotechnology Index, which gained 15.95%; the VIX was the coldest. The Nasdaq and S&P 500 both logged their ninth straight winning quarters.1,14

% CHANGE Q1 CHG Q4 CHG 1-YR CHG 10-YR AVG
DJIA -0.26 +4.58 +8.01 +6.92
NASDAQ +3.48 +5.40 +16.72 +14.51
S&P 500 +0.44 +4.39 +10.44 +7.52
REAL YIELD 3/31 RATE 1 YR AGO 5 YRS AGO 10 YRS AGO
10 YR TIPS 0.18% 0.60% 1.60% 1.79%

Sources: online.wsj.com, bigcharts.com, treasury.gov – 3/31/1514,24,25,26

Indices are unmanaged, do not incur fees or expenses, and cannot be invested into directly.

These returns do not include dividends.

Stock market analysts were not very bullish about Q1 when it began, and the Dow and S&P essentially treaded (rough) water in the first three months of the year. Given the powerful dollar and low oil prices, the outlook for Q2 is similar. If America’s growth is in fact moderating in 2015, it may slow the bulls but not quite halt them – and fundamental economic indicators could surprise to the upside this spring even if earnings are lackluster. With any luck, 2015 could end up mimicking 2014 on Wall Street – a slow start, but a nice finish and a solid year for the market with hiring, consumer confidence, wage growth and consumer spending figures encouraging investors. Perhaps this quarter is when momentum resumes.

At the beginning of July, I’ll review Q2 2015. Between now and then, you may of course call me at «representativephone» or email me at «representativeemail» if you have questions, thoughts or concerns about your progress toward your financial objectives. I look forward to hearing from you.


Sincerely yours,


Warren Street Wealth Advisors

190 S. Glassell St., Suite 209

Orange, CA 92866

714-876-6200 – office

714-876-6202 – fax


Investment Advisor Representative, Warren Street Wealth Advisor, LLC., a Registered Investment Advisor.


This material was prepared by MarketingPro, Inc., and does not necessarily represent the views of the presenting party, nor their affiliates. This information has been derived from sources believed to be accurate. MarketingPro, Inc. is not affiliated with any broker or brokerage firm that may be providing this information to you. This information should not be construed as investment, tax or legal advice and may not be relied on for the purpose of avoiding any Federal tax penalty. This is not a solicitation or recommendation to purchase or sell any investment or insurance product or service, and should not be relied upon as such. The Dow Jones Industrial Average is a price-weighted index of 30 actively traded blue-chip stocks. The NASDAQ Composite Index is an unmanaged, market-weighted index of all over-the-counter common stocks traded on the National Association of Securities Dealers Automated Quotation System. The Standard & Poor’s 500 (S&P 500) is an unmanaged group of securities considered to be representative of the stock market in general. It is not possible to invest directly in an index. NYSE Group, Inc. (NYSE:NYX) operates two securities exchanges: the New York Stock Exchange (the “NYSE”) and NYSE Arca (formerly known as the Archipelago Exchange, or ArcaEx®, and the Pacific Exchange). NYSE Group is a leading provider of securities listing, trading and market data products and services. The New York Mercantile Exchange, Inc. (NYMEX) is the world’s largest physical commodity futures exchange and the preeminent trading forum for energy and precious metals, with trading conducted through two divisions – the NYMEX Division, home to the energy, platinum, and palladium markets, and the COMEX Division, on which all other metals trade. The DAX 30 is a Blue Chip stock market index consisting of the 30 major German companies trading on the Frankfurt Stock Exchange. The FTSE MIB (Milano Italia Borsa) is the benchmark stock market index for the Borsa Italiana, the Italian national stock exchange. The Dow Jones STOXX 600 Index captures more than 90% of the aggregate market cap of European-based companies. The CAC-40 Index is a narrow-based, modified capitalization-weighted index of 40 companies listed on the Paris Bourse. The FTSE 100 Index is a share index of the 100 most highly capitalized companies listed on the London Stock Exchange. Karachi Stock Exchange 100 Index (KSE-100 Index) is a stock index acting as a benchmark to compare prices on the Karachi Stock Exchange (KSE) over a period.  The SSE Composite Index is an index of all stocks (A and B shares) that are traded at the Shanghai Stock Exchange. BSE Sensex or Bombay Stock Exchange Sensitivity Index is a value-weighted index composed of 30 stocks that started January 1, 1986. Nikkei 225 (Ticker: ^N225) is a stock market index for the Tokyo Stock Exchange (TSE). The Nikkei average is the most watched index of Asian stocks. The IDX Composite or Jakarta Composite Index is an index of all stocks that are traded on the Indonesia Stock Exchange (IDX). The Korea Composite Stock Price Index or KOSPI is the major stock market index of South Korea, representing all common stocks traded on the Korea Exchange. The Hang Seng Index is a freefloat-adjusted market capitalization-weighted stock market index that is the main indicator of the overall market performance in Hong Kong. The S&P/ASX 200 is Australia’s “premier” share market index. The MERVAL Index (MERcado de VALores, literally Stock Exchange) is the most important index of the Buenos Aires Stock Exchange. The Mexican IPC index (Indice de Precios y Cotizaciones) is a capitalization-weighted index of the leading stocks traded on the Mexican Stock Exchange.  The S&P/TSX Composite Index is an index of the stock (equity) prices of the largest companies on the Toronto Stock Exchange (TSX) as measured by market capitalization. The Bovespa Index is a gross total return index weighted by traded volume & is comprised of the most liquid stocks traded on the Sao Paulo Stock Exchange. The Europe Dow measures the European equity markets by tracking 30 leading blue-chip companies in the region. The Global Dow (GDOW) is a 150-stock index of corporations from around the world, created by Dow Jones & Company.  The Asia Dow measures the Asia equity markets by tracking 30 leading blue-chip companies in the region. The Dow Jones Americas Index measures the Latin American equity markets by tracking 30 leading blue-chip companies in the region. The MSCI World Index is a free-float weighted equity index that includes developed world markets, and does not include emerging markets. The MSCI Emerging Markets Index is a float-adjusted market capitalization index consisting of indices in more than 25 emerging economies. The US Dollar Index measures the performance of the U.S. dollar against a basket of six currencies. Additional risks are associated with international investing, such as currency fluctuations, political and economic instability and differences in accounting standards. This material represents an assessment of the market environment at a specific point in time and is not intended to be a forecast of future events, or a guarantee of future results. Past performance is no guarantee of future results.  Investments will fluctuate and when redeemed may be worth more or less than when originally invested. All information is believed to be from reliable sources; however we make no representation as to its completeness or accuracy. All economic and performance data is historical and not indicative of future results. Market indices discussed are unmanaged. Investors cannot invest in unmanaged indices. The publisher is not engaged in rendering legal, accounting or other professional services. If assistance is needed, the reader is advised to engage the services of a competent professional.


Citations.

1 – dailyfinance.com/2015/03/31/market-wrap-stocks-retreat-sandp-nasdaq-post-quarterly-gains/ [3/31/15]

2 – tinyurl.com/n668drr [4/3/15]

3 – tradingeconomics.com/united-states/business-confidence [4/1/15]

4 – tradingeconomics.com/united-states/non-manufacturing-pmi [3/4/15]

5 – marketwatch.com/economy-politics/calendars/economic [4/1/15]

6- briefing.com/investor/calendars/economic/2015/03/09-13 [3/13/15]

7 – briefing.com/Investor/Calendars/Economic/Releases/conf.htm [3/31/15]

8 – briefing.com/Investor/Calendars/Economic/Releases/mich.htm [3/27/15]

9 – thestreet.com/story/13084714/1/meaning-of-fed-policy-statement-depends-on-definition-of-is–surprising-market-reaction.html [3/19/15]

10 – ec.europa.eu/eurostat [4/1/15]

11 – finances.com/news/forex/81165-forex-news-quarterly-review-us-dollar-yen-post-strong-gains-as-euro-lags-in-q1.htm [4/2/15]

12 – bloombergview.com/articles/2015-03-24/five-charts-show-europe-s-economy-is-all-right [3/24/15]

13 – reuters.com/article/2015/04/01/global-economy-idUSL3N0WX25L20150401 [4/1/15]

14 – online.wsj.com/mdc/public/page/2_3022-quarterly_gblstkidx.html [3/31/15]

15 – msci.com/products/indexes/country_and_regional/em/performance.html [3/31/15]

16 – blog.runnymede.com/first-quarter-2015-in-review-international-markets-melt-up [3/31/15]

17 – online.wsj.com/mdc/public/npage/2_3050.html?mod=mdc_curr_dtabnk&symb=DXY [4/2/15]

18 – marketwatch.com/story/oil-futures-settle-with-a-loss-for-the-month-and-quarter-2015-03-31 [3/31/15]

19 – coinnews.net/2015/03/31/gold-silver-mixed-in-march-and-quarter-us-mint-coins-solid/ [3/31/15]

20 – ycharts.com/indicators/existing_home_sales [4/5/15]

21 – ycharts.com/indicators/new_homes_sold_in_the_us [4/5/15]

22 – tradingeconomics.com/united-states/housing-starts [3/17/15]

23 – freddiemac.com/pmms/archive.html [4/5/15]

24 – online.wsj.com/mdc/public/page/2_3022-quarterly_gblstkidx.html [12/31/14]

25 – bigcharts.marketwatch.com/historical/default.asp?symb=DJIA&closeDate=3%2F31%2F14&x=0&y=0 [3/31/15]

25 – bigcharts.marketwatch.com/historical/default.asp?symb=COMP&closeDate=3%2F31%2F14&x=0&y=0 [3/31/15]

25 – bigcharts.marketwatch.com/historical/default.asp?symb=SPX&closeDate=3%2F31%2F14&x=0&y=0 [3/31/15]

25 – bigcharts.marketwatch.com/historical/default.asp?symb=DJIA&closeDate=3%2F31%2F05&x=0&y=0 [3/31/15]

25 – bigcharts.marketwatch.com/historical/default.asp?symb=COMP&closeDate=3%2F31%2F05&x=0&y=0 [3/31/15]

25 – bigcharts.marketwatch.com/historical/default.asp?symb=SPX&closeDate=3%2F31%2F05&x=0&y=0 [3/31/15]

26 – treasury.gov/resource-center/data-chart-center/interest-rates/Pages/TextView.aspx?data=realyieldAll [4/5/15]