
March 2019 Market Commentary
Key Takeaways
-
- The rally in U.S. stocks slowed in March but still posted the best 1st quarter in recent memory at 13.65%, though stock markets remain volatile as investors seem to overreact to fears of the Fed increasing interest rates too much or not increasing rates at all
- A slightly better-than-expected jobs report for March helped calm fears about mixed economic data in the U.S., supporting the Fed’s decision to keep short-term interest rates low for the foreseeable future
- The OECD lowered its forecast for European GDP growth to a paltry 1.0% in 2019 and 1.2% in 2020; German government bonds fell into negative territory after the ECB reported weak manufacturing data
- Overall, improved labor conditions, lower headline inflation, and accommodative monetary policy should help support real income growth and household spending in most developed countries
- Conclusion: Recent market swings seem driven more by fear than by fundamentals. Economic data isn’t great, but the data doesn’t support a forecast for a global recession; U.S. markets are likely to hang on to gains until or unless weakness in the economy becomes more clear.
Is the U.S. economy getting better? Or getting worse?
The S&P 500 had its best 1st quarter return in recent memory, yet the Federal Reserve Bank kept interest rates low to avoid derailing the economy. Which of these forward-looking indicators is correct? To answer this question, let’s start at the beginning. You may have learned in school that GDP – the primary measure of economic strength – is simply the value of all goods and services sold in a country over a given period of time. In essence, GDP represents the value of business transactions. These transactions flow into company financial statements and impact the ability of these companies to pay dividends or launch new ventures. This increased cash flow is recognized by investors, who become willing to pay more for shares of those businesses in the stock market, pushing stock prices up. If the economy is up, stock prices are up too.
Easy, right? All the dominoes line up and we understand how the market works…or maybe not?
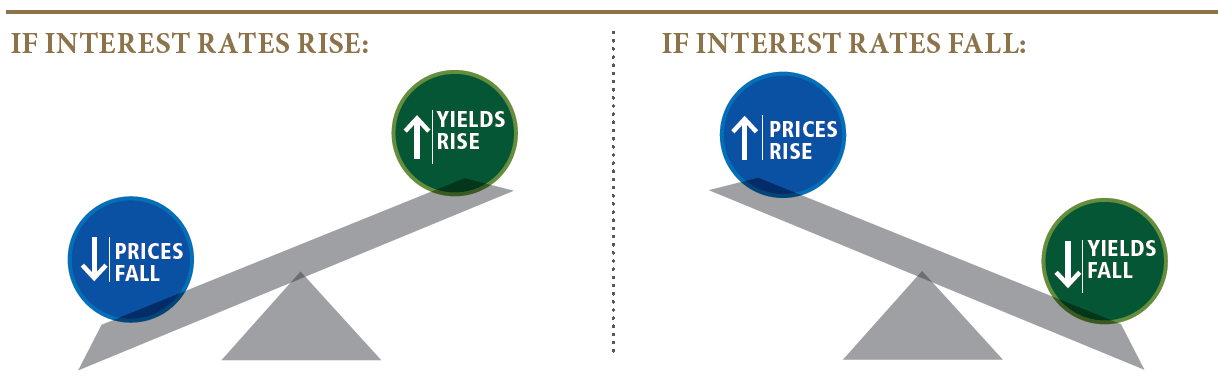
Here is the conundrum: stock prices are a ‘leading economic indicator’ because investors buy today expecting gains in the future. Interest rates are also leading indicators because investors need to forecast future interest rates – which typically move up and down with economic activity – before they’re willing to tie up their money for 10 or 20 years. Stock and bond prices don’t usually go up together.
Source: https://www.pimco.com/en-us/resources/education/everything-you-need-to-know-about-bonds
If interest rates go up, prices of existing fixed-rate bonds go down in order to compete with new bonds issued with higher coupon (interest) rates. But rising interest rates usually indicate more demand for funds, which is often associated with a strong economy, which means more profits, and consequently higher stock prices.
The upshot of all this is when stock prices go up, bond prices are usually flat or negative. Conversely, when stock prices go down, bond prices are usually positive as investors sell volatile stocks and seek safer assets such as government bonds.

Source: https://stockcharts.com/h-perf/ui
As you can see from the chart above, bond prices as represented by the long-term Treasury ETF (ticker ‘TLT’ – blue line) usually go up when stock prices go down (represented by the Dow Jones Industrial Average – black line), and vice versa. This effect was particularly dramatic during the 4th quarter of 2018.
Despite the strong start for stocks in 2019, if you look back 6-months from October to March, bonds have been among the best performing asset classes. Bonds may not be sexy, but they sure are welcome when markets get rough! But wait – look at the red box in February and March. Bond and stock prices are moving together. Why??
The charts below from the Bureau of Economic Analysis may hold some of the answers. In a nutshell, the problem is Change. And I don’t mean the kind of change you find in your sofa cushions…
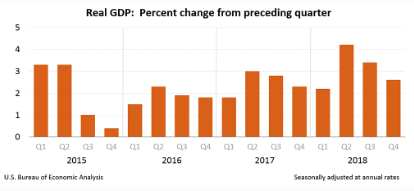
Chart 1: The U.S. economy is growing, but slower than in recent quarters.
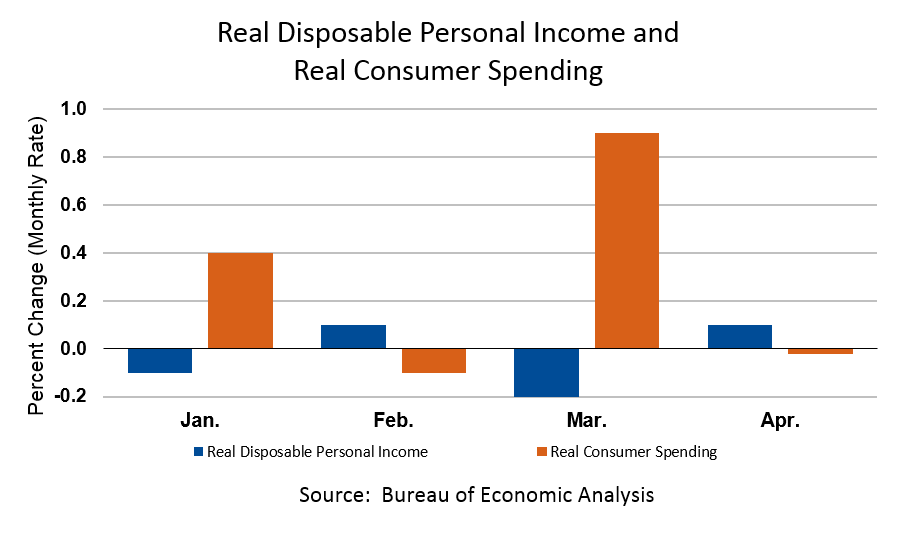
Consumer spending takes a breath after spiking in April
Chart 2: Disposable income is increasing, but consumer spending is down.
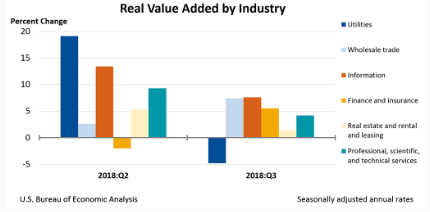
Chart 3: Companies are adding value to GDP, but at a slower pace than previously.
The economic data is okay, but clearly slowing from the strong levels of 2017-2018. Does ‘slowing’ economic activity mean a recession is around the corner? I don’t think so, and many commentators are coming around to this view. What’s really moving the market, then? In addition to economic fundamentals, the stock market seems to be overreacting to the possibility of interest rates going up…or going down. Does being afraid of both situations make any sense? Probably not.
If the Fed increases rates too aggressively, they could indeed stall the economy. But we should take comfort in the persistent ‘data dependent’ stance of the Fed. They have no intention of being aggressive with interest rate hikes, so the stock market should probably find something else to worry about. In fact, institutional investors seem to agree that short-term rates are going nowhere any time soon. Federal Funds futures contracts are predicting the Fed will decrease rates by the end of 2019, though the Fed’s own ‘dot plot’ shows a possibility of one rate increase by the end of the year.

Source: https://www.cmegroup.com/trading/interest-rates/countdown-to-fomc.html
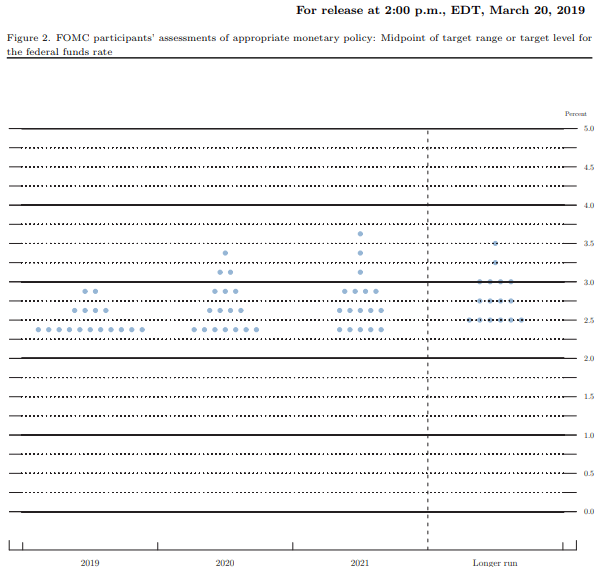
Source: https://www.federalreserve.gov/monetarypolicy/files/fomcprojtabl20190320.pdf
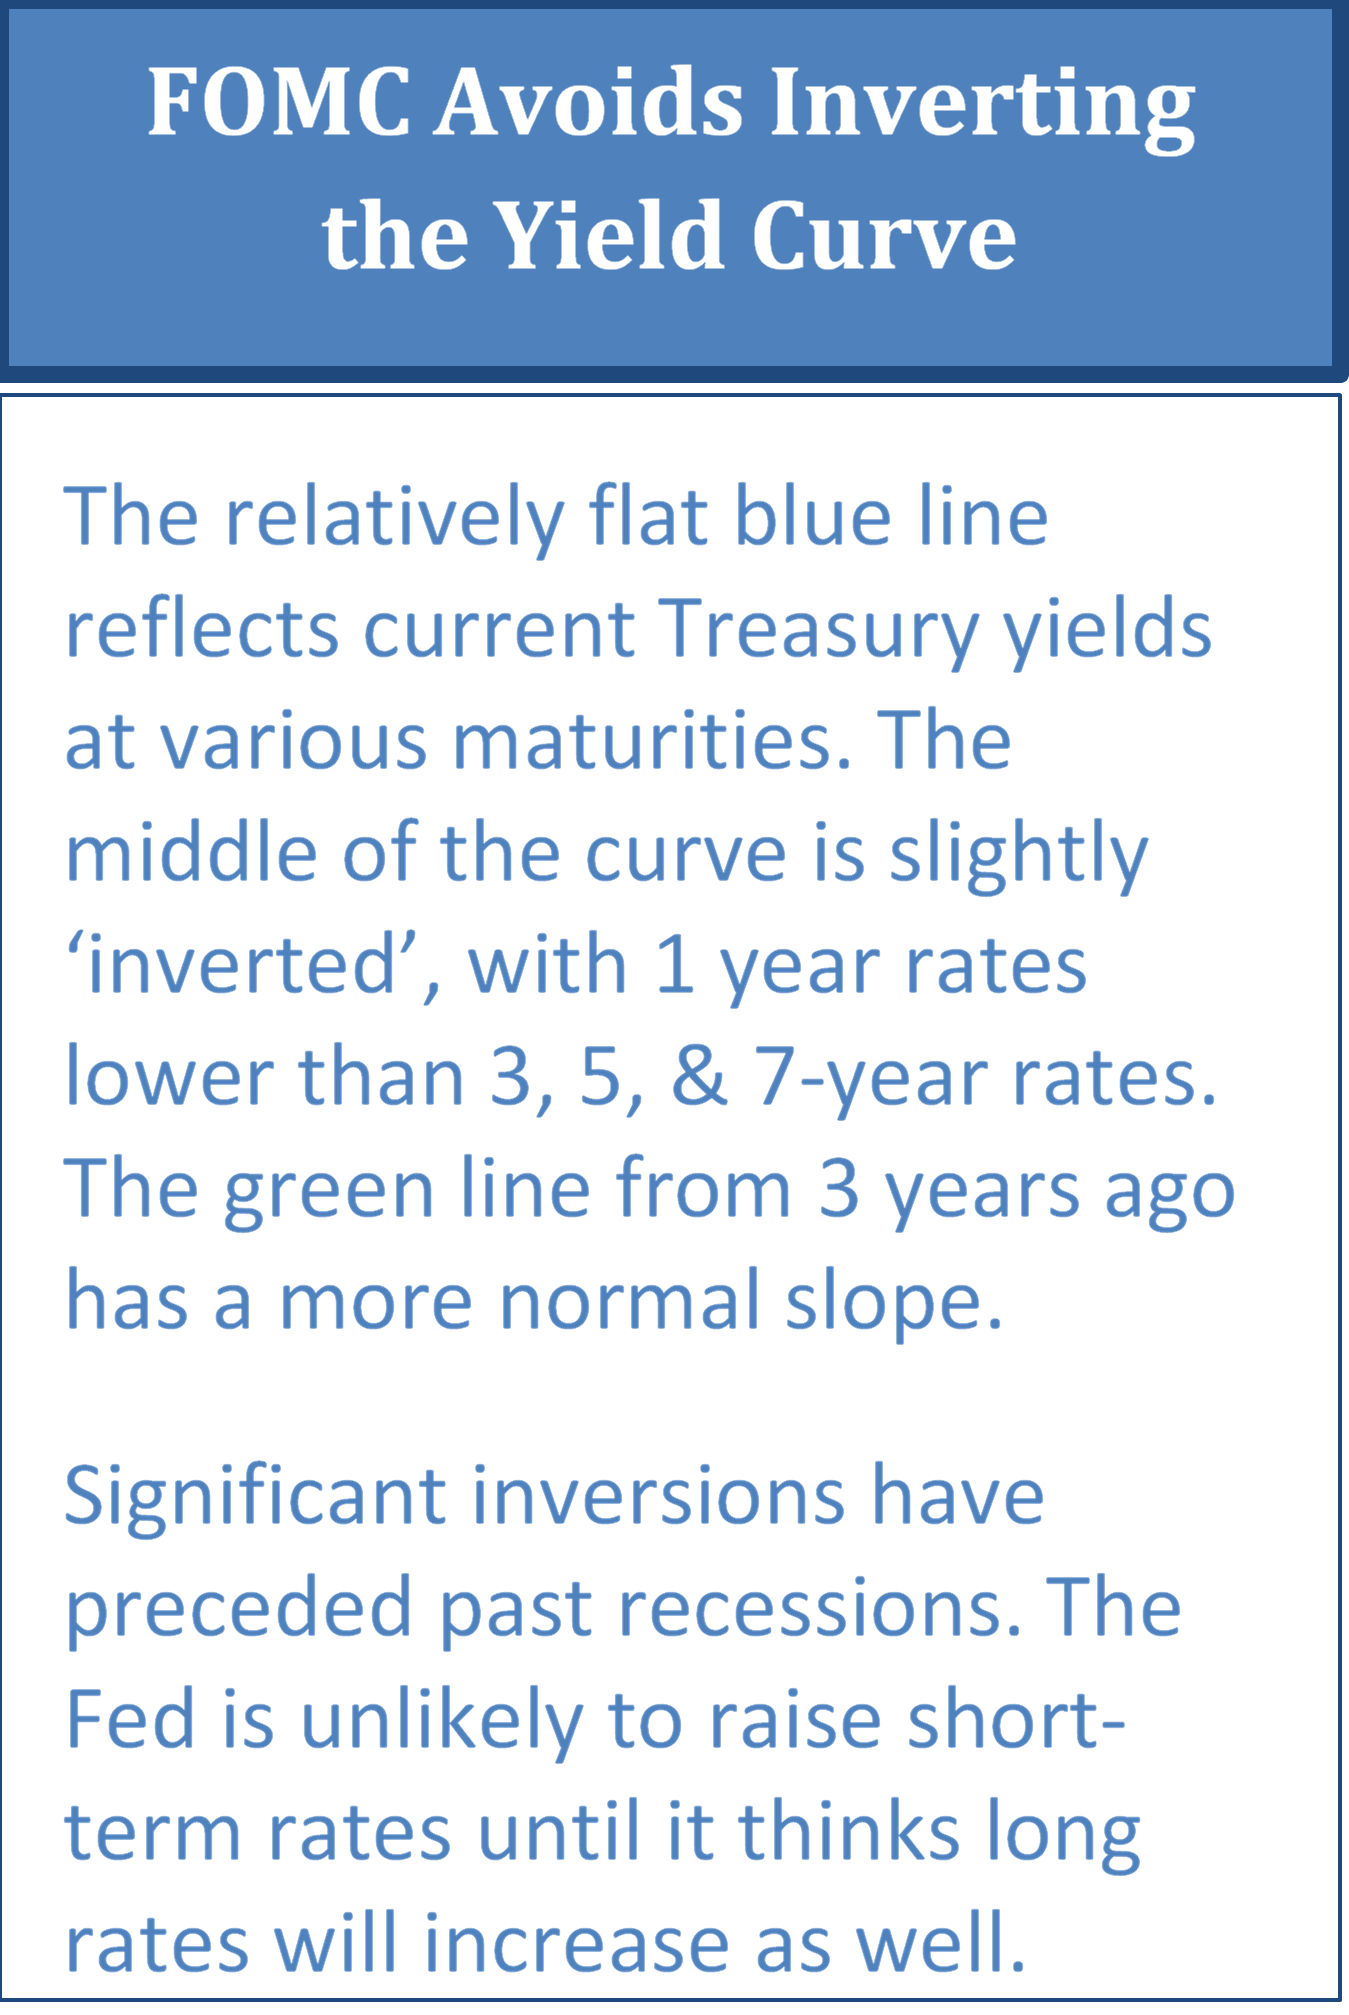
The Fed is also cautious about raising short-term rates too quickly and causing the Treasury yield curve to become ‘inverted’. An inverted yield curve is one where short-term interest rates are higher than longer term rates. This isn’t normal! Investors and lenders usually require higher rates to lock up their money for a longer period of time. An inverted curve is usually driven by…here’s that word again…Change.
The yield curve can invert under three basic scenarios:
- The Fed is aggressively increasing short-term interest rates to cool down an overheated economy
- Investors are demanding less return for longer maturities because they believe inflation, and consequently future interest rates, will be lower than they are currently
- Differing supply and demand pressures on the short and long portions of the yield curve, sometimes driven by interest rate differentials between the U.S. and other developed countries
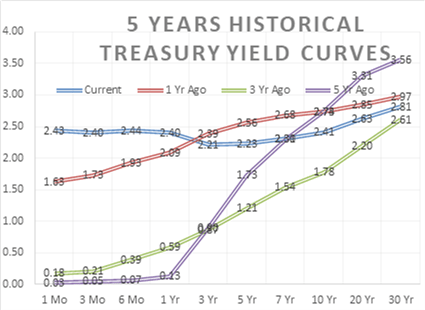
An inverted yield curve has preceded many recessions in the past few decades, which is why it makes people uncomfortable. But the inversion has happened as much as 2 years before the recession, so I’m not sure that the curve is actually predicting anything. It’s more helpful to analyze the economic situation driving the curve shape, rather than drawing conclusions from the curve alone. You might take comfort in knowing that post-inversion recessions have only happened when the 10-year Treasury yield was at least 0.50% below the Fed Funds rate, which we’re nowhere near. Right now my money is on Option #3 – a supply demand imbalance, not an imminent recession. Nonetheless, the current Treasury curve is slightly inverted between the 1 year and 5 year maturities and the Fed doesn’t want it to get worse and spook investors.
Source: Morningstar.com
It doesn’t make much sense for investors to be afraid of interest rates going up and also afraid of interest rates going down. But that seems to be the case at the moment and is a key driver of recent volatility in the U.S. stock market. Let’s be ‘data dependent’ for a minute and draw our own conclusions based on what we can see in the global economic landscape:
- The Fed is being cautious about raising or lowering interest rates because economic data doesn’t point strongly either up or down and they don’t want to spook the financial markets
- Though corporate earnings forecasts are lower than 2018, the majority of S&P 500 companies reporting slower earnings projections for the 1st quarter of 2019 have experienced positive stock price movement; S&P 500 gains year-to-date have been felt broadly across many sectors
- U.S. manufacturing output slipped to its lowest level in 2 years, despite trade tensions between the U.S. and China moderating somewhat rather than getting worse
- Challenges persist overseas, particularly in Europe, as trade tariffs hit European and Asian businesses harder than the U.S.; factory output in the Eurozone fell in March at the fastest pace in 6 years
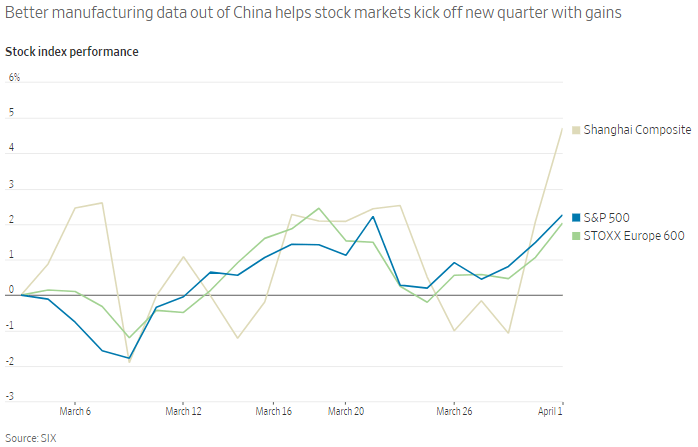
- Manufacturing data in China, the second largest economy in the world, was stronger than expected in March; the Chinese economy is expected to slow to a still robust 6% GDP growth in 2019 and beyond
- European markets are stabilizing as the U.K. Parliament seems to be making progress identifying a viable ‘Brexit’ strategy; economic disaster in Europe due to stalled trade with Britain seems unlikely
- Trade tariffs aside, improved labor conditions, lower headline inflation, and accommodative monetary policy should help support real income growth and household spending in most developed countries
- Emerging economies are avoiding much of the global slowdown as many smaller countries benefit from strong capital investment, improving income growth, and economic and political reforms in recent years

What conclusions can we draw from all this data?
The economic data is certainly mixed, but most indicators point to slower growth in 2019, not a recession. From what we can see today, global economies, and consequently financial markets, should stay in modestly positive territory for the near term. We can sleep well at night knowing the ship is headed in the right direction…for now.
ASSET CLASS and SECTOR RETURNS as of MARCH 2019
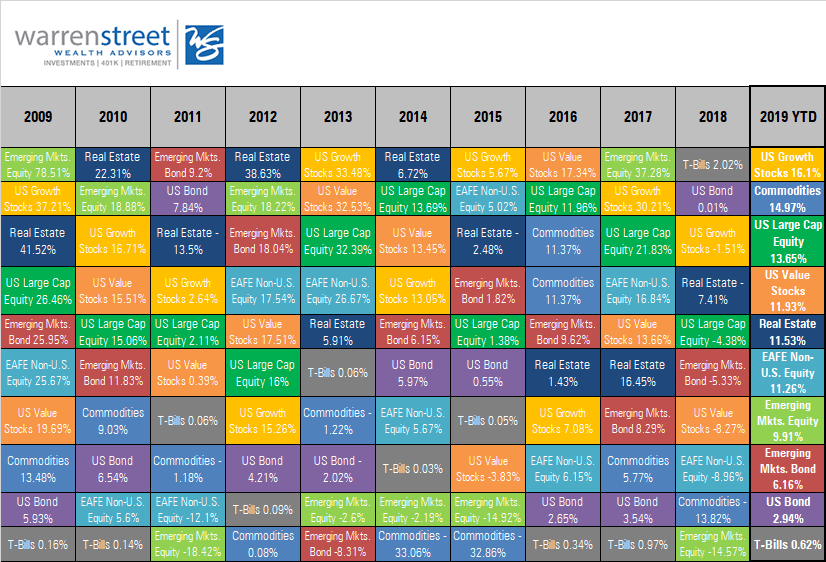
Source: Morningstar Direct

Source: S&P Dow Jones Indices
Marcia Clark, CFA, MBA
Senior Research Analyst
Warren Street Wealth Advisors
Warren Street Wealth Advisors, a Registered Investment Advisor. The information contained herein does not involve the rendering of personalized investment advice but is limited to the dissemination of general information. A professional advisor should be consulted before implementing any of the strategies or options presented. Any investments discussed carry unique risks and should be carefully considered and reviewed by you and your financial professional. Past performance may not be indicative of future results. All investment strategies have the potential for profit or loss.
DISCLOSURES
Investment Advisor Representative, Warren Street Wealth Advisors, LLC., a Registered Investment Advisor
The information presented here represents opinions and is not meant as personal or actionable advice to any individual, corporation, or other entity. Any investments discussed carry unique risks and should be carefully considered and reviewed by you and your financial professional. Nothing in this document is a solicitation to buy or sell any securities, or an attempt to furnish personal investment advice. Warren Street Wealth Advisors may own securities referenced in this document. Due to the static nature of content, securities held may change over time and current trades may be contrary to outdated publications.
Form ADV available upon request 714-876-6200


