Posts

Coronavirus: Here’s a Portfolio Treatment Plan

Wow! Our last published piece on the blog was “2019: A Year for the Record Books”. Two months later and the peace and quiet of yesteryear seem a distant memory. Scary days have arrived, thanks to the concern over how coronavirus might impact our global economy. As we draft this update, headlines are reporting the biggest weekly stock market losses since 2008.

We do not know whether the current correction will deepen or soon dissipate. It is important to remember that what was good advice in mild markets remains good advice today. Given the current climate, let’s take a look at a sound unemotional treatment plan for your nest-egg.

We continue to advise against panicked reactions to market conditions, or trying to predict an unknowable future. That being said, we are aggressively looking for ways to help our clients make lemonade out of this week’s lemons – such as through disciplined portfolio rebalancing and strategic tax loss harvesting. On Friday February 28th, we executed both on behalf of our private wealth clients.

Other lemonade ideas include refinancing your mortgage as interest rates have hit historic lows or executing a ROTH conversion while your portfolio is down, turning the recovery into tax free growth. More than anything, as you’ll see below, a long term perspective during an epidemic pays.

*First Trust

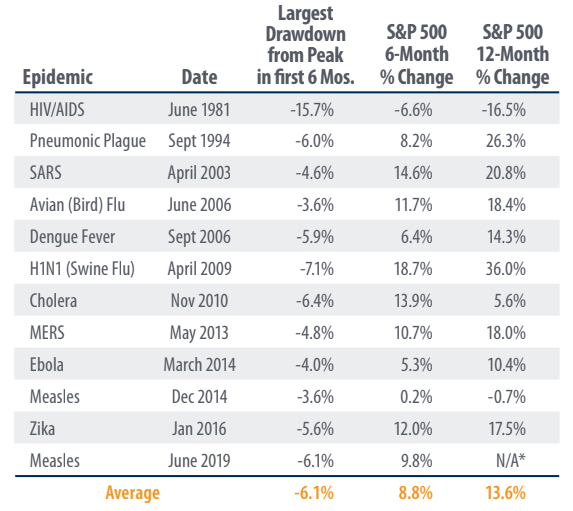
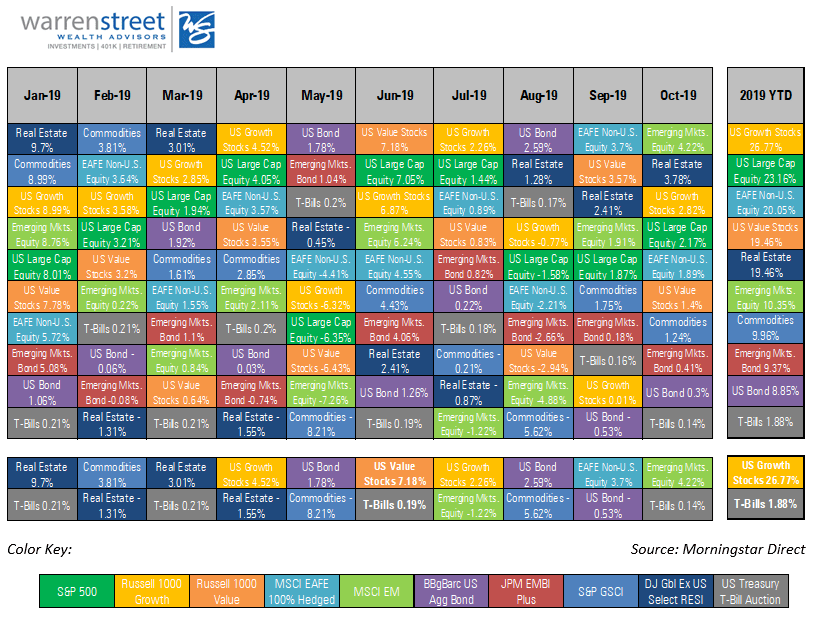
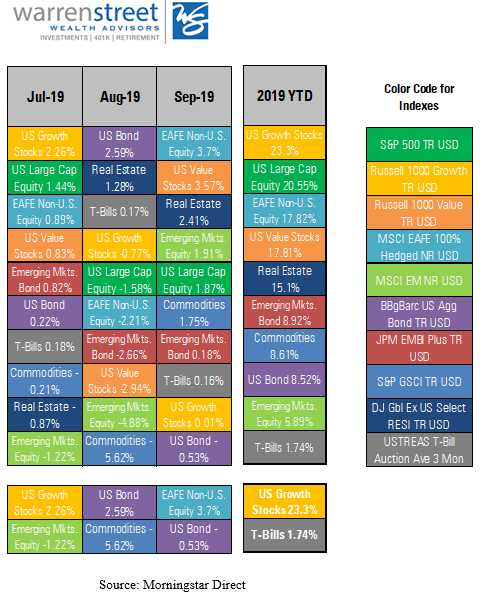
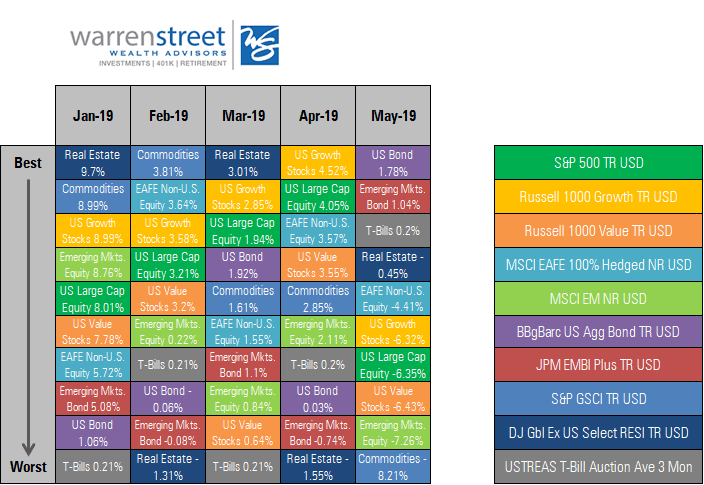
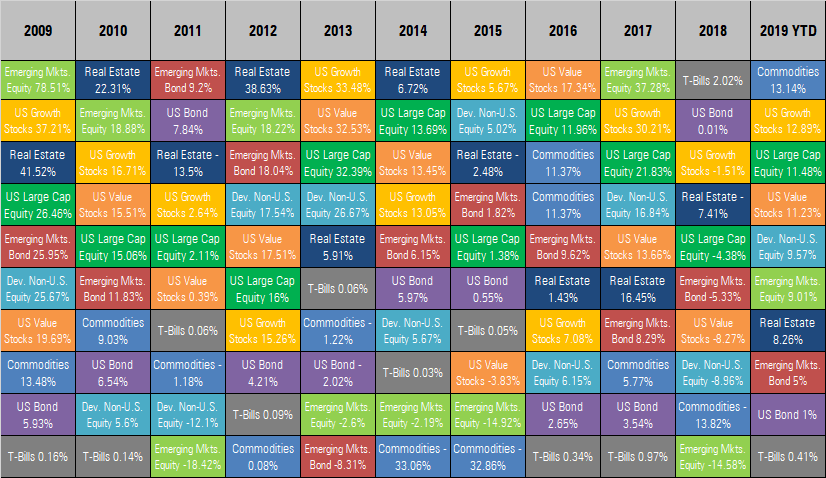
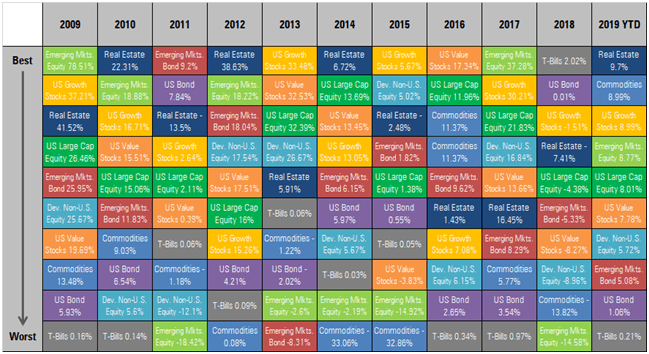
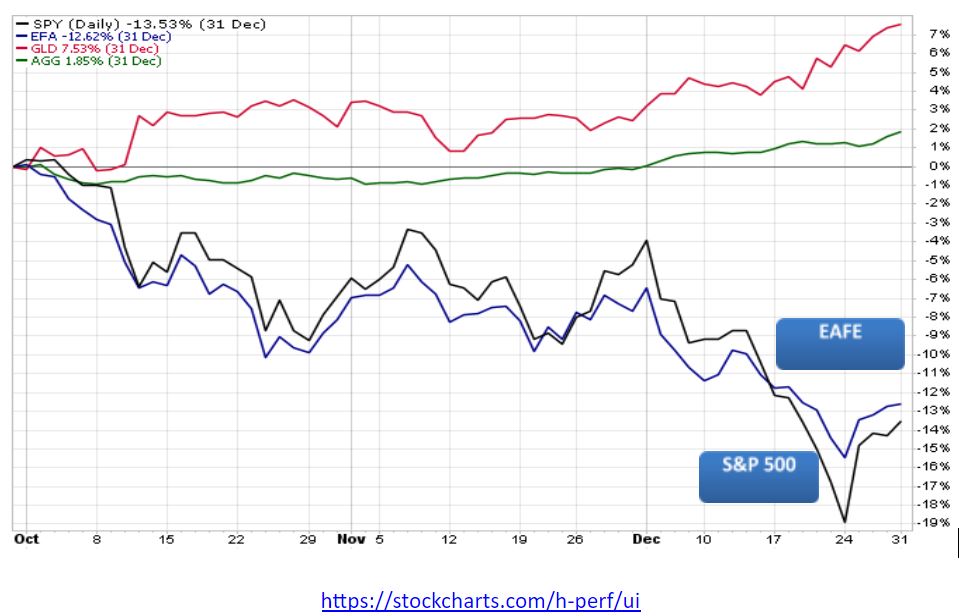
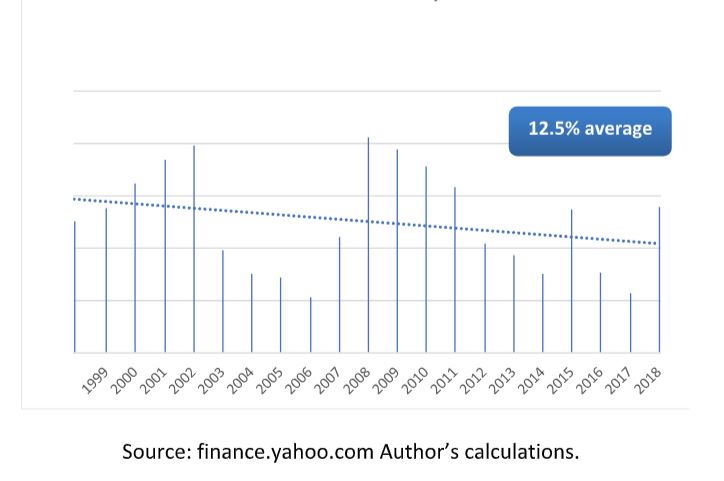
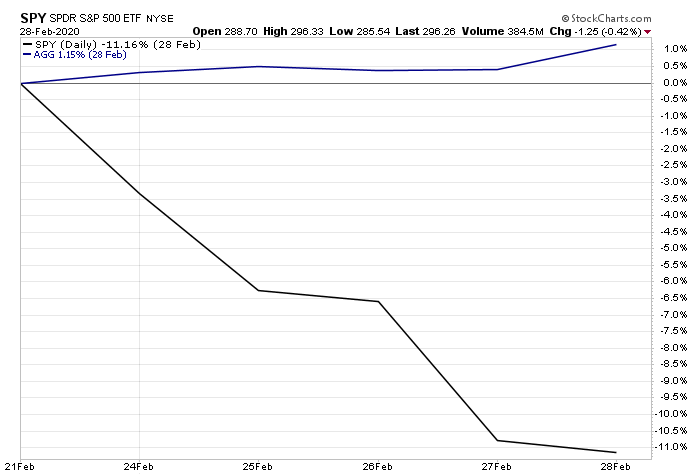
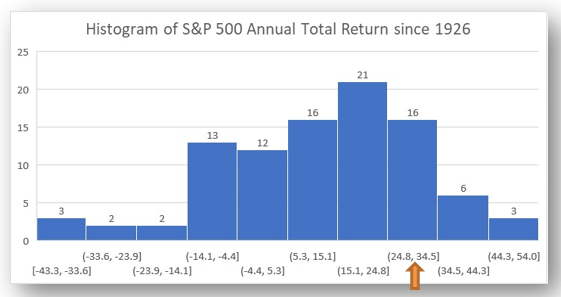
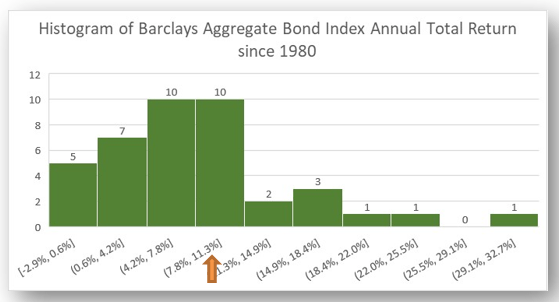
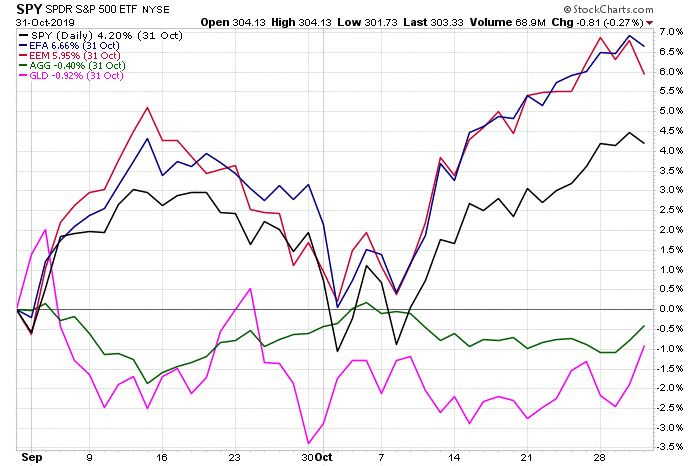
In 11 of the 12 cases above, the U.S. Stock Market was positive 6 months after an epidemic broke out, with an average return of 8.8%. In 9 of the 11 cases the U.S. Stock Market was positive 12 months after with an average return of 13.6%. It’s also important to note diversification worked last week with U.S. Bonds actually netting a positive return while U.S. stocks were down 11.5%.

@StockCharts – US Market represented by SPY. US Bonds by AGG.

If we can be of assistance or you want to talk through any of this, please do not hesitate to reach out to our team. In the meantime, here are 10 things you can do right now while markets are at least temporarily tanking.


1. Don’t panic (or pretend not to). It’s easy to believe you’re immune from panic when the financial sun is shining, but it’s hard to avoid indulging in it during a crisis. If you’re entertaining seemingly logical excuses to bail out during a steep or sustained market downturn, remember: It’s highly likely your behavioral biases are doing the talking. Even if you only pretend to be calm, that’s fine, as long as it prevents you from acting on your fears.

“Every time someone says, ‘There is a lot of cash on the sidelines,’ a tiny part of my soul dies. There are no sidelines.” – Cliff Asness, AQR Capital Management


2. Redirect your energy. No matter how logical it may be to sit on your hands during market downturns, your “fight or flight” instincts can trick you into acting anyway. Fortunately, there are productive moves you can make instead – such as all 10 actions here – to satisfy the itch to act without overhauling your investments at potentially the worst possible time.

“My advice to a prospective active do-it-yourself investor is to learn to golf. You’ll get a little exercise, some fresh air and time with your friends. Sure, green fees can be steep, but not as steep as the hit your portfolio will take if you become an active do-it-yourself investor.” – Terrance Odean, behavioral finance professor


3. Remember the evidence. One way to ignore your self-doubts during market crises is to heed what decades of practical and academic evidence have taught us about investing: Capital markets’ long-term trajectories have been upward. Thus, if you sell when markets are down, you’re far more likely to lock in permanent losses than come out ahead.

“Do the math. Expect catastrophes. Whatever happens, stay the course.” – William Bernstein, MD, PhD, financial theorist and neurologist


4. Manage your exposure to breaking news. There’s a difference between following current events versus fixating on them. In today’s multitasking, multimedia world, it’s easier than ever to be inundated by late-breaking news. When you become mired in the minutiae, it’s hard to retain your long-term perspective.

“Choosing what to ignore – turning off constant market updates, tuning out pundits purveying the latest Armageddon – is critical to maintaining a long-term focus.” – Jason Zweig, The Wall Street Journal


5. Revisit your carefully crafted investment plans (or make some). Even if you yearn to go by gut feel during a financial crisis, remember: You promised yourself you wouldn’t do that. When did you promise? When you planned your personalized investment portfolio, carefully allocated to various sources of expected returns, globally diversified to dampen the risks involved, and sensibly executed with low-cost funds managed in an evidence-based manner. What if you’ve not yet made these sorts of plans or established this kind of portfolio? Then these are actions we encourage you to take at your earliest convenience.

“Thus, the prudent strategy for investors is to act like a postage stamp. The lowly postage stamp does only one thing, but it does it exceedingly well – it adheres to its letter until it reaches its destination. Similarly, investors should adhere to their investment plan – asset allocation.” – Larry Swedroe, financial author


6. Reconsider your risk tolerance (but don’t act on it just yet). When you craft a personalized investment portfolio, you also commit to accepting a measure of market risk in exchange for those expected market returns. Unfortunately, during quiet times, it’s easy to overestimate how much risk you can stomach. If you discover you’re miserable to the point of breaking during even modest market declines, you may need to re-think your investment plans. Start planning for prudent portfolio adjustments, preferably working with an objective advisor to help you implement them judiciously over time. 

“Our aversion to leverage has dampened our returns over the years. But Charlie [Munger] and I sleep well. Both of us believe it is insane to risk what you have and need in order to obtain what you don’t need.” – Warren Buffett, Berkshire Hathaway


7. Double down on your risk exposure – if you’re able. If, on the other hand, you’ve got nerves of steel, market downturns can be opportunities to buy more of the depressed (low-price) holdings that fit into your investment plans. You can do this with new money, or by rebalancing what you’ve got (selling appreciated assets to buy the underdogs). This is not for the timid! You’re buying holdings other investors are fleeing in droves. But if can do this and hold tight, you’re especially well-positioned to make the most of the expected recovery.

“Pick your risk exposure, and then diversify the hell out of it.” – Eugene Fama, Nobel  laureate economist


8. Tax-loss harvest. Depending on market conditions and your own circumstances, you may be able to use tax-loss harvesting during market downturns. A successful tax-loss harvest lowers your tax bill without substantially altering or impacting your long-term investment outcomes. This action is not without its tricks and traps, however, so it’s best done in alliance with a financial professional who is well-versed in navigating the challenges involved.

“In investing, you get what you don’t pay for.” – John  C. Bogle, Vanguard founder


9, Revisit this article. There is no better time to re-read this article than when the going gets tough, when yesterday’s practice run is no longer an exercise but a real event. Maybe it will take your mind off the barrage of breaking news.

“We’d never buy a shirt for full price then be O.K. returning it in exchange for the sale price. ‘Scary’ markets convince people this unequal exchange makes sense.” – Carl Richards, Behavior Gap


10. Talk to us. We didn’t know when. We still don’t know how severe it will be, or how long it will last. But we do know markets inevitably tank now and then; we also fully expect they’ll eventually recover and continue upward. Since there’s never a bad time to receive good advice, we hope you’ll be in touch if we can help.

“In the old legend the wise men finally boiled down the history of mortal affairs into the single phrase, ‘This too will pass.’”
Benjamin Graham, economist, “father of value investing”


Blake Street, CFA, CFP ®
Founding Partner
Chief Investment Officer
Warren Street Wealth Advisors

Investment Advisor Representative, Warren Street Wealth Advisors, LLC., a Registered Investment Advisor

The information presented here represents opinions and is not meant as personal or actionable advice to any individual, corporation, or other entity. Any investments discussed carry unique risks and should be carefully considered and reviewed by you and your financial professional. Nothing in this document is a solicitation to buy or sell any securities, or an attempt to furnish personal investment advice. Warren Street Wealth Advisors may own securities referenced in this document. Due to the static nature of content, securities held may change over time and current trades may be contrary to outdated publications. Form ADV available upon request 714-876-6200.

2019: A Year for the Record Books

Key Takeaways

2019 turned out to be one of the best years for the financial markets in recent history. To understand how we got there, it’s helpful to consider where we began. Factset did a very good job of this on its website insight.factset.com: “As we began 2019, the big economic stories were the Fed’s series of interest rate hikes (four in 2018), the ongoing U.S. government shutdown, the December 2018 stock market drop (S&P 500: -9.2%, DJIA: -8.7%), and the escalating U.S.-China trade war. As the year progressed, we saw movement on all fronts.” The bullet points below provide a useful summary:

  • The Fed’s 2018 interest rate hikes were partially reversed as the FOMC cut rates three times in the second half of the year in reaction to a growing number of signals flashing recession.
  • The 35-day U.S. government shutdown, which ended on January 25, 2019, was the longest U.S. government shutdown in history. With many federal agencies closed and federal employees across the country furloughed or working without pay, the Congressional Budget Office estimates that the shutdown cost the economy $11 billion, $3 billion of which was permanently lost.
  • The ups and downs of U.S.-China trade negotiations sent global stock markets on a roller coaster ride throughout the year. As the year comes to a close, the U.S. has reached a so-called “Phase 1” trade agreement with China that reduces some of the tariffs imposed over the last 18 months and stops the imposition of a new set of tariffs set to go into effect on December 15. For its part, China has agreed to purchase more U.S. agricultural products. While the agreement helps to diffuse global anxiety surrounding the growing trade tensions, it fails to address significant concerns around technology and intellectual property rights. Still, equity markets have responded positively to the news, surging to new highs.

With this context in mind, how did the markets do in 2019?

Risk assets powered forward in December. After a rocky ride of positive and negative returns during the year, emerging markets stocks charged to the front of the pack in December. EM Equity crossed the finish line in the middle of the field with a return of 18.4%, about half the return of the winning asset class, U.S. Growth stocks (36.4%). U.S. Large Cap was 2nd at 31.5%, U.S. Value stocks came in 3rd at 26.5%, and International stocks were 4th at 24.63%. Though bonds trailed the field at 8.7%, this is more than twice the 10-year average for the Barclay’s Aggregate Bond Index, which was supercharged by falling Treasury yields as the Fed repeatedly lowered its short-term interest rate target.

The S&P500 total return for 2019 was the 18th best since 1926, 8th best since 1970, and 4th best since 1990[1]. The Barclays Aggregate bond index had its 13th best year since 1980[2].

What can we expect from the markets in 2020?

An era of the ‘haves’ and ‘have nots’. Technological innovations from industrial automation to ‘fracking’ to high speed data connections and the ‘internet of things’ has brought the world out of scarcity and into surplus. But this abundance is not felt by all – perhaps not even by most. Those with access to these technologies, either via infrastructure or financial resources, unlock a brave new world of possibilities. Those without such access are left behind. While wages generally have begun to increase, median incomes are not rising fast enough, causing the gap between economic winners and losers to widen. This situation has sparked political protests and dissatisfaction among working-class people around the world. Combined with the uncertain outcome of the presidential election in the U.S., never-ending Brexit negotiations in the U.K., and military conflicts and political posturing around the world, the global economy could stumble if government agents make a serious misstep.

Despite these risks, the IMF continues to forecast stronger global economies in 2020 and beyond. According to the latest update to the IMF World Economic Outlook[3], global growth is forecast to improve from 2.9% in 2019 to 3.3% in 2020 and 3.4% in 2021 due to easing trade tensions, strong labor markets and service sectors, and accommodative monetary policy. IMF economists also see welcome indications that the global slump in manufacturing and trade may have bottomed out.

This positive outlook is contingent on the recovery of less-developed countries currently dealing with stressed political and/or economic conditions: Argentina, Iran, Turkey, Brazil, India, and Mexico. Advanced economies such as Europe and the U.S. are likely to continue to grow less than 2% per year.

This outlook could change quickly if new trade tensions emerge or social unrest around the world intensifies. The IMF ‘vulnerabilities’ table below reports that the financial condition of sovereign nations is vulnerable to economic shocks. This vulnerability is due in part to a lack of room for fiscal or monetary agents to maneuver given high budget deficits and the very low level of government interest rates in many countries. Businesses and households in developed economies are generally solid, but households in emerging economies remain insecure.

Bottom line: Economic expansions don’t die of old age. U.S. and international economies successfully navigated a year full of social and political tensions and uncertainty, despite being in the late stage of a record-setting expansion. Low interest rates and muted inflation are enabling businesses and households to take on new ventures where they see a suitable potential reward. And unlike the expansion which preceded the financial crisis of 2008-2009, ‘asset bubbles’ and excessive risk-taking have been limited due to the many disruptions experienced during 2019 and the uncertain future outlook.

While risks to this outlook are clear and present, we are cautiously optimistic that policymakers and financial markets will continue to thread the needle between crisis and excess, and that 2020 will be a relatively peaceful and prosperous new year.

Marcia Clark, CFA, MBA

Senior Research Analyst, Warren Street Wealth Advisors

DISCLOSURES

Investment Advisor Representative, Warren Street Wealth Advisors, LLC., a Registered Investment Advisor

The information presented here represents opinions and is not meant as personal or actionable advice to any individual, corporation, or other entity. Any investments discussed carry unique risks and should be carefully considered and reviewed by you and your financial professional. Nothing in this document is a solicitation to buy or sell any securities, or an attempt to furnish personal investment advice. Warren Street Wealth Advisors may own securities referenced in this document. Due to the static nature of content, securities held may change over time and current trades may be contrary to outdated publications.

Form ADV available upon request 714-876-6200


[1] https://www.slickcharts.com/sp500/returns

[2] https://www.thebalance.com/stocks-and-bonds-calendar-year-performance-1980-2013-417028

[3] https://blogs.imf.org/2020/01/20/tentative-stabilization-sluggish-recovery/

‘Risk On’ trades take the lead in October

‘Risk On’ trades take the lead in October

Key Takeaways

  • U.S. growth stocks and emerging markets jump-started the 4th quarter with returns of 2.82% and 4.22% respectively as investors shifted away from ‘risk off’ assets such as defensive stocks and U.S. Treasury bonds
  • The FOMC dropped its federal funds interest rate target for the 3rd time in 2019 to 1.5% – 1.75%. Chairman Powell indicated this cut was the last of the ‘midcycle adjustments’, causing investors to speculate about a pause in rate changes for the next few FOMC meetings.
  • The U.S. and China made progress toward a trade resolution, though the pace and magnitude of the agreement is unclear. Global economies seem to be successfully navigating geopolitical tensions in Hong Kong, unrest in Chile, water wars in Egypt, and the never-ending Brexit saga, among others.
  • Conclusion: Barring a major geopolitical misstep, the U.S. stock market could end the year with a return in the top 25% since 1998. U.S. bonds may end with their best return since 2010.

Global stocks begin to close the gap with the U.S.

The 4th quarter is off to a great start! Despite a sharp decline the first few days of the month, global stock markets were very strong in October. Emerging Markets equity beat the S&P 500 for the second month in a row, up 4.22% versus 2.17%[1]. In typical ‘risk on’, ‘risk off’ fashion, bonds and gold lagged the field in October. Commodities stayed within sight of the leaders at +1.24% for the month, but U.S. and Emerging Markets bonds were far behind at +0.41% and +0.30%, respectively. For the year-to-date, Europe, Australasia, and Far East (EAFE) is picking up the pace with a return of 20.05% versus 23.16% for the S&P 500. The year-to-date leader as of October 31st is U.S. growth stocks at 26.77%.

https://stockcharts.com/h-perf/ui

This strong start to the 4th quarter can be attributed to progress with China/U.S. trade negotiations and no significant negative news about the other international worries facing the markets: Brexit, political uncertainty in the U.S. and overseas, tensions between Hong Kong and China, and soft business confidence around the world. If none of these go terribly wrong, 2019 is on track to be in the top 25% of S&P 500 stock market returns since 1988[2].

Amid this backdrop of relative stability, the Federal Open Market Committee (FOMC) lowered its short-term target interest rate for the third time in 2019 to a range of 1.5% to 1.75%[3]. Fed Chairman Jerome Powell stated that U.S. economic growth is steady despite continued weakness in business investment and exports, and core inflation is running below the Fed’s 2% target. The October rate cut was characterized as the final ‘midcycle adjustment’ to help support the maturing U.S. economic expansion. Chairman Powell indicated the FOMC will continue to monitor economic activity to determine the appropriate level of the federal funds rate going forward. His remarks did not include previous language about the Fed acting “as appropriate to sustain the expansion”, causing market watchers to expect a pause in rate changes going forward.

Source: BNP Paribas Asset Management, Bloomberg as of 11/4/2019

In the days following the rate cut, intermediate and longer-term Treasury yields rose, reversing the yield curve inversion seen for much of 2019 and signaling diminishing investor expectations for a near-term recession.

The return to an upwardly-sloping yield curve is a relief to market watchers. A healthy banking system requires short term rates to be lower than long term rates for banks to maintain consistent profit margins. Higher long-term yields encourage investors to take a longer-term perspective and make more strategic investments. Institutions such as pension plans also have a better chance of satisfying their obligations to future retirees. In general, financial markets do a much better job allocating capital when short-term interest rates are lower than long term rates.

Source: www.treasury.gov

Looking beyond Treasuries, corporate bond yield spreads have drifted back toward the extremely low levels seen in early 2018. This is another indication that investors are comfortable taking risk right now. At Warren Street Wealth Advisors, we’re watching for excessive risk taking which could mean an asset price ‘bubble’ and potentially the end of the stock and bond rally. The occasional drops in market prices we see from time to time are a healthy sign that investors are making rational decisions rather than reckless speculation.

Corporate bond risk premiums drift near historic lows

Let’s not forget the global economy, which the Fed has often mentioned as one reason for reducing interest rates this year. Though the data remains mixed, the International Monetary Fund is forecasting global GDP to close 2019 up 3%, with the U.S. at 1.7% and Emerging and Developing Economies up nearly 4%[4]. The IMF expects global growth to improve in 2020 to 3.4% as Europe adjusts to the new tariff landscape and political uncertainties diminish.

Global GDP projected to remain low but positive

A global recession is highly unlikely through the end of 2020 and probably longer, but there are significant risks to this outlook! The IMF is urging political leaders to defuse trade tensions and reinvigorate multilateral cooperation, rather than focus solely on accommodative monetary policy to keep the world economy afloat.

Bottom line: The U.S. economic expansion remains on track and should end the year well, barring significant missteps in the global economic and political landscape. Though it’s been a bumpy ride, investors are likely to close the books on 2019 with healthy profits from both stocks and bonds, and meaningful progress toward achieving their financial goals.

Marcia Clark, CFA, MBA

Senior Research Analyst, Warren Street Wealth Advisors


DISCLOSURES

Investment Advisor Representative, Warren Street Wealth Advisors, LLC., a Registered Investment Advisor

The information presented here represents opinions and is not meant as personal or actionable advice to any individual, corporation, or other entity. Any investments discussed carry unique risks and should be carefully considered and reviewed by you and your financial professional. Nothing in this document is a solicitation to buy or sell any securities, or an attempt to furnish personal investment advice. Warren Street Wealth Advisors may own securities referenced in this document. Due to the static nature of content, securities held may change over time and current trades may be contrary to outdated publications.

Form ADV available upon request 714-876-6200

Growth stocks take the lead year-to-date


[1] Performance represented by ETFs designed to track various market segments: SPY (S&P 500), AGG (Barclay’s Aggregate Bond index), EEM (emerging markets equity), EFA (developed international equity), GLD (gold prices)

[2] Source: www.stockcharts.com

[3] https://www.federalreserve.gov/monetarypolicy/files/monetary20191030a1.pdf

[4] https://www.imf.org/en/Publications/WEO/Issues/2019/10/01/world-economic-outlook-october-2019

September 2019 Market Review

With competing economic data, where should investors turn?

Oil shocks, impeachment, and Brexit – Oh My!

Key Takeaways

  • U.S. stock and bond markets closed the 3rd quarter with an impressive – though volatile – year-to-date return. The S&P 500 index ended September up nearly 19%, the best 3-quarter return since 1997, while the Barclays Aggregate Bond index posted an outstanding return near 8%.
  • Economic data remained mixed. The U.S. Consumer Confidence index fell by -9.1%, much more than expected, but unemployment fell to 3.5%, the lowest in 50 years.
  • The House of Representatives initiated an impeachment investigation of President Trump after a ‘whistleblower’ leaked information about the President asking Ukrainian officials to investigate Democratic candidate Joe Biden’s son.
  • Drone strikes on Saudi Arabian oil installations shut down 50% of Saudi oil production, about 5% of world production, briefly sending oil prices off the rails and adding to recession fears.
  • Prime Minister Boris Johnson was deemed to have acted illegally by shutting down the U.K. Parliament, putting pressure on him to come to a Brexit resolution with the European Union.
  • Conclusion: The U.S. economy remains on track for a good year. Despite the markets’ willingness to shrug off trade wars and geopolitical uncertainty, significant challenges are still out there. Investors should prepare  for renewed market turbulence as these issues resolve themselves over the coming months.

Stock and bond markets rebound from August’s slump

The 3rd quarter was quite a roller coaster ride! Gold and other ‘safe’ assets were the go-to market segments for the quarter. Gold led the way with a return of +4.26%[1], despite a slip in late September. U.S. bonds took second place, edging out U.S. stocks with a return of 2.34% versus 1.75%. International stocks were the top performers in September at +3.7%, but continued to lag the U.S. for the quarter at -0.79%. Emerging markets equities were in second place for the month at +1.91%, but are far behind for the year and quarter, losing -4.75% between July 1st and September 30th.

Market returns 7/1/2019 – 10/4/2019

https://stockcharts.com/h-perf/ui

The financial markets continued to react strongly to economic news and geopolitical events, though the magnitude of the swings began to subside. This moderation is a bit surprising given the unexpected -9% drop in Consumer Confidence and the Purchasing Manufacturers Index falling to its lowest level since June 2009. But investor fatigue is bound to set in sooner or later, and current events just seem to build on a base with which investors have become wearily familiar.

Source: https://ycharts.com/indicators/us_pmi

The economy created only 136,000 new jobs in September – certainly nothing to brag about, but good enough this late in the expansion. At the same time, the unemployment rate fell to 3.5% – the lowest in half a century – and the overall employment ratio increased to 61%, the highest since December 2008. Apparently, the U.S. job market is alive and well…at least for the time being.

Despite competing political and economic pressures, U.S. and developed international stock markets are on track for a very strong year. As of October 7, the S&P 500 was up more than 19%, gold was up over 16%, and the Europe, Australasia, and Far East index was up nearly 12%. But be wary of another 4th quarter slump like we saw in 2018! Given mixed economic data, the impeachment inquiry of President Trump, and continuing trade tensions, any of these could derail the markets – at least temporarily – between now and December 31st.

Market returns 1/1/2019 – 10/4/2019

https://stockcharts.com/h-perf/ui

One of the less-reported casualties in the U.S.-China trade war is the agricultural sector. Inflation-adjusted prices for corn, wheat, and soybeans have been declining for decades, largely due to increased productivity and reduced global population growth. Add trade tariffs and the wettest 12 months on record[3], and farmers are facing a ‘perfect storm’ of negative events. Smaller farms are going out of business, and the number of farms in the U.S. is heading below 2 million, the lowest in nearly a century.

But despite the significant challenges facing the agriculture and manufacturing sectors, the U.S. economy is holding steady. Personal income and consumer spending rose in August for the second month in a row. Retail sales were good, and housing showed signs of renewed activity.


As reported by the Wall Street Journal on September 25, U.S. home-price growth is slowing and mortgage rates are historically low at around 4%[4]. With such low interest rates, home price affordability remains within reach as indicated by the sharp drop in the Case-Shiller Home Price Index in 2019, shown on the chart above.

Forecasters expect housing to contribute slightly to GDP for the first time since 2017 as home sales and construction increased in August.

With so much going on in the world, it’s hard to know which direction to turn! For a straightforward summary of the likely impact of these competing economic factors on global growth, we refer you to the graphic below prepared by The Conference Board (publisher of the Leading Economic Indicator index.)

The Conference Board economic outlook

Bottom line: the U.S. economy is on track for solid growth in 2019, slowing somewhat thereafter. A recession is not in the forecast for the next 12 months, though demographic factors point to slower growth worldwide in the coming years.

Given the myriad challenges facing the global economy right now, negative surprises are definitely a possibility as we navigate the final quarter of 2019. Investors may just have to close their eyes, hold on tight to a prudent investment plan, and ride out the inevitable turbulence in the coming months.

Marcia Clark, CFA, MBA

Senior Research Analyst, Warren Street Wealth Advisors


DISCLOSURES

Investment Advisor Representative, Warren Street Wealth Advisors, LLC., a Registered Investment Advisor

The information presented here represents opinions and is not meant as personal or actionable advice to any individual, corporation, or other entity. Any investments discussed carry unique risks and should be carefully considered and reviewed by you and your financial professional. Nothing in this document is a solicitation to buy or sell any securities, or an attempt to furnish personal investment advice. Warren Street Wealth Advisors may own securities referenced in this document. Due to the static nature of content, securities held may change over time and current trades may be contrary to outdated publications.

Form ADV available upon request 714-876-6200

[1] Performance represented by ETFs designed to track various market segments: SPY (S&P 500), AGG (Barclay’s Aggregate Bond index), EEM (emerging markets equity), EFA (developed international equity), GLD (gold prices)

[2] Performance represented by ETFs designed to track various market segments: SPY (S&P 500), AGG (Barclay’s Aggregate Bond index), EEM (emerging markets equity), EFA (developed international equity), GLD (gold prices)

[3] https://www.wsj.com/graphics/us-farmers-miserable-year/?mod=article_inline&mod=hp_lead_pos5

[4] https://blogs.wsj.com/economics/2019/09/25/newsletter-housings-maybe-rebound-chinas-decoupling-warning-and-consumers-cloudy-crystal-ball/?guid=BL-REB-39607&dsk=y

April showers bring May flowers?…or thunderstorms??

Key Takeaways

  • The stock market stumbled in May after strong performance in April. The decline was likely due to concerns over the impact of proposed tariffs on Mexican goods, especially given that Chinese trade negotiations are still unresolved.
  • Treasury yields hit new lows in May as investors fled stock market volatility. However, a 10-year Treasury yield of 2.1% is not sustainable when inflation is hovering around the same level. We expect Treasury rates to increase rather than decrease from here.
  • Futures contracts indicate an 80% chance of the FOMC decreasing interest rates in July. This expectation is not supported by the economic data nor the plentiful level of liquidity already in the system. Futures investors are inferring more into dovish Fed comments than they should.
  • Despite pockets of weakness, the U.S. economy is still on track to grow by about 2% in 2019.
  • Conclusion: Stock market recoveries based on expectations of falling interest rates are vulnerable to ‘headline risk’, but the underlying economic fundamentals remain modestly positive.


When 1st quarter GDP came in at 3.2% many commentators expected an adjustment downward. That revision came in May…to 3.1%

1st quarter GDP adjusted by a scant -0.1%

Despite persistent pessimism about the imminent demise of the U.S. economy, we at Warren Street Wealth stand by our assessment that the economy will continue to grow at a modestly positive pace. Even with the drag on growth from increasing trade tariffs, the International Monetary Fund forecasts U.S. GDP to end 2019 at 2.3%, which is about average for the past few years.

We should be ready for a bumpy ride along the way, however! With global growth clearly slowing – Eurozone GDP is forecast to be only 1.3% this year and China is slowing to about 6.3% – major factors such as oil prices and other commodities are struggling to find a new equilibrium between global supply and demand.

Some market watchers see falling oil prices as a sign of recession, but we believe the energy market will find the proper balance once the long-term impact of current geopolitical tensions is better understood.

Oil prices add to market volatility


Though consumer spending was down in April, spending was strong in March. April’s decline is most likely due to consumers taking a breath after enjoying some extra purchases in March when wages began rising, rather than the beginning of a downward trend.

And don’t overlook the increase in disposal income in April. It isn’t huge, only +0.1%, but to quote one of our clients: “up is up, and up feels good!”

Consumer spending takes a breath after spiking in April


Another area which disappointed investors in May was job growth, which came in much lower than expected at +75,000. The unemployment rate remained steady at 3.6%, however.

Job growth slows, but is still trending higher


So is the economic glass half full or half empty? We’re going with half full. Patient investors who can withstand the market zigging and zagging based on startling headlines or surprising Twitter posts should be OK in the end.


If consumers are still buying and people are still working, where is the real pain in the economy?

Businesses who rely on global trade, either for inputs into their manufacturing process or to sell their finished goods, are feeling the pinch of rising tariffs. Manufacturers who need raw materials such as steel and aluminum are paying higher prices. Farmers growing soy beans and corn can barely make enough money to cover their expenses as the price of labor and farm equipment goes up while demand for their crops goes down.

As reported in the Wall Street Journal, manufacturers in the U.S. and China are still in growth territory with the Purchasing Managers Index slightly above 50, but Europe is clearly struggling.

We’re keeping a close eye on international markets in case weakness there begins to put more pressure on the U.S. economy.

European manufacturing dips into recession


The final factor we’re watching is the level of interest rates.

Without getting into a debate about whether the current inversion of short-term Treasury rates is forecasting a recession or not – see ‘A Few Minutes with Marcia’ video on inverted yield curves – 10-year Treasury rates at around 2.1% are simply not sustainable.

Negative interest rates in other developed countries and instability in our own stock market have led to high demand for ‘safe’ assets. But with Treasury yields barely keeping up with inflation, at some point U.S. investors will be forced to look elsewhere to preserve purchasing power.

When they do, selling pressure will push Treasury prices down and yields up.

2 yr. and 10 yr. Treasury rates hover near inflation


Because of mixed economic data and a slightly inverted yield curve, pessimists are expressing their opinion through Federal Funds futures contracts. 

As reported by the Chicago Mercantile Exchange ‘Countdown to FOMC’, as of June 10 over 80% of futures contracts were betting on the Fed decreasing short-term rates when the FOMC meets in July. We don’t agree.

Despite Fed chairman Jerome Powell’s accommodating tone in recent weeks, there is already more than enough liquidity in the financial system to support growth. A decrease in rates would just put upward pressure on inflation, potentially above the Fed’s target rate of 2%.

Fed Funds futures investors bet on falling rates


If we’re correct and the Fed does not decrease rates in July, we may see another dip in the stock market as investors re-calibrate their expectations. For now, just hold tight, watch the data, and wait for spring rains to bring summer sunshine…eventually…

Marcia Clark, CFA, MBA

Senior Research Analyst, Warren Street Wealth Advisors


DISCLOSURES

Investment Advisor Representative, Warren Street Wealth Advisors, LLC., a Registered Investment Advisor

The information presented here represents opinions and is not meant as personal or actionable advice to any individual, corporation, or other entity. Any investments discussed carry unique risks and should be carefully considered and reviewed by you and your financial professional. Nothing in this document is a solicitation to buy or sell any securities, or an attempt to furnish personal investment advice. Warren Street Wealth Advisors may own securities referenced in this document. Due to the static nature of content, securities held may change over time and current trades may be contrary to outdated publications.

Form ADV available upon request 714-876-6200

March 2019 Market Commentary

Key Takeaways

    • The rally in U.S. stocks slowed in March but still posted the best 1st quarter in recent memory at 13.65%, though stock markets remain volatile as investors seem to overreact to fears of the Fed increasing interest rates too much or not increasing rates at all
    • A slightly better-than-expected jobs report for March helped calm fears about mixed economic data in the U.S., supporting the Fed’s decision to keep short-term interest rates low for the foreseeable future
    • The OECD lowered its forecast for European GDP growth to a paltry 1.0% in 2019 and 1.2% in 2020; German government bonds fell into negative territory after the ECB reported weak manufacturing data
    • Overall, improved labor conditions, lower headline inflation, and accommodative monetary policy should help support real income growth and household spending in most developed countries


  • Conclusion: Recent market swings seem driven more by fear than by fundamentals. Economic data isn’t great, but the data doesn’t support a forecast for a global recession; U.S. markets are likely to hang on to gains until or unless weakness in the economy becomes more clear.


Is the U.S. economy getting better? Or getting worse?

The S&P 500 had its best 1st quarter return in recent memory, yet the Federal Reserve Bank kept interest rates low to avoid derailing the economy. Which of these forward-looking indicators is correct? To answer this question, let’s start at the beginning. You may have learned in school that GDP – the primary measure of economic strength – is simply the value of all goods and services sold in a country over a given period of time. In essence, GDP represents the value of business transactions. These transactions flow into company financial statements and impact the ability of these companies to pay dividends or launch new ventures. This increased cash flow is recognized by investors, who become willing to pay more for shares of those businesses in the stock market, pushing stock prices up. If the economy is up, stock prices are up too.

Easy, right? All the dominoes line up and we understand how the market works…or maybe not?

Here is the conundrum: stock prices are a ‘leading economic indicator’ because investors buy today expecting gains in the future. Interest rates are also leading indicators because investors need to forecast future interest rates – which typically move up and down with economic activity – before they’re willing to tie up their money for 10 or 20 years. Stock and bond prices don’t usually go up together.

Source: https://www.pimco.com/en-us/resources/education/everything-you-need-to-know-about-bonds

If interest rates go up, prices of existing fixed-rate bonds go down in order to compete with new bonds issued with higher coupon (interest) rates. But rising interest rates usually indicate more demand for funds, which is often associated with a strong economy, which means more profits, and consequently higher stock prices.

The upshot of all this is when stock prices go up, bond prices are usually flat or negative. Conversely, when stock prices go down, bond prices are usually positive as investors sell volatile stocks and seek safer assets such as government bonds.

Source: https://stockcharts.com/h-perf/ui

As you can see from the chart above, bond prices as represented by the long-term Treasury ETF (ticker ‘TLT’ – blue line) usually go up when stock prices go down (represented by the Dow Jones Industrial Average – black line), and vice versa. This effect was particularly dramatic during the 4th quarter of 2018.

Despite the strong start for stocks in 2019, if you look back 6-months from October to March, bonds have been among the best performing asset classes. Bonds may not be sexy, but they sure are welcome when markets get rough! But wait – look at the red box in February and March. Bond and stock prices are moving together. Why??

The charts below from the Bureau of Economic Analysis may hold some of the answers. In a nutshell, the problem is Change. And I don’t mean the kind of change you find in your sofa cushions…

Chart 1: The U.S. economy is growing, but slower than in recent quarters.


Consumer spending takes a breath after spiking in April

Chart 2: Disposable income is increasing, but consumer spending is down.

Chart 3: Companies are adding value to GDP, but at a slower pace than previously.

The economic data is okay, but clearly slowing from the strong levels of 2017-2018. Does ‘slowing’ economic activity mean a recession is around the corner? I don’t think so, and many commentators are coming around to this view. What’s really moving the market, then? In addition to economic fundamentals, the stock market seems to be overreacting to the possibility of interest rates going up…or going down. Does being afraid of both situations make any sense? Probably not.

If the Fed increases rates too aggressively, they could indeed stall the economy. But we should take comfort in the persistent ‘data dependent’ stance of the Fed. They have no intention of being aggressive with interest rate hikes, so the stock market should probably find something else to worry about. In fact, institutional investors seem to agree that short-term rates are going nowhere any time soon. Federal Funds futures contracts are predicting the Fed will decrease rates by the end of 2019, though the Fed’s own ‘dot plot’ shows a possibility of one rate increase by the end of the year.

Source: https://www.cmegroup.com/trading/interest-rates/countdown-to-fomc.html

Source: https://www.federalreserve.gov/monetarypolicy/files/fomcprojtabl20190320.pdf

The Fed is also cautious about raising short-term rates too quickly and causing the Treasury yield curve to become ‘inverted’. An inverted yield curve is one where short-term interest rates are higher than longer term rates. This isn’t normal! Investors and lenders usually require higher rates to lock up their money for a longer period of time. An inverted curve is usually driven by…here’s that word again…Change.

The yield curve can invert under three basic scenarios:


  • The Fed is aggressively increasing short-term interest rates to cool down an overheated economy


  • Investors are demanding less return for longer maturities because they believe inflation, and consequently future interest rates, will be lower than they are currently


  • Differing supply and demand pressures on the short and long portions of the yield curve, sometimes driven by interest rate differentials between the U.S. and other developed countries


An inverted yield curve has preceded many recessions in the past few decades, which is why it makes people uncomfortable. But the inversion has happened as much as 2 years before the recession, so I’m not sure that the curve is actually predicting anything. It’s more helpful to analyze the economic situation driving the curve shape, rather than drawing conclusions from the curve alone. You might take comfort in knowing that post-inversion recessions have only happened when the 10-year Treasury yield was at least 0.50% below the Fed Funds rate, which we’re nowhere near. Right now my money is on Option #3 – a supply demand imbalance, not an imminent recession. Nonetheless, the current Treasury curve is slightly inverted between the 1 year and 5 year maturities and the Fed doesn’t want it to get worse and spook investors.

Source: Morningstar.com

It doesn’t make much sense for investors to be afraid of interest rates going up and also afraid of interest rates going down. But that seems to be the case at the moment and is a key driver of recent volatility in the U.S. stock market. Let’s be ‘data dependent’ for a minute and draw our own conclusions based on what we can see in the global economic landscape:

  1. The Fed is being cautious about raising or lowering interest rates because economic data doesn’t point strongly either up or down and they don’t want to spook the financial markets
  2. Though corporate earnings forecasts are lower than 2018, the majority of S&P 500 companies reporting slower earnings projections for the 1st quarter of 2019 have experienced positive stock price movement; S&P 500 gains year-to-date have been felt broadly across many sectors
  3. U.S. manufacturing output slipped to its lowest level in 2 years, despite trade tensions between the U.S. and China moderating somewhat rather than getting worse
  4. Challenges persist overseas, particularly in Europe, as trade tariffs hit European and Asian businesses harder than the U.S.; factory output in the Eurozone fell in March at the fastest pace in 6 years
  5. Manufacturing data in China, the second largest economy in the world, was stronger than expected in March; the Chinese economy is expected to slow to a still robust 6% GDP growth in 2019 and beyond
  6. European markets are stabilizing as the U.K. Parliament seems to be making progress identifying a viable ‘Brexit’ strategy; economic disaster in Europe due to stalled trade with Britain seems unlikely
  7. Trade tariffs aside, improved labor conditions, lower headline inflation, and accommodative monetary policy should help support real income growth and household spending in most developed countries
  8. Emerging economies are avoiding much of the global slowdown as many smaller countries benefit from strong capital investment, improving income growth, and economic and political reforms in recent years

What conclusions can we draw from all this data?

The economic data is certainly mixed, but most indicators point to slower growth in 2019, not a recession. From what we can see today, global economies, and consequently financial markets, should stay in modestly positive territory for the near term. We can sleep well at night knowing the ship is headed in the right direction…for now.


ASSET CLASS and SECTOR RETURNS as of MARCH 2019

Source: Morningstar Direct

Source: S&P Dow Jones Indices

Marcia Clark, CFA, MBA
Senior Research Analyst
Warren Street Wealth Advisors

Warren Street Wealth Advisors, a Registered Investment Advisor. The information contained herein does not involve the rendering of personalized investment advice but is limited to the dissemination of general information. A professional advisor should be consulted before implementing any of the strategies or options presented. Any investments discussed carry unique risks and should be carefully considered and reviewed by you and your financial professional. Past performance may not be indicative of future results. All investment strategies have the potential for profit or loss. 

DISCLOSURES

Investment Advisor Representative, Warren Street Wealth Advisors, LLC., a Registered Investment Advisor


The information presented here represents opinions and is not meant as personal or actionable advice to any individual, corporation, or other entity. Any investments discussed carry unique risks and should be carefully considered and reviewed by you and your financial professional. Nothing in this document is a solicitation to buy or sell any securities, or an attempt to furnish personal investment advice. Warren Street Wealth Advisors may own securities referenced in this document. Due to the static nature of content, securities held may change over time and current trades may be contrary to outdated publications.

Form ADV available upon request 714-876-6200


2019 Started with a Roar!

WSWA Monthly Market Commentary for February 2019

Key Takeaways

    • Commodities took the lead in February with a year-to-date return of 13.14% as oil prices recovered from the supply/demand imbalance during the second half of 2018
    • The S&P 500 index is on pace for its biggest early-year advance in nearly 30 years, due in part to diminished investor fears about the impact of trade tensions and slowing pace of interest rate hikes
    • Forward-looking economic data is mixed: S&P 500 companies expect earnings growth to slow, but the Conference Board’s Leading Economic Indicators remain strong
    • Overseas tensions continue as the U.K. has yet to approve a ‘Brexit’ plan, trade tariffs put pressure on global economic growth, and high levels of public and private debt reduces central bank flexibility
    • Conclusion: Global economies are slowing but unlikely to enter a recession in 2019, providing support for U.S. financial markets. Market performance around the world is likely to be positive though with mixed results across developed and emerging economies.

Energy takes the lead with an impressive year-to-date return over 23%.

2019 started with a roar as commodities streaked off the starting line, gaining 13.14% in January and February (combined). The biggest winner was the Energy sector leaving everything else in the dust with an impressive 23.48% return. The rebound in oil prices was fueled in part by ongoing supply reductions by OPEC and diminishing trade tensions between the U.S. and China. Going forward, U.S. shale oil production capacity should keep a lid on oil prices despite efforts by OPEC countries to keep prices higher.

wti

Source: www.cnbc.com

1. https://us.spindices.com/performance-overview/commodities/sp-gsci
2. Source: Morningstar Energy sector analyst report

Global stocks were not left in the dust.

Despite the recent downturn, the S&P 500 is on pace for its strongest start in recent memory. This impressive performance was felt broadly across market sectors, led by Industrial companies and followed closely by Energy, Technology, and Consumer Discretionary firms.

Global stocks

Thankfully, U.S. stock market volatility as measured by the Chicago Board Options Exchange Volatility Index (VIX) calmed down from the frantic pace of the 4th quarter, perhaps due to investor fatigue as much as anything else. In truth, news has indeed gotten better: the FOMC indicated it would remain patient with the pace of normalizing interest rates; trade negotiations with China are progressing toward a workable conclusion; and corporate earnings for the 4th quarter are coming in better than investors feared.

vix

Source: www.bloomberg.com

3. https://www.wsj.com/articles/history-shows-stock-rally-could-have-more-legs-11550840401

International stocks are also benefiting from economic and political tailwinds, pulling slightly ahead of the U.S. in February with a return of 3.58% versus 3.21% for the S&P 500. The U.S. remains in the lead year-to-date: +11.48% compared to +9.57% for the developed markets equity index (MSCI ACWI.) Emerging Markets stocks are solidly in the middle of the pack at 0.22% in February and 9.01% year-to-date. U.S. bonds lagged the field with a negative return of -0.06% in February and 1.0% year-to-date, despite over $25 billion of inflows from mutual fund investors fleeing the stock market volatility of the 4th quarter 2018.

Asset Class Winners and Losers as of February 2019

Asset Class Winners and Losers as of February 2019

Source: Morningstar Direct

4. Source: Morningstar Direct
5. https://ici.org/research/stats/flows

With such a great start to the year, you might be wondering “where do we go from here?”

As reported in the Wall Street Journal and calculated by Dow Jones Market Data, the U.S. stock market continues in the same direction it started 64% of the time. Whether this relationship will apply in 2019 depends to some degree on the cause of the strong start. Given the sharp sell-off in the 4th quarter of 2018, some of the rally in early 2019 is likely attributed to stock prices finding a more rational foundation after being oversold, with the remainder based on fundamental factors outlined above. These aren’t powerful reasons for the rally to continue the rest of the year, but no reason to decline either.

It is encouraging to see Industrials leading the way rather than Technology, as the returns of industrial companies tend to be more closely tied to longer term economic trends. The breadth of the rally is also hopeful, as the number of stocks rising versus falling each day hit new highs in February.

Another bright spot is the Conference Board’s ‘Leading Economic Indicators’ index which remains strong despite declining a bit in January.

conference board

6. Source: Dow Jones Market Data

What could go wrong?

On the less optimistic side of the equation, most S&P 500 companies are forecasting earnings growth to slow in 2019. Overseas, economic tensions persist as the U.K. has yet to come up with a ‘Brexit’ deal acceptable to both the European Union and the British Parliament, and trade tariffs are hitting European automakers particularly hard. Add to this the worrisome growth of debt among many public and private entities worldwide, including the U.S. government, leaving central banks with less flexibility if the global economy stumbles.

The International Monetary Fund recently published an eye-opening study about the amount of debt accumulated around the world. (see chart below) The large light blue circle in the ‘Advanced Economies’ section at the top of the chart represents U.S. public and private debt at 256% of GDP. Japan is the green circle at the top right with nearly 400% debt to GDP(!), and Germany is the medium blue circle at the top left with 171% debt.

The dark blue circle in the middle ‘Emerging Markets’ section represents the debt load of mainland China at 254%. The lower section reflects ‘Low Income’ countries including Bangladesh, the light blue circle in the middle with 76% debt, and Vietnam in dark blue at the far right of this group with 189% debt to GDP.

Global Public and Private Debt as a Percent of GDP

Global Public and Private Debt as a Percent of GDP

7. https://blogs.imf.org/2019/01/02/new-data-on-global-debt/

Is all this debt a problem, especially for the U.S. government with over $22 trillion debt outstanding?

You might be comforted to know that though the U.S. government debt load is growing ever higher – due in some part to the ever-expanding U.S. economy – the interest servicing cost is only 1 ½% of GDP, compared to about 3% of GDP in the much higher interest rate environment of the 1980s and 1990s.

 interest rate

Source: www.treasurydirect.gov

As long as government borrowing and spending doesn’t ‘crowd out’ the private sector capacity to lend and spend, the debt shouldn’t be a problem. However, if government debt becomes so large that the government’s need to borrow pushes up interest rates for the rest of us, the economy could slow, kicking off a vicious cycle of unsustainable borrowing to keep the economy afloat. But there’s no need to panic just yet! Government debt is nowhere near the danger level and is unlikely to get there any time soon.

How do we weigh the positive and negative economic data?

Based on the available information, it’s hard to say whether 2019 will be an outstanding year for financial assets, below average, or somewhere in between. The International Monetary Fund is forecasting an economic slowdown – not a recession – across most developed markets in 2019 and 2020 (including Europe and the U.S.)

Growth Projections

On balance, there is enough positive data to support the case that a recession is not on the horizon. This outlook is becoming more widely held, which should enable the financial markets to hold their position and cross the finish line in positive territory by the end of 2019.

As always, the investment team at Warren Street Wealth Advisors will keep a sharp lookout for confirming or contrary evidence as the year unfolds, and will base our investment decisions on the best information we can find. While the future remains unclear, we promise to keep you informed as we journey forward.

8. https://www.treasurydirect.gov/NP/debt/current
9.https://www.ftportfolios.com/Commentary/EconomicResearch/2019/2/22/debt,-the-economy-and-stocks
10. https://www.investopedia.com/terms/c/crowdingouteffect.asp

Quiz:

Referring to the IMF ‘Debt Around the World’ blog post at https://blogs.imf.org/2019/01/02/new-data-on-global-debt/, which of the following countries has the largest debt as a percent of GDP, including both government and private entities? (Hint: click on the link, then move your mouse over the circles to see the details for each country)

  1. United States
  2. China
  3. Japan
  4. Germany

If you’re the sort of person who likes to draw your own conclusions, we highly recommend the IMF website from which we source much of our global information. Click on this link to see global economic data: https://www.imf.org/external/datamapper/NGDP_RPCH@WEO/OEMDC/ADVEC/WEOWORLD

Answer below…


Marcia Clark, CFA, MBA
Senior Research Analyst
Warren Street Wealth Advisors

Warren Street Wealth Advisors, a Registered Investment Advisor. The information contained herein does not involve the rendering of personalized investment advice but is limited to the dissemination of general information. A professional advisor should be consulted before implementing any of the strategies or options presented. Any investments discussed carry unique risks and should be carefully considered and reviewed by you and your financial professional. Past performance may not be indicative of future results. All investment strategies have the potential for profit or loss. 


DISCLOSURES

Investment Advisor Representative, Warren Street Wealth Advisors, LLC., a Registered Investment Advisor

The information presented here represents opinions and is not meant as personal or actionable advice to any individual, corporation, or other entity. Any investments discussed carry unique risks and should be carefully considered and reviewed by you and your financial professional. Nothing in this document is a solicitation to buy or sell any securities, or an attempt to furnish personal investment advice. Warren Street Wealth Advisors may own securities referenced in this document. Due to the static nature of content, securities held may change over time and current trades may be contrary to outdated publications.

Form ADV available upon request 714-876-6200


Quiz Answer: Japan


WSWA Monthly Market Commentary

WSWA Monthly Market Commentary for January 2019

Key Takeaways

  • All major asset classes were up strongly in January, one of the best yearly starts in recent memory, despite the month-long partial government shutdown in the U.S. and continuing uncertainty internationally about the economic impact of trade tariffs and the U.K. ‘Brexit’ negotiations
  • Global real estate took the lead with a monthly return of 9.7%, followed by commodities and U.S. growth stocks at 9% each. The S&P 500 posted an 8% return for the month
  • Recession fears in the U.S. receded as job growth was strong despite the unemployment rate edging up to 4%;Corporate profits continued to grow in the 4th quarter of 2018, though will slow in 2019
  • Fears of a recession due to rising interest rates diminished with Federal Reserve officials holding short-term rates steady at their January meeting and commenting on being ‘patient’ with future rate increases

What a way to start the year!

All major asset classes were up strongly in January, one of the best yearly starts in recent memory, despite the month-long partial government shutdown in the U.S., continuing uncertainty about trade tariffs’ impact on international growth, and the failure of U.K. ‘Brexit’ negotiations.

Global real estate took the lead among major asset classes with a monthly return of 9.70%, followed by commodities and U.S. growth stocks at 8.99% each. The S&P 500 gained 8.01% for the month, with emerging markets equities up 8.77% and developed international equities up 5.72%. U.S. bonds also had a strong month, rising 1.06%.

Morningstar Direct

Source: Morningstar Direct

Among commodities, crude oil prices led the way with a strong rebound from the December 24th low of $42.53, ending the month at $53.79. The S&P GSCI Agriculture index, the second largest component of the S&P GSCI index, stabilized after declining steadily in recent years[1].

West Texas Crude Oil Price

Source: www.macrotrends.net

GSCI Agriculture Index

GSCI Agriculture Index

International equity markets are well priced for future growth.

Emerging Markets equities (EEM) led the international equity markets in January, followed by the MSCI All Country World Index (ACWI), with Europe, Australasia, and Far East (EAFE) markets not far behind.


[1]https://us.spindices.com/indices/

European markets posted solid returns despite Prime Minister Theresa May’s Brexit plan being voted down by Parliament. After the Brexit agreement was rejected, Prime Minister May survived a ‘no confidence’ vote and promised renewed efforts to negotiate an acceptable exit plan with European Union leadership.

According to Harris Associates, manager of the Oakmark International fund, international markets have been the victim of “overly emotional equity markets” in recent months[2] and U.K. businesses are generating the highest percent free cash flow in the world (6%[3]). Prominent companies such as Daimler, Lloyds, and Tencent are trading at significant discounts to intrinsic value, and the Oakmark International portfolio has a Price/Cash Flow ratio of 4.8x compared to 7.5x for the world, indicating the shares held in the fund are priced significantly lower than the world markets.

Oakmark International, MSCI ACWI, EAFE, and Emerging Markets Equity Returns

Oakmark International

Source: https://stockcharts.com/h-perf/ui

Worries about a near-term recession in the U.S. receded as corporate earnings continued to grow in the 4th quarter of 2018 and employers added more new jobs than expected.

Unemployment in the U.S. remained near historic lows, edging up to 4%[4] due to the temporary addition of government workers furloughed during the partial government shutdown. The labor participation rate continued to increase slowly and job creation exceeded expectations in January with 304,000 jobs added[5].

Fears of rising interest rates derailing the U.S. economy diminished with Federal Reserve officials holding short-term rates steady at their January meeting and commenting on being ‘patient’ with future interest rate increases[6].


[2]https://www.im.natixis.com/us/markets/finding-value-in-overly-emotional-equity-markets
[3] As presented Natixis National Sales Meeting January 10, 2019 Source: Corporate Reports, Empirical Research Partners Analysis as of November 30, 2018. Excluding financials and utilities; data smoothed on a trailing six-month basis.
[4]https://www.wsj.com/articles/global-stocks-edge-up-after-a-january-surge-in-the-u-s
[5]https://www.bls.gov/news.release/empsit.nr0.htm
[6]https://www.federalreserve.gov/monetarypolicy/fomcpresconf20190130.htm

U.S. Unemployment Rate, Participation Rate, and 10-yr. Treasury Yield

Corporate earnings for the 4th quarter were generally near the 5-year average with 10 of the 11 S&P sectors reporting year-over-year earnings growth.

Energy, Industrials, and Communication Services led the way with double-digit growth rates in the 4th quarter, though earnings estimates for 2019 are trending lower across most sectors[7].

4th Quarter 2018 Actual Earnings Growth vs. 12/31/2018 Projections

2019 Forecast Earnings Growth vs. 12/31/2018 Projections


[7]https://insight.factset.com/earnings-season-update-february-1-2019
The investment team at Warren Street Wealth Advisors held the line through a difficult 4th quarter of 2018, reaping the reward with a strong start to 2019.

Despite some negative headlines in December, the U.S. economy does not seem poised for a recession and we will remain fully invested across market sectors until evidence to the contrary becomes clear. With the Federal Reserve cautious on raising interest rates, job growth and wages increasing, and trade talks moving forward, we expect market volatility in 2019 to settle closer to historic norms, though not without some bumps along the way.

Despite recent weakness in overseas markets relative to the U.S., we are strong in our conviction that international markets are poised to rebound as stock prices stabilize at attractive levels, particularly in Europe and Emerging Markets, and negative headlines diminish. While economic and fundamental data appear mixed globally, we continue to be broadly diversified as international markets work through the next phase of political and economic developments.

As always, if you have any concerns or questions, the investment and financial planning teams at Warren Street Wealth Advisors want to hear from you! Call, write, or drop by our Tustin or El Segundo offices any time. We are here to help.


Marcia Clark, CFA, MBA
Senior Research Analyst
Warren Street Wealth Advisors

Warren Street Wealth Advisors, a Registered Investment Advisor. The information contained herein does not involve the rendering of personalized investment advice but is limited to the dissemination of general information. A professional advisor should be consulted before implementing any of the strategies or options presented. Any investments discussed carry unique risks and should be carefully considered and reviewed by you and your financial professional. Past performance may not be indicative of future results. All investment strategies have the potential for profit or loss. 


Market Commentary – December 2018

Market Commentary – December 2018

Key Takeaways

  • Though the U.S. stock market closed the year with its first annual loss since 2008 (S&P 500 -4.38%)(1), investors retained the vast majority of gains earned in 2017 (21.83%.) International stocks as measured by the MSCI EAFE(2) index were down -8.96%, giving up just over half of 2017’s gains (16.84%), and the Barclays Aggregate U.S. bond index ended the year flat at +0.01% after a very strong November and December.
  • Though market turbulence in the 4th quarter felt extreme, volatility over the year didn’t approach the peaks seen after the Dot Com bubble burst in 2001-2002 or during the financial crisis of 2008-2009.
  • Global financial markets tend to exhibit a ‘sector rotation’ pattern of recent losers becoming the next period’s winners. If the pattern holds true, international stocks are poised for a strong year in 2019.
  • 2018’s poor performance followed an unusually steady 10-year period of growth. Investors bold enough to put their money at risk after the market plummeted in 2008 were handsomely rewarded. Investors willing to do the same in 2019 may be rewarded once again.


It wasn’t pretty, but the year is finally over and we already see indications of better times ahead in 2019.

Though the U.S. stock market closed the year with its first annual loss since 2008 (-4.38%) , investors retained the vast majority of gains earned in 2017 (21.83%) and the previous 9 years of recovery post the 2008 financial crisis. Though European stock markets fell behind the U.S. last summer and never caught up, these markets also ended 2018 well ahead of where they started in 2017. International stocks as measured by the MSCI EAFE index were down -8.96% in 2018 compared to +16.84% in 2017, and U.S. bonds ended the year flat after recovering strongly late in the 4th quarter.

Source: https://stockcharts.com/h-perf/ui

Market sectors which lagged in the strong quarters, especially bonds (AGG) and gold (GLD), provided welcome relief during the 4th quarter downturn. International stock markets avoided some of the December tumble and rebounded into January 2019, easing some of the pain from lagging the robust U.S. market earlier in the year.

The return of stock market volatility in the 4th quarter surprised investors, especially compared to an unusually stable 2017.

Volatility in 2018 was more than double that of 2017, though did not approach the peak volatility seen during the financial crisis of 2008-2009 and post the Dot Com bubble/credit crisis in 2001-2002. The pattern seems to be that periods of unusual stability are often followed by a spike in volatility. We know that the past isn’t always reflective of the future, but as Mark Twain is reported to have said: “History doesn’t repeat itself, but it often rhymes.”

Just as periods of stability are often followed by turbulence, extreme market moves are commonly followed by reversion toward the mean (average).

This tendency is illustrated by the two charts below. The first chart shows the drop in the SPY and EFA ETFs in the period between July-November 2011. Notice the jagged ups and downs just after the drop, followed by a fairly steady up-trend through 2013, though not without some negative surprises along the way.

We see a similar pattern in the 4th quarter of 2015 before the start of the bull market of 2016-2017.

And while the downturns are painful, they tend to be relatively brief compared to the recovery period.


  • Dot Com bust lasted from early 2000 to early 2003, followed by 5 years of positive returns
  • Financial crisis crash lasted from late 2007 to early 2009, followed by 9 years of mostly positive returns
  • Less dramatic declines in 2011 and 2015 were followed by 3 years of positive returns

Asset class returns tend to follow a ‘sector rotation’ pattern with prior period winners commonly falling in the rankings in subsequent periods, and prior period losers tending to rise in the rankings.

Source: Morningstar Direct

Though historical context is helpful, we need to face forward when making investment decisions. Following the crowd and expecting history to repeat itself without considering the underlying drivers of returns isn’t likely to be a successful strategy in the coming year.

Though market conditions vary from year to year, the investment team at Warren Street Wealth Advisors believes international stocks in particular have been hit by political and economic ‘headline risk’ more than actual financial distress. Many European companies such as BNP Paribas (one of the largest banks in Europe), Daimler (maker of Mercedes Benz), and Lloyds Banking Group (a leading U.K. financial service firm) are poised for a strong rebound in 2019. In emerging countries, stalwart firms such as Samsung and Taiwan Semiconductor remain solid global players, with disruptors such as Alibaba and Tencent making their presence felt beyond their home base in AsiaPacific.

Another important thing to remember is that the stock market is not the real economy. Fundamental strength in corporate balance sheets should keep the global economy, and the markets, positive in 2019.

GDP reflects the value of goods and services produced in a country – ultimately, GDP reflects corporate earnings. Robust U.S. GDP growth early in 2017 led to tight labor markets and rising inflation, supporting the Federal Reserve’s plan to ‘normalize’ short-term interest rates(3). Though GDP growth is expected to slow in 2019, the Federal Reserve forecasts a positive growth rate of approximately 2%. Not stellar, but certainly not in recession territory. And not so strong as to require the Fed to increase their pace of raising short-term interest rates, since modest GDP growth is unlikely to spark inflation. The International Monetary Fund is projecting similar modest positive growth for developed nations, and near 5% growth for emerging economies.


Growth Projection for U.S. GDP

Source: Factset


Growth Projection for the World

Source: International Monetary Fund


Economic fundamentals should ultimately find their way into stock prices, but the markets often become overly optimistic or pessimistic along the way.

As we mentioned in our November commentary, S&P 500 corporate profits were very strong in the 4th quarter of 2018. And for the calendar year, growth in corporate profits was 20.3% due in part to the reduced corporate tax rate(4). This is the highest growth rate we’ve seen since 2010 when profits jumped nearly 40% coming out of the Great Recession of 2008-2009. All 11 sectors of the S&P 500 reported positive growth for the year, with 9 of the 11 sectors reporting double-digit growth.


You might be surprised to see that Energy companies reported the highest calendar year earnings growth of all the 11 sectors. Despite the 4th quarter fall in oil prices, oil has actually increased when compared against the prior year-end. Materials and Financials also posted strong earnings growth in 2018, a fact not reflected in their December closing stock prices.

As shown in the chart above from Fidelity Research(5), the biggest losers in the S&P 500 were not Technology companies which were grabbing most of the news headlines, but rather Industrials, Financials, Materials, and Energy firms. Industrials and materials were hard hit by concerns over trade tariffs and a slowing, though still strong, pace of new home building(6). Energy equipment and services firms suffered from falling oil prices hurting profit margins. Financial firms also struggled as increasing short-term funding rates squeezed investors’ profit expectations.

Conclusion: Though we can’t predict the future, periods of extreme market movements are often followed by reversion toward the mean. The underlying economic data remains solid and sooner or later investors will incorporate this reality into global stock and bond prices. In the meantime, the investment team at Warren Street Wealth Advisors is watching the data, rebalancing into weakness, and looking forward to a smoother ride in 2019.


Marcia Clark, CFA, MBA
Senior Research Analyst
Warren Street Wealth Advisors

Warren Street Wealth Advisors, a Registered Investment Advisor. The information contained herein does not involve the rendering of personalized investment advice but is limited to the dissemination of general information. A professional advisor should be consulted before implementing any of the strategies or options presented. Any investments discussed carry unique risks and should be carefully considered and reviewed by you and your financial professional. Past performance may not be indicative of future results. All investment strategies have the potential for profit or loss. 


Sources

  1. All returns retrieved from Morningstar Direct
  2. EAFE = Europe, Australasia, Far East
  3. https://insight.factset.com/2017-look-back-2018-predictions-0
  4. https://insight.factset.com/sp-500-2018-earnings-preview-highest-earnings-growth-in-eight-years
  5. https://eresearch.fidelity.com/eresearch/markets_sectors/sectors/sectors_in_market.jhtml
  6. https://tradingeconomics.com/united-states/housing-starts


Market Commentary – November 2018

Market Commentary – November 2018

Key Points:

  • Global markets remained volatile despite more clarity about the geopolitical landscape and economic outlook
  • 78% of S&P 500 companies reported positive earnings surprises. A survey of large corporations indicated an expectation for EPS to slow somewhat in 2019 from the current high levels.
  • The U.S. stock market is not rewarding positive surprises as much as usual and is punishing negative surprises more than usual, resulting in lower lows and not-as-high highs as might be expected.
  • The Fed’s mission to bring short-term rates to more ‘normal’ levels is narrowing the difference between short- and longer-term interest rates (a ‘flat’ or ‘inverted’ Treasury yield curve.) Muted inflation expectations and investor ‘flight to quality’ is keeping demand for long-term bonds high, putting downward pressure on yields. Neither of these factors indicates a recession is imminent.
  • Conclusion: The U.S. economy isn’t going into a recession, it’s just taking a bit of a breather. The stock market will eventually recognize this and stabilize, but it may take a few more months.

Finally! A month of positive returns for the global financial markets.

Uncertainty eased a bit in November as midterm elections were completed with no big surprises, talks of trade wars continued without significant escalation, and Fed Chairman Jerome Powell indicated interest rates were nearing a neutral point. What a relief! Not that the month was pretty, it was far from it, but at least we ended up higher than where we started.

Of course, there are still things to worry about. According to the World Bank¹, energy-related commodities dropped 15.4% in November as OPEC and other oil-producing countries failed to limit supply. European banks and automakers continued to struggle amid news of the German financial giant Deutsche Bank being accused of money laundering. Here in the U.S., General Electric is battling CEO drama, debt issues, and anemic revenues. General Motors announced plans to close some of their factories. These events are certainly worth keeping an eye on but aren’t likely to kick the feet out from under global economies.

So if the economy is doing OK, why is the stock market so jittery?

When all is said and done, stock prices should reflect expectations of future profits. According to a recent article published by FactSet², the most commonly reported factor negatively impacting corporate earnings in the 4th quarter wasn’t trade tariffs or rising interest rates like we’ve heard from market commentators, but rather the strength of the U.S. dollar. The next most mentioned factor was the rising costs of raw materials and labor. Despite these headwinds, corporate profits have been strong.

impact factors

We also were told earlier in the year that the markets were ‘fully valued’ or ‘expensive’ relative to historical norms. One positive outcome of the market corrections in October, November, and early December is that stock prices are now well within the normal range for fair value.

According to FactSet’s ‘Earnings Insight’ report published November 30, 2018³:

  • 78% of S&P 500 companies reported a positive EPS surprise and 61% reported a positive sales surprise
  • The blended earnings growth rate for the S&P 500 is 25.9%. If 25.9% is the actual growth rate for the quarter, it will mark the highest earnings growth since Q3 2010.
  • All eleven sectors have higher growth rates than the 3rd quarter due to positive EPS surprises and upward revisions to EPS estimates.
  • 68 S&P 500 companies have issued negative EPS guidance and 31 S&P 500 companies have issued positive EPS guidance
  • The forward 12-month P/E ratio for the S&P 500 is 15.6, below the 5-year average (16.4) but above the 10-year average (14.6)

sp500 earnings

All this data means that U.S. corporations are doing fine. We recognize that many companies are forecasting slower growth in 2019 but slower growth from a robust pace doesn’t mean the economy is falling off a cliff. In fact, the U.S. has never had a recession when corporate profits are growing. What we’re seeing in the market is a disconnect between reality and expectations, with wary investors sitting on the sidelines instead of jumping in to ‘buy the dip’. The volatility in the U.S. stock market is not due to deteriorating fundamentals, but rather to investors not rewarding positive surprises as much as usual (fewer buyers), and punishing negative surprises more than usual (more sellers.)

  • Companies reporting positive earnings surprises have seen their stock price rise by only +0.1% in the two days prior to and after the announcement, relative to the 5-year average gain of +1.0%
  • Companies posting negative earnings surprises have seen their stock price slump by -3.1% in the same timeframe, compared to the 5-year average of -2.5%

eps and price change

OK, maybe the stock market is overreacting. But what’s this we hear about the ‘inverted yield curve’ forecasting that a recession is imminent?

A ‘yield curve’ is a graphical depiction of market-based yield-to-maturity for bonds with different maturity dates. The curve is usually upwardly sloping, meaning that lenders and investors require higher returns the longer they have to wait to get their money back. Over the past year, the difference between the 10-year and 2-year Treasury yields has been getting smaller and smaller, causing the yield curve to ‘flatten’. If short-term bond yields become higher than longer-term yields – an ‘inverted’ yield curve – investors interpret this as a signal of a coming recession.

yield curves

Source: treasury.gov

What you don’t hear in the news is that yield curve inversion has preceded recessions by up to 2 years, which isn’t much of a prediction. When you add the observation that there have been more yield curve inversions than recessions, perhaps we should take a closer look at the ‘cause’ of the yield curve inversion before we jump to the ‘effect’.

Let’s start by refreshing our memory on the definition of a recession:

  • GDP (Gross Domestic Product) is the value of goods and services produced in the U.S.
  • A recession is two quarters of negative GDP growth

By definition then, corporate profits have to slow substantially for GDP growth to become negative. Right now employment is strong, wages are growing, and corporate profits are solid. As long as people have jobs, they tend to buy stuff. As long as people buy stuff, corporations will be profitable. If corporations are profitable, GDP growth should remain positive. Given everything we see in regard to the current macroeconomic environment, the investment team at Warren Street Wealth Advisors expects slow and steady growth to continue at least through summer of 2019, and probably longer. As long we can dodge potential catastrophes caused by weather, wars, or geopolitical events, there’s no reason for the U.S. economy to fall into a recession.

So if the economy isn’t going to stall, what’s with the inverted yield curve?

There’s nothing mysterious about why short-term rates are going up – the Fed is pushing short-term interest rates back to ‘normal’ levels. The question then revolves around why long-term rates aren’t going up as much.

Long-term Treasury rates aren’t set by the Fed, but by the willingness of investors and businesses to borrow and lend. This willingness is driven by 1) economic growth, 2) inflation expectations, and 3) risk appetites.

    1. We’ve already talked about economic growth being solid but not outstanding, so no need for long-term rates to rise significantly in response to business demand for funds
    2. Inflation is hovering around 2%, just where the Fed wants it, so current yields are sufficient to protect purchasing power
    3. The biggest reason for the current inversion is probably related to risk appetites

What kind of risk am I talking about? Market risk.

With the wide swings in the stock market in recent months, we’ve seen a ‘flight to quality’ away from stocks and toward the safety of Uncle Sam. More demand for Treasury bonds leads to higher prices, and when bond prices rise, yields fall. With short-term rates moving up due to Fed actions and long-term rates staying low due to market forces, the yield curve flattens. It isn’t recessionary, it’s just simple supply and demand. In fact, if you look at corporate bond yields instead of Treasuries, longer-term yields have indeed been rising as the Fed increases short-term rates.

corporate sprea

There’s really only one conclusion to draw from the available evidence. The U.S. economy isn’t going into a recession, it’s just taking a bit of a breather.

While the markets adjust to this new reality, investors are getting tired of enduring the huge swings in stock prices. When investors stay on the sidelines and stop ‘buying the dips’, stock prices have trouble finding a floor. Hence the tendency for the market to fall by hundreds of points on news headlines, whether the information impacts long-term profits or not. What should we do now? The investment team at Warren Street Wealth Advisors is buckling our seatbelts and holding on tight as we speed toward a turbulent year-end close. We’re confident that the fundamental strength of U.S. and global economies will win out eventually, but it may take another few months for the markets to reward our patience.

In the meantime, we’re here for you! Call or stop by any time to share your questions, concerns, or suggestions.


Which of the following yields curves is best characterized as ‘inverted’? (Focus on the upper line on each chart)

chart 1 chart 2


Marcia Clark, MBA, CFA
Senior Research Analyst
Warren Street Wealth Advisors

Warren Street Wealth Advisors, a Registered Investment Advisor. The information contained herein does not involve the rendering of personalized investment advice but is limited to the dissemination of general information. A professional advisor should be consulted before implementing any of the strategies or options presented. Any investments discussed carry unique risks and should be carefully considered and reviewed by you and your financial professional. Past performance may not be indicative of future results. All investment strategies have the potential for profit or loss. 


¹ http://www.worldbank.org/en/research/commodity-markets
² https://insight.factset.com/what-factors-may-have-a-negative-impact-on-revenue-and-earnings-growth-in-q4
³ https://www.factset.com/hubfs/Resources%20Section/Research%20Desk/Earnings%20Insight/EarningsInsight_113018.pdf
⁴ https://www.wsj.com/articles/stocks-stage-recovery-after-dow-drops-over-700-points-1544075565
⁵ https://www.wsj.com/articles/stocks-stage-recovery-after-dow-drops-over-700-points-1544075565
Quiz Answer: Chart #2