September 2019 Market Review

With competing economic data, where should investors turn?
Oil shocks, impeachment, and Brexit – Oh My!
Key Takeaways
- U.S. stock and bond markets closed the 3rd quarter with an impressive – though volatile – year-to-date return. The S&P 500 index ended September up nearly 19%, the best 3-quarter return since 1997, while the Barclays Aggregate Bond index posted an outstanding return near 8%.
- Economic data remained mixed. The U.S. Consumer Confidence index fell by -9.1%, much more than expected, but unemployment fell to 3.5%, the lowest in 50 years.
- The House of Representatives initiated an impeachment investigation of President Trump after a ‘whistleblower’ leaked information about the President asking Ukrainian officials to investigate Democratic candidate Joe Biden’s son.
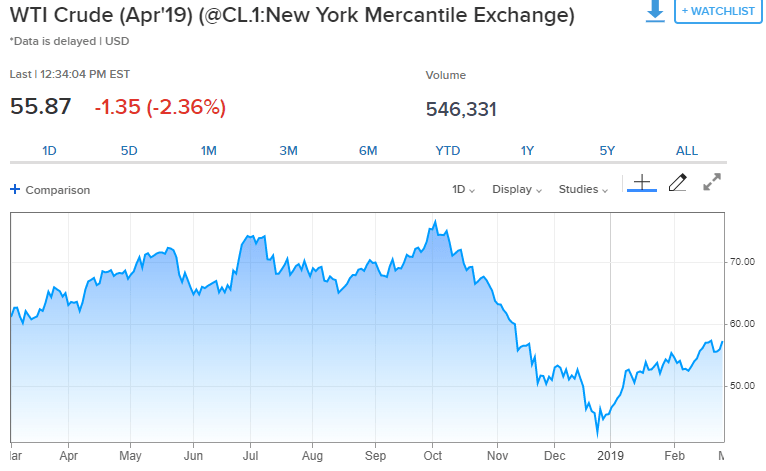
- Drone strikes on Saudi Arabian oil installations shut down 50% of Saudi oil production, about 5% of world production, briefly sending oil prices off the rails and adding to recession fears.
- Prime Minister Boris Johnson was deemed to have acted illegally by shutting down the U.K. Parliament, putting pressure on him to come to a Brexit resolution with the European Union.
- Conclusion: The U.S. economy remains on track for a good year. Despite the markets’ willingness to shrug off trade wars and geopolitical uncertainty, significant challenges are still out there. Investors should prepare for renewed market turbulence as these issues resolve themselves over the coming months.
Stock and bond markets rebound from August’s slump
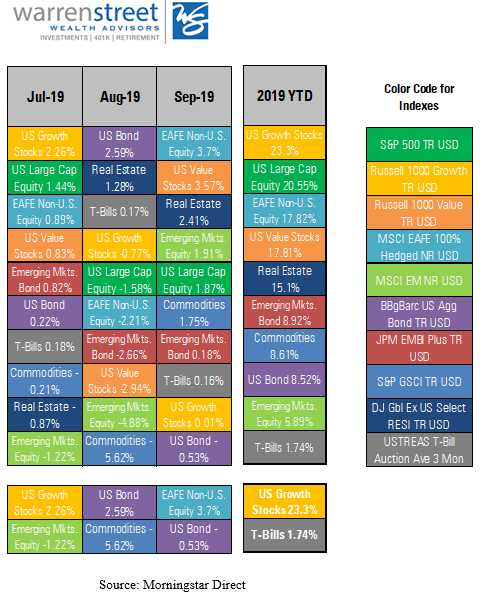
The 3rd quarter was quite a roller coaster ride! Gold and other ‘safe’ assets were the go-to market segments for the quarter. Gold led the way with a return of +4.26%[1], despite a slip in late September. U.S. bonds took second place, edging out U.S. stocks with a return of 2.34% versus 1.75%. International stocks were the top performers in September at +3.7%, but continued to lag the U.S. for the quarter at -0.79%. Emerging markets equities were in second place for the month at +1.91%, but are far behind for the year and quarter, losing -4.75% between July 1st and September 30th.
Market returns 7/1/2019 – 10/4/2019
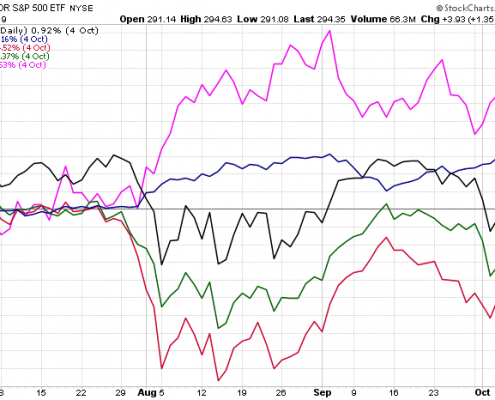
https://stockcharts.com/h-perf/ui
The financial markets continued to react strongly to economic news and geopolitical events, though the magnitude of the swings began to subside. This moderation is a bit surprising given the unexpected -9% drop in Consumer Confidence and the Purchasing Manufacturers Index falling to its lowest level since June 2009. But investor fatigue is bound to set in sooner or later, and current events just seem to build on a base with which investors have become wearily familiar.

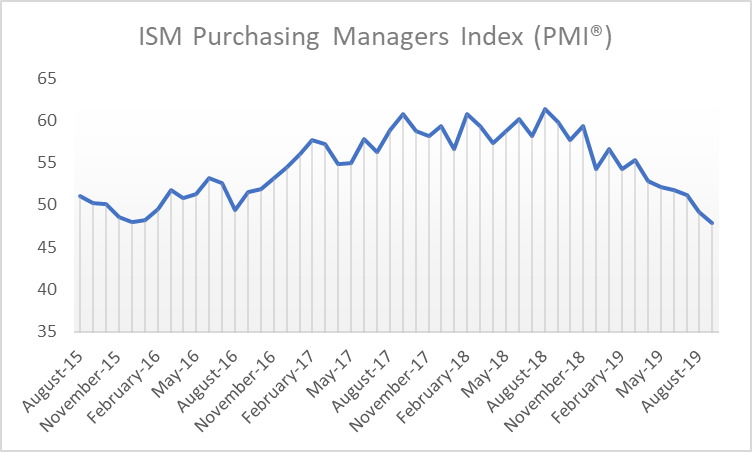
Source: https://ycharts.com/indicators/us_pmi
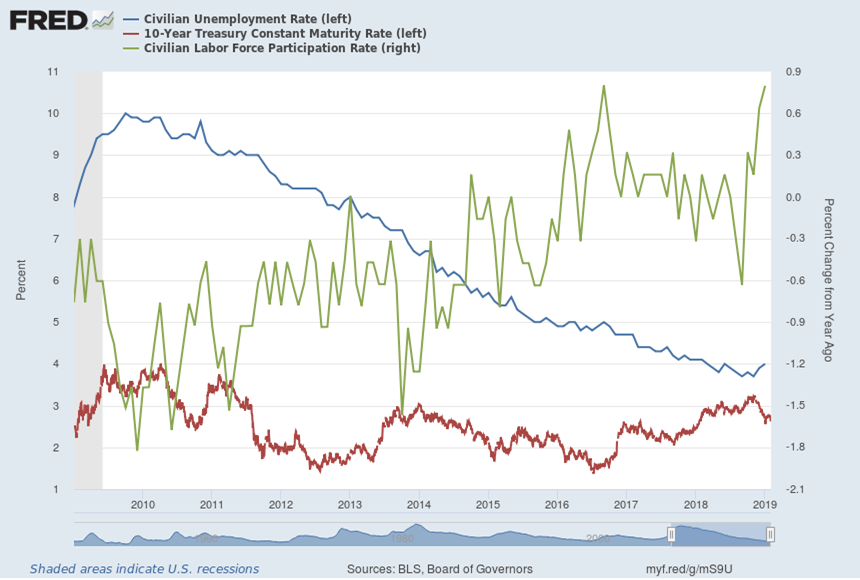
The economy created only 136,000 new jobs in September – certainly nothing to brag about, but good enough this late in the expansion. At the same time, the unemployment rate fell to 3.5% – the lowest in half a century – and the overall employment ratio increased to 61%, the highest since December 2008. Apparently, the U.S. job market is alive and well…at least for the time being.
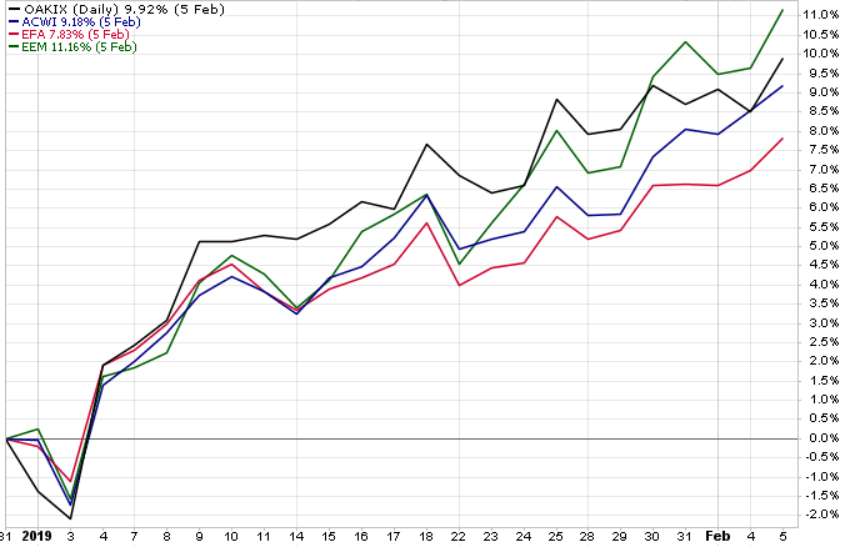
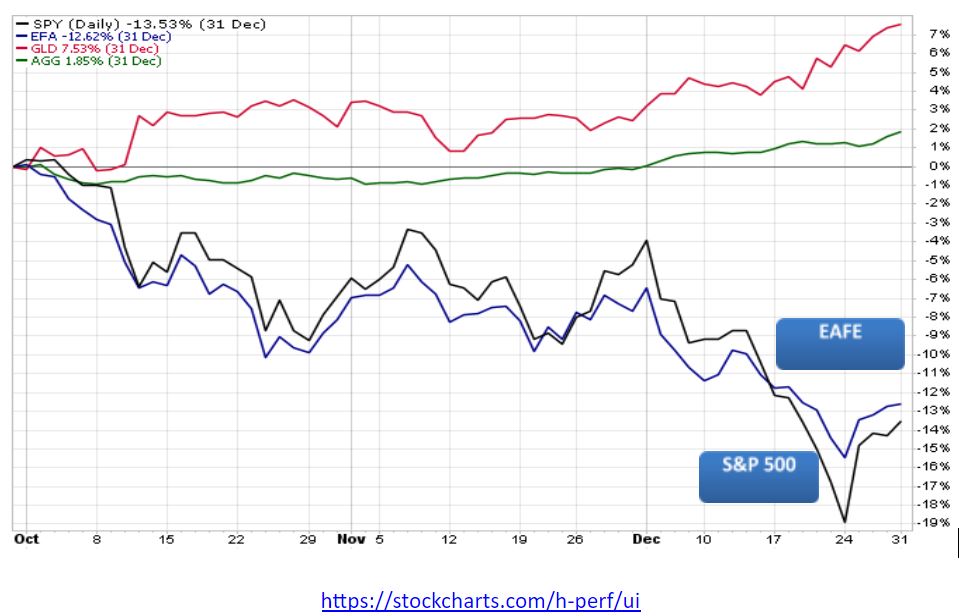
Despite competing political and economic pressures, U.S. and developed international stock markets are on track for a very strong year. As of October 7, the S&P 500 was up more than 19%, gold was up over 16%, and the Europe, Australasia, and Far East index was up nearly 12%. But be wary of another 4th quarter slump like we saw in 2018! Given mixed economic data, the impeachment inquiry of President Trump, and continuing trade tensions, any of these could derail the markets – at least temporarily – between now and December 31st.
Market returns 1/1/2019 – 10/4/2019
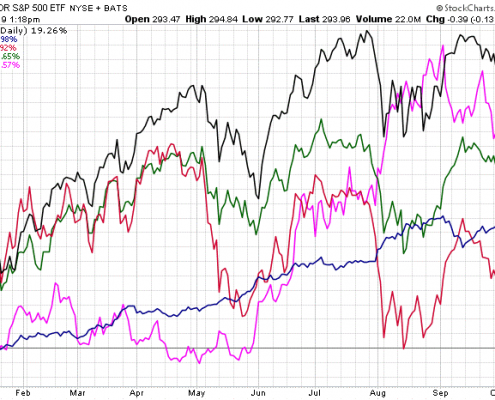
https://stockcharts.com/h-perf/ui
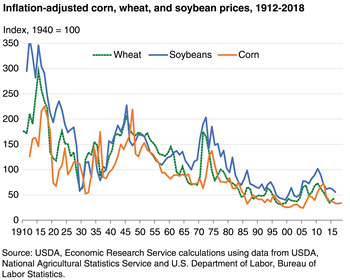
One of the less-reported casualties in the U.S.-China trade war is the agricultural sector. Inflation-adjusted prices for corn, wheat, and soybeans have been declining for decades, largely due to increased productivity and reduced global population growth. Add trade tariffs and the wettest 12 months on record[3], and farmers are facing a ‘perfect storm’ of negative events. Smaller farms are going out of business, and the number of farms in the U.S. is heading below 2 million, the lowest in nearly a century.
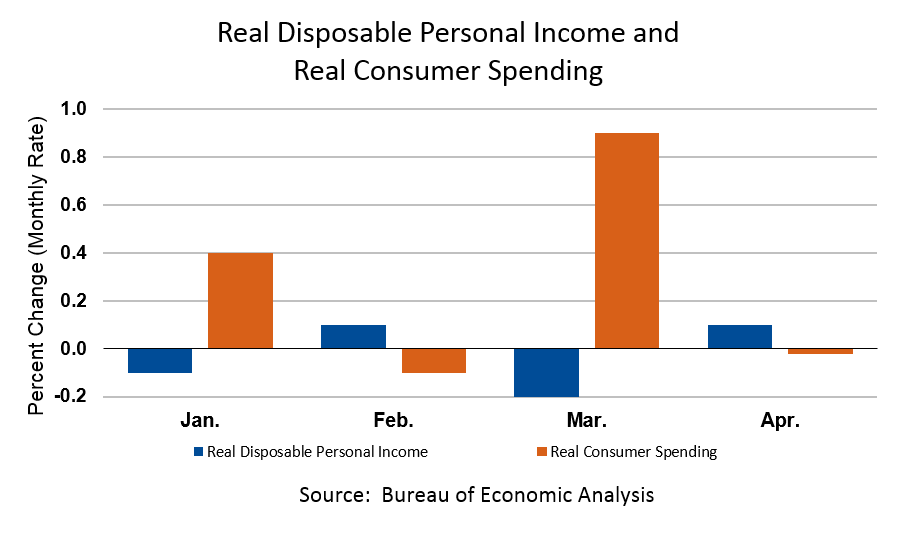
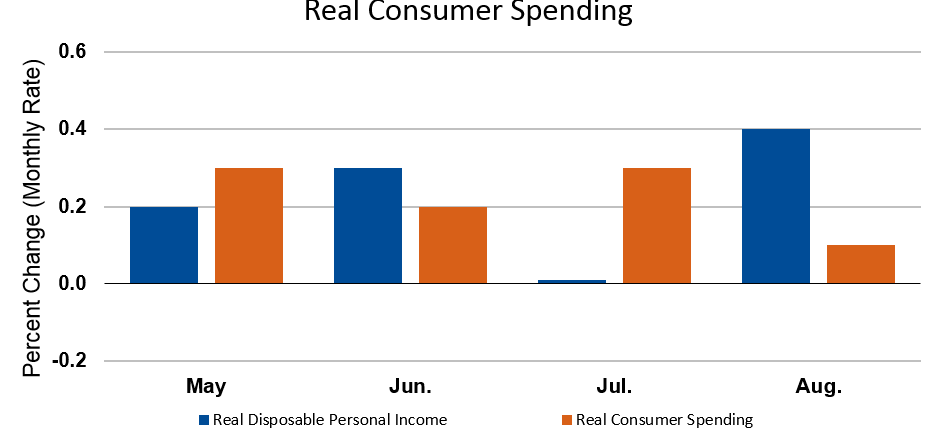
But despite the significant challenges facing the agriculture and manufacturing sectors, the U.S. economy is holding steady. Personal income and consumer spending rose in August for the second month in a row. Retail sales were good, and housing showed signs of renewed activity.

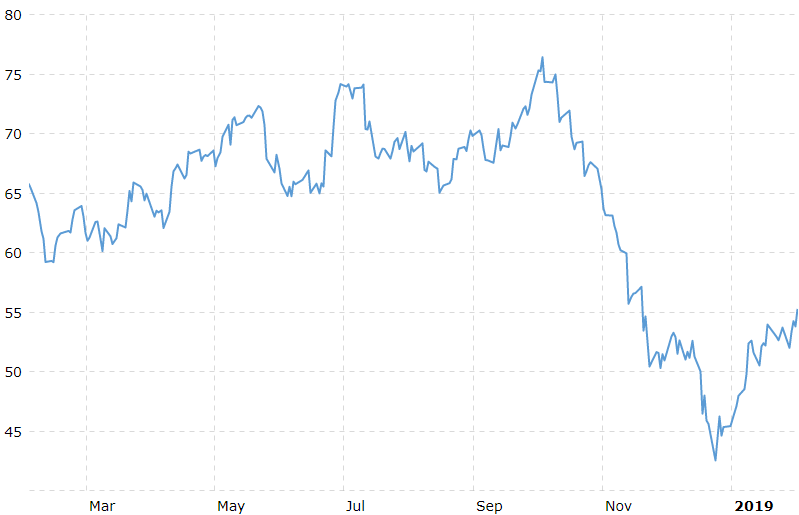
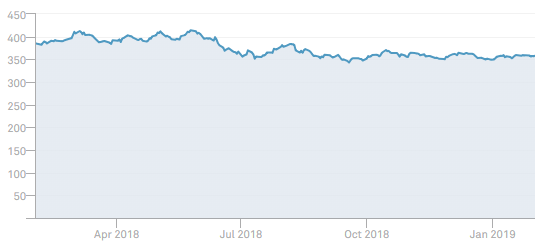
As reported by the Wall Street Journal on September 25, U.S. home-price growth is slowing and mortgage rates are historically low at around 4%[4]. With such low interest rates, home price affordability remains within reach as indicated by the sharp drop in the Case-Shiller Home Price Index in 2019, shown on the chart above.
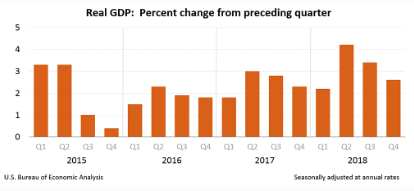
Forecasters expect housing to contribute slightly to GDP for the first time since 2017 as home sales and construction increased in August.
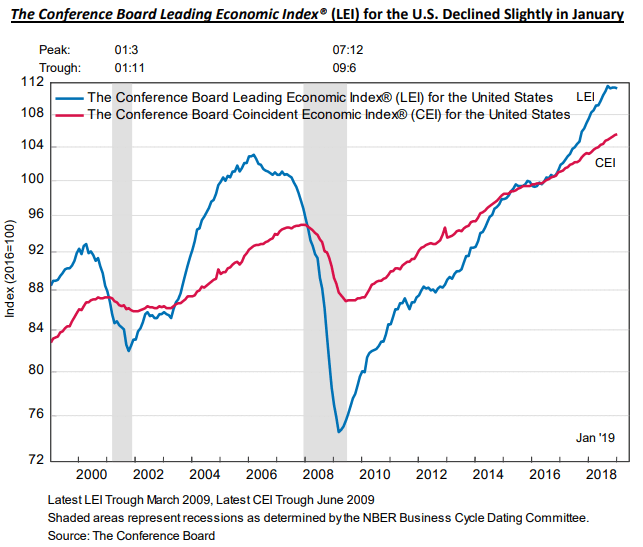
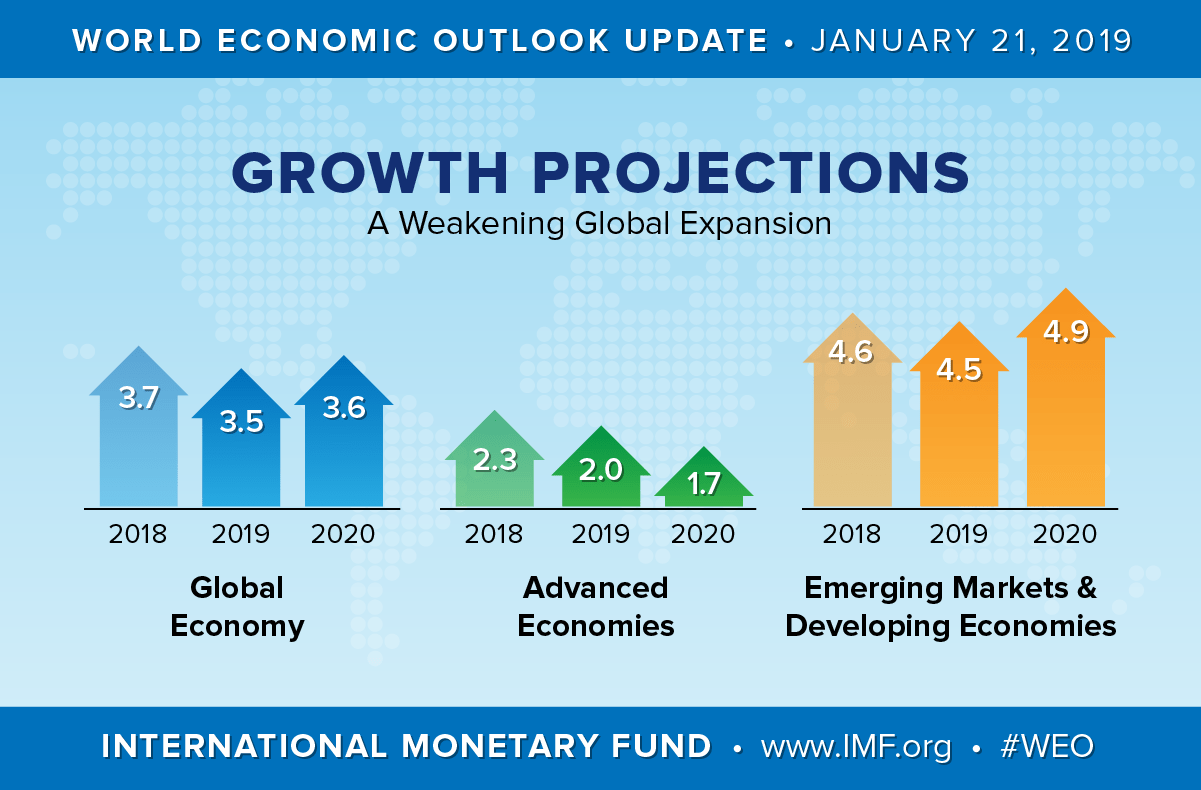
With so much going on in the world, it’s hard to know which direction to turn! For a straightforward summary of the likely impact of these competing economic factors on global growth, we refer you to the graphic below prepared by The Conference Board (publisher of the Leading Economic Indicator index.)
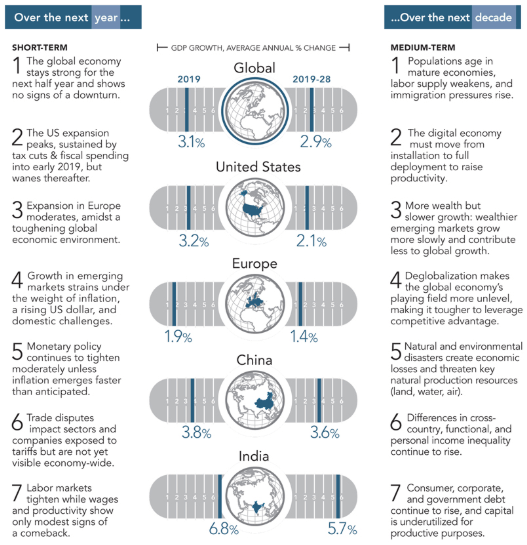
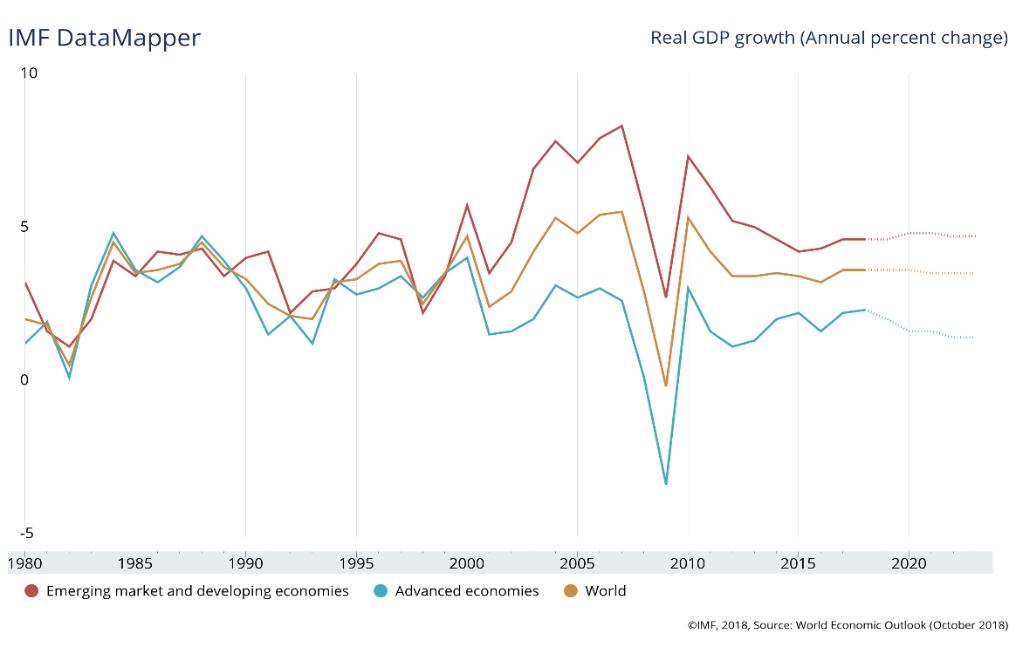
The Conference Board economic outlook
Bottom line: the U.S. economy is on track for solid growth in 2019, slowing somewhat thereafter. A recession is not in the forecast for the next 12 months, though demographic factors point to slower growth worldwide in the coming years.
Given the myriad challenges facing the global economy right now, negative surprises are definitely a possibility as we navigate the final quarter of 2019. Investors may just have to close their eyes, hold on tight to a prudent investment plan, and ride out the inevitable turbulence in the coming months.
Marcia Clark, CFA, MBA
Senior Research Analyst, Warren Street Wealth Advisors

DISCLOSURES
Investment Advisor Representative, Warren Street Wealth Advisors, LLC., a Registered Investment Advisor
The information presented here represents opinions and is not meant as personal or actionable advice to any individual, corporation, or other entity. Any investments discussed carry unique risks and should be carefully considered and reviewed by you and your financial professional. Nothing in this document is a solicitation to buy or sell any securities, or an attempt to furnish personal investment advice. Warren Street Wealth Advisors may own securities referenced in this document. Due to the static nature of content, securities held may change over time and current trades may be contrary to outdated publications.
Form ADV available upon request 714-876-6200
[1] Performance represented by ETFs designed to track various market segments: SPY (S&P 500), AGG (Barclay’s Aggregate Bond index), EEM (emerging markets equity), EFA (developed international equity), GLD (gold prices)
[2] Performance represented by ETFs designed to track various market segments: SPY (S&P 500), AGG (Barclay’s Aggregate Bond index), EEM (emerging markets equity), EFA (developed international equity), GLD (gold prices)
[3] https://www.wsj.com/graphics/us-farmers-miserable-year/?mod=article_inline&mod=hp_lead_pos5
[4] https://blogs.wsj.com/economics/2019/09/25/newsletter-housings-maybe-rebound-chinas-decoupling-warning-and-consumers-cloudy-crystal-ball/?guid=BL-REB-39607&dsk=y