Posts

Tax Loss Harvesting: How to Make the Most Out of Market Volatility

When we invest money, our main objective is to see the money grow. When we think about market losses and downturns, we may think of painful periods where we watch our account balances decrease instead of grow. While market losses are never fun, they are unfortunately a part of the normal investment life cycle. However, when market volatility hands us losses, there are some options to make lemonade out of lemons.  

What is tax loss harvesting?

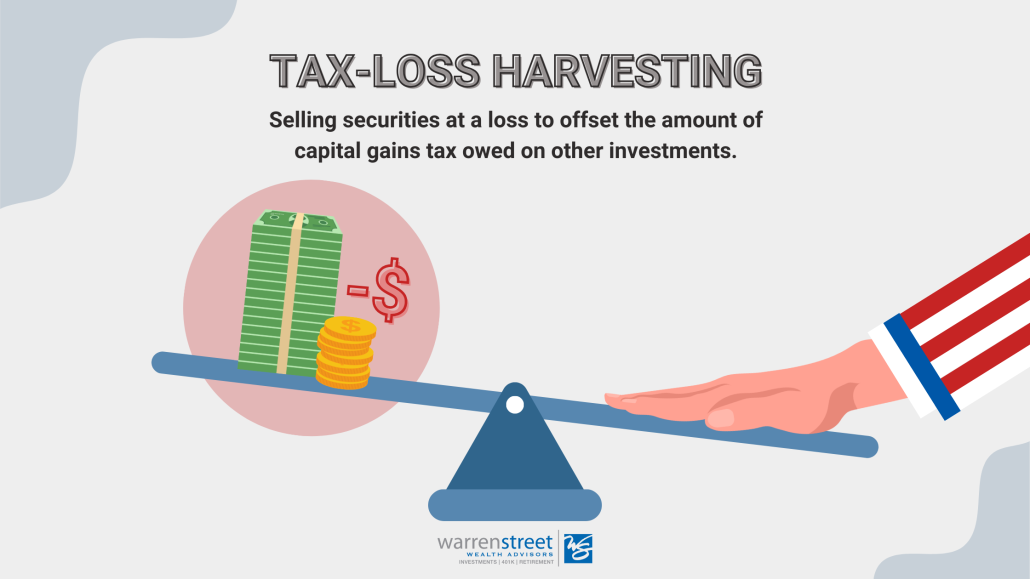
Tax loss harvesting is the process of selling securities while they are at a loss, realizing that loss for tax purposes, and then redeploying that money into another investment (such as a different stock, bond, or mutual fund). The IRS does not allow you to sell an investment at a loss, receive the tax benefit, and then immediately reinvest those proceeds into the exact same security right away. Selling a security and re-purchasing it within the same 30-day window is called a “Wash Sale.” You can avoid triggering the Wash Sale rule by investing in something similar but different enough to avoid having the rule apply.

While most people will tend to do this only once at year end, this is actually something that can be done at any time in the year with no limit as to how frequently you do so. With custom indexing and commission-free trading, frequent tax loss harvesting has become more achievable than ever. In years of high volatility, frequently harvesting tax losses can have a big impact on your tax bill.  

Keep in mind that for this strategy to work, you must have capital invested in a taxable, non-retirement brokerage account. Your 401(k) and IRA are not eligible for tax loss harvesting.

How does it benefit you?

In years of extreme volatility, you may be able to accumulate a large amount of tax losses in a short period of time. These losses can then be used to offset future capital gains.  If you end up with more tax losses than you have gains to offset them in any given year, you can use the losses to offset up to $3,000 of ordinary income on your tax return.  

You will be able to carry forward an unlimited amount of these losses into future tax years until you’ve been able to use them up.

Tax loss harvesting can be especially useful for investors who might have highly concentrated company stock with a large amount of unrealized gains, or other legacy investments that they’ve been holding onto to avoid a large tax impact. These tax losses can be used to help decrease single stock risk and sell off legacy assets with little to no tax impact.

What are the next steps?

If you are a Warren Street client, we are already doing this for you (as applicable).  For clients with larger taxable brokerage accounts invested in our custom indexing strategy, you will likely see tax loss harvesting happening on a more frequent basis.  

All in all, seeing losses reported on your Form 1099 form is not necessarily a bad thing. While your long term objective remains the same in terms of seeking growth, taking advantage of short term volatility through tax loss harvesting can lead to a nice tax perk that can aid in your overall financial return on investments in the long run.

If you have any questions or would like to speak with one of our advisors for complimentary portfolio review, you can schedule a consultation here

Justin Rucci

Justin D. Rucci, CFP®

Wealth Advisor, Warren Street Wealth Advisors

Investment Advisor Representative, Warren Street Wealth Advisors, LLC., a Registered Investment Advisor

The information presented here represents opinions and is not meant as personal or actionable advice to any individual, corporation, or other entity. Any investments discussed carry unique risks and should be carefully considered and reviewed by you and your financial professional. Nothing in this document is a solicitation to buy or sell any securities, or an attempt to furnish personal investment advice. Warren Street Wealth Advisors may own securities referenced in this document. Due to the static nature of content, securities held may change over time and current trades may be contrary to outdated publications. Form ADV available upon request 714-876-6200.

‘Risk On’ trades take the lead in October

‘Risk On’ trades take the lead in October

Key Takeaways

  • U.S. growth stocks and emerging markets jump-started the 4th quarter with returns of 2.82% and 4.22% respectively as investors shifted away from ‘risk off’ assets such as defensive stocks and U.S. Treasury bonds
  • The FOMC dropped its federal funds interest rate target for the 3rd time in 2019 to 1.5% – 1.75%. Chairman Powell indicated this cut was the last of the ‘midcycle adjustments’, causing investors to speculate about a pause in rate changes for the next few FOMC meetings.
  • The U.S. and China made progress toward a trade resolution, though the pace and magnitude of the agreement is unclear. Global economies seem to be successfully navigating geopolitical tensions in Hong Kong, unrest in Chile, water wars in Egypt, and the never-ending Brexit saga, among others.
  • Conclusion: Barring a major geopolitical misstep, the U.S. stock market could end the year with a return in the top 25% since 1998. U.S. bonds may end with their best return since 2010.

Global stocks begin to close the gap with the U.S.

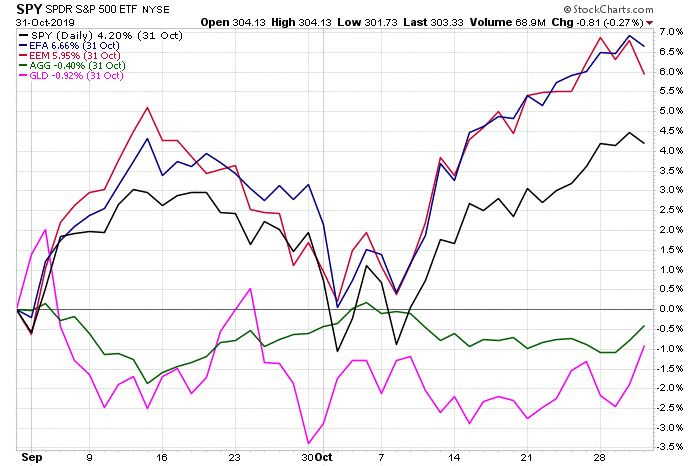
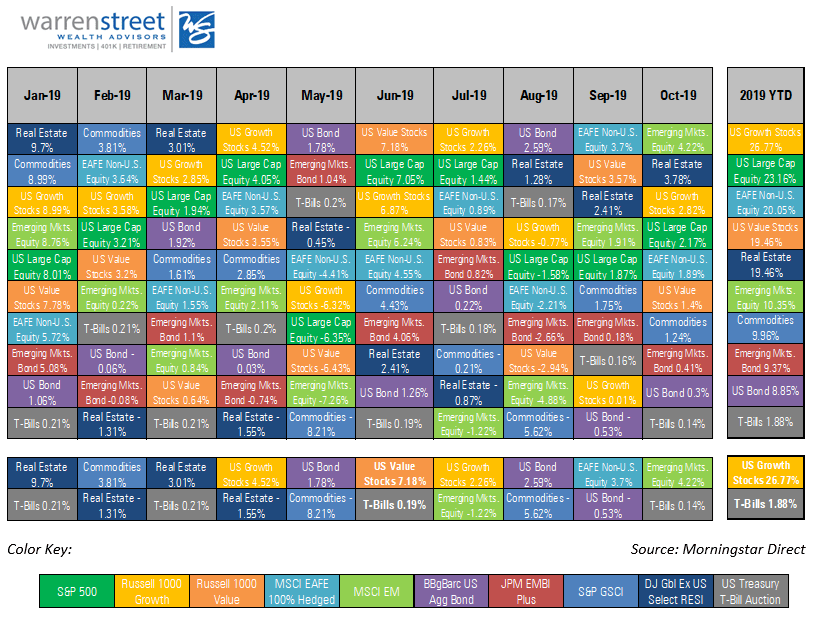
The 4th quarter is off to a great start! Despite a sharp decline the first few days of the month, global stock markets were very strong in October. Emerging Markets equity beat the S&P 500 for the second month in a row, up 4.22% versus 2.17%[1]. In typical ‘risk on’, ‘risk off’ fashion, bonds and gold lagged the field in October. Commodities stayed within sight of the leaders at +1.24% for the month, but U.S. and Emerging Markets bonds were far behind at +0.41% and +0.30%, respectively. For the year-to-date, Europe, Australasia, and Far East (EAFE) is picking up the pace with a return of 20.05% versus 23.16% for the S&P 500. The year-to-date leader as of October 31st is U.S. growth stocks at 26.77%.

https://stockcharts.com/h-perf/ui

This strong start to the 4th quarter can be attributed to progress with China/U.S. trade negotiations and no significant negative news about the other international worries facing the markets: Brexit, political uncertainty in the U.S. and overseas, tensions between Hong Kong and China, and soft business confidence around the world. If none of these go terribly wrong, 2019 is on track to be in the top 25% of S&P 500 stock market returns since 1988[2].

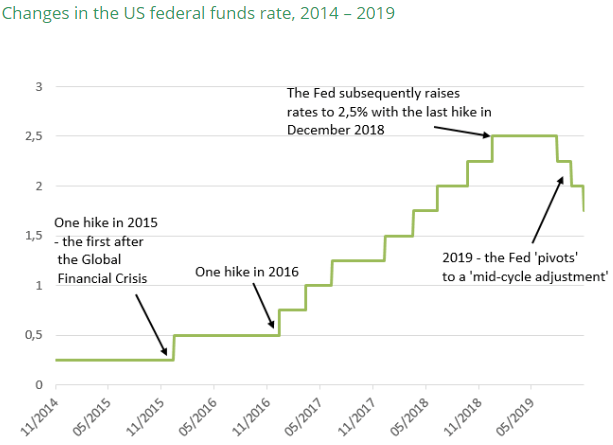
Amid this backdrop of relative stability, the Federal Open Market Committee (FOMC) lowered its short-term target interest rate for the third time in 2019 to a range of 1.5% to 1.75%[3]. Fed Chairman Jerome Powell stated that U.S. economic growth is steady despite continued weakness in business investment and exports, and core inflation is running below the Fed’s 2% target. The October rate cut was characterized as the final ‘midcycle adjustment’ to help support the maturing U.S. economic expansion. Chairman Powell indicated the FOMC will continue to monitor economic activity to determine the appropriate level of the federal funds rate going forward. His remarks did not include previous language about the Fed acting “as appropriate to sustain the expansion”, causing market watchers to expect a pause in rate changes going forward.

Source: BNP Paribas Asset Management, Bloomberg as of 11/4/2019

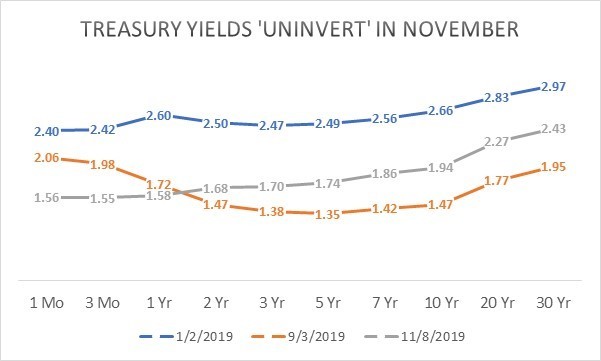
In the days following the rate cut, intermediate and longer-term Treasury yields rose, reversing the yield curve inversion seen for much of 2019 and signaling diminishing investor expectations for a near-term recession.

The return to an upwardly-sloping yield curve is a relief to market watchers. A healthy banking system requires short term rates to be lower than long term rates for banks to maintain consistent profit margins. Higher long-term yields encourage investors to take a longer-term perspective and make more strategic investments. Institutions such as pension plans also have a better chance of satisfying their obligations to future retirees. In general, financial markets do a much better job allocating capital when short-term interest rates are lower than long term rates.

Source: www.treasury.gov

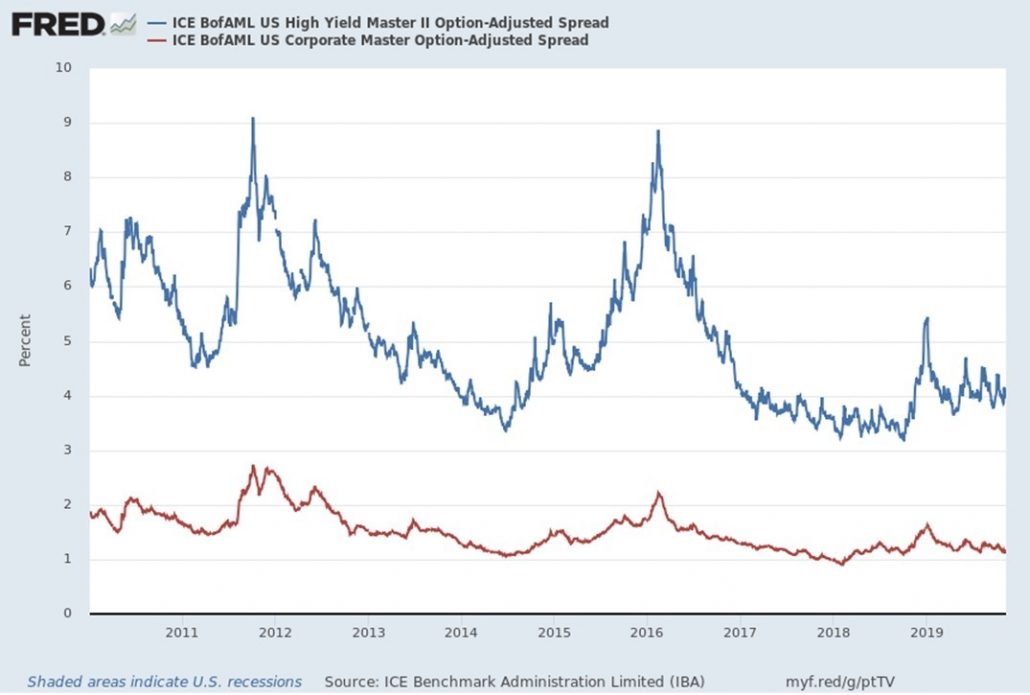
Looking beyond Treasuries, corporate bond yield spreads have drifted back toward the extremely low levels seen in early 2018. This is another indication that investors are comfortable taking risk right now. At Warren Street Wealth Advisors, we’re watching for excessive risk taking which could mean an asset price ‘bubble’ and potentially the end of the stock and bond rally. The occasional drops in market prices we see from time to time are a healthy sign that investors are making rational decisions rather than reckless speculation.

Corporate bond risk premiums drift near historic lows

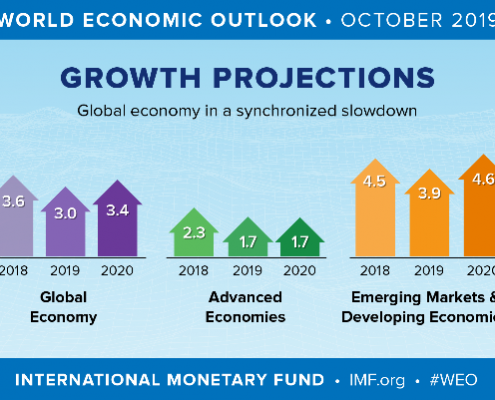
Let’s not forget the global economy, which the Fed has often mentioned as one reason for reducing interest rates this year. Though the data remains mixed, the International Monetary Fund is forecasting global GDP to close 2019 up 3%, with the U.S. at 1.7% and Emerging and Developing Economies up nearly 4%[4]. The IMF expects global growth to improve in 2020 to 3.4% as Europe adjusts to the new tariff landscape and political uncertainties diminish.

Global GDP projected to remain low but positive

A global recession is highly unlikely through the end of 2020 and probably longer, but there are significant risks to this outlook! The IMF is urging political leaders to defuse trade tensions and reinvigorate multilateral cooperation, rather than focus solely on accommodative monetary policy to keep the world economy afloat.

Bottom line: The U.S. economic expansion remains on track and should end the year well, barring significant missteps in the global economic and political landscape. Though it’s been a bumpy ride, investors are likely to close the books on 2019 with healthy profits from both stocks and bonds, and meaningful progress toward achieving their financial goals.

Marcia Clark, CFA, MBA

Senior Research Analyst, Warren Street Wealth Advisors


DISCLOSURES

Investment Advisor Representative, Warren Street Wealth Advisors, LLC., a Registered Investment Advisor

The information presented here represents opinions and is not meant as personal or actionable advice to any individual, corporation, or other entity. Any investments discussed carry unique risks and should be carefully considered and reviewed by you and your financial professional. Nothing in this document is a solicitation to buy or sell any securities, or an attempt to furnish personal investment advice. Warren Street Wealth Advisors may own securities referenced in this document. Due to the static nature of content, securities held may change over time and current trades may be contrary to outdated publications.

Form ADV available upon request 714-876-6200

Growth stocks take the lead year-to-date


[1] Performance represented by ETFs designed to track various market segments: SPY (S&P 500), AGG (Barclay’s Aggregate Bond index), EEM (emerging markets equity), EFA (developed international equity), GLD (gold prices)

[2] Source: www.stockcharts.com

[3] https://www.federalreserve.gov/monetarypolicy/files/monetary20191030a1.pdf

[4] https://www.imf.org/en/Publications/WEO/Issues/2019/10/01/world-economic-outlook-october-2019

September 2019 Market Review

With competing economic data, where should investors turn?

Oil shocks, impeachment, and Brexit – Oh My!

Key Takeaways

  • U.S. stock and bond markets closed the 3rd quarter with an impressive – though volatile – year-to-date return. The S&P 500 index ended September up nearly 19%, the best 3-quarter return since 1997, while the Barclays Aggregate Bond index posted an outstanding return near 8%.
  • Economic data remained mixed. The U.S. Consumer Confidence index fell by -9.1%, much more than expected, but unemployment fell to 3.5%, the lowest in 50 years.
  • The House of Representatives initiated an impeachment investigation of President Trump after a ‘whistleblower’ leaked information about the President asking Ukrainian officials to investigate Democratic candidate Joe Biden’s son.
  • Drone strikes on Saudi Arabian oil installations shut down 50% of Saudi oil production, about 5% of world production, briefly sending oil prices off the rails and adding to recession fears.
  • Prime Minister Boris Johnson was deemed to have acted illegally by shutting down the U.K. Parliament, putting pressure on him to come to a Brexit resolution with the European Union.
  • Conclusion: The U.S. economy remains on track for a good year. Despite the markets’ willingness to shrug off trade wars and geopolitical uncertainty, significant challenges are still out there. Investors should prepare  for renewed market turbulence as these issues resolve themselves over the coming months.

Stock and bond markets rebound from August’s slump

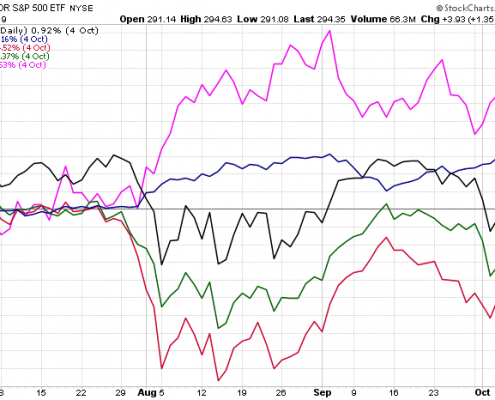
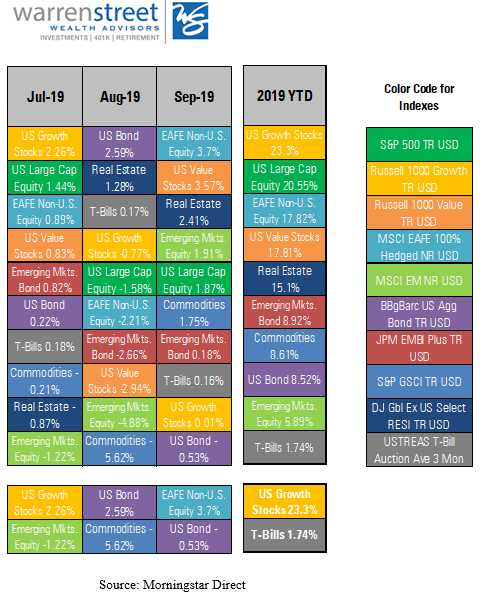
The 3rd quarter was quite a roller coaster ride! Gold and other ‘safe’ assets were the go-to market segments for the quarter. Gold led the way with a return of +4.26%[1], despite a slip in late September. U.S. bonds took second place, edging out U.S. stocks with a return of 2.34% versus 1.75%. International stocks were the top performers in September at +3.7%, but continued to lag the U.S. for the quarter at -0.79%. Emerging markets equities were in second place for the month at +1.91%, but are far behind for the year and quarter, losing -4.75% between July 1st and September 30th.

Market returns 7/1/2019 – 10/4/2019

https://stockcharts.com/h-perf/ui

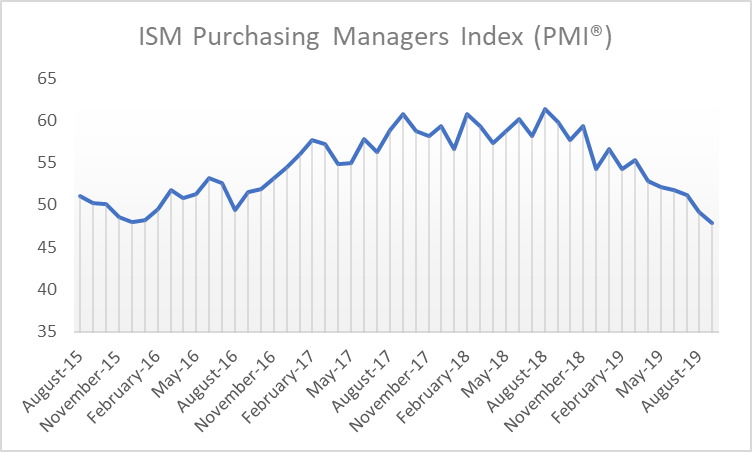
The financial markets continued to react strongly to economic news and geopolitical events, though the magnitude of the swings began to subside. This moderation is a bit surprising given the unexpected -9% drop in Consumer Confidence and the Purchasing Manufacturers Index falling to its lowest level since June 2009. But investor fatigue is bound to set in sooner or later, and current events just seem to build on a base with which investors have become wearily familiar.

Source: https://ycharts.com/indicators/us_pmi

The economy created only 136,000 new jobs in September – certainly nothing to brag about, but good enough this late in the expansion. At the same time, the unemployment rate fell to 3.5% – the lowest in half a century – and the overall employment ratio increased to 61%, the highest since December 2008. Apparently, the U.S. job market is alive and well…at least for the time being.

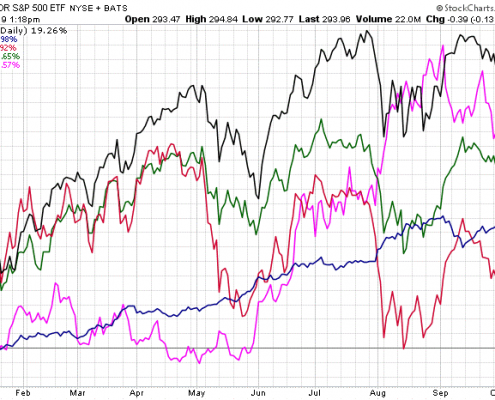
Despite competing political and economic pressures, U.S. and developed international stock markets are on track for a very strong year. As of October 7, the S&P 500 was up more than 19%, gold was up over 16%, and the Europe, Australasia, and Far East index was up nearly 12%. But be wary of another 4th quarter slump like we saw in 2018! Given mixed economic data, the impeachment inquiry of President Trump, and continuing trade tensions, any of these could derail the markets – at least temporarily – between now and December 31st.

Market returns 1/1/2019 – 10/4/2019

https://stockcharts.com/h-perf/ui

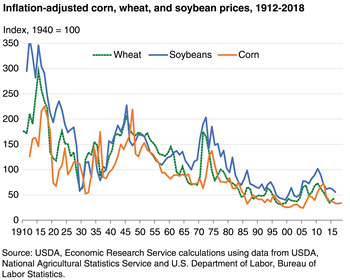
One of the less-reported casualties in the U.S.-China trade war is the agricultural sector. Inflation-adjusted prices for corn, wheat, and soybeans have been declining for decades, largely due to increased productivity and reduced global population growth. Add trade tariffs and the wettest 12 months on record[3], and farmers are facing a ‘perfect storm’ of negative events. Smaller farms are going out of business, and the number of farms in the U.S. is heading below 2 million, the lowest in nearly a century.

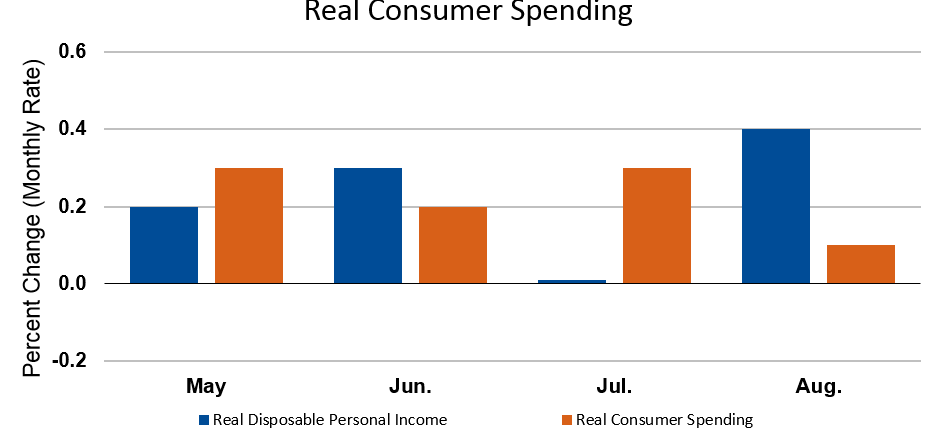
But despite the significant challenges facing the agriculture and manufacturing sectors, the U.S. economy is holding steady. Personal income and consumer spending rose in August for the second month in a row. Retail sales were good, and housing showed signs of renewed activity.


As reported by the Wall Street Journal on September 25, U.S. home-price growth is slowing and mortgage rates are historically low at around 4%[4]. With such low interest rates, home price affordability remains within reach as indicated by the sharp drop in the Case-Shiller Home Price Index in 2019, shown on the chart above.

Forecasters expect housing to contribute slightly to GDP for the first time since 2017 as home sales and construction increased in August.

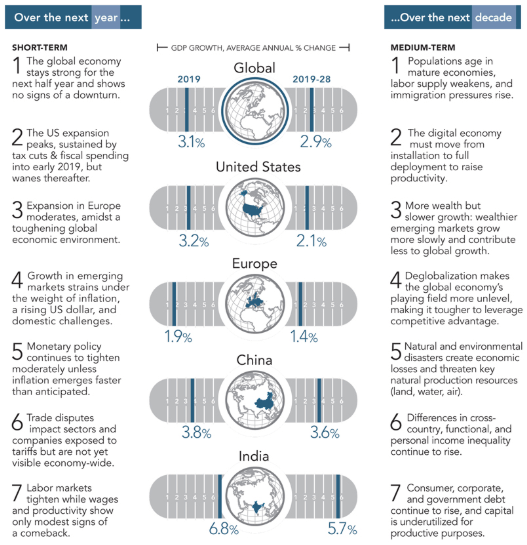
With so much going on in the world, it’s hard to know which direction to turn! For a straightforward summary of the likely impact of these competing economic factors on global growth, we refer you to the graphic below prepared by The Conference Board (publisher of the Leading Economic Indicator index.)

The Conference Board economic outlook

Bottom line: the U.S. economy is on track for solid growth in 2019, slowing somewhat thereafter. A recession is not in the forecast for the next 12 months, though demographic factors point to slower growth worldwide in the coming years.

Given the myriad challenges facing the global economy right now, negative surprises are definitely a possibility as we navigate the final quarter of 2019. Investors may just have to close their eyes, hold on tight to a prudent investment plan, and ride out the inevitable turbulence in the coming months.

Marcia Clark, CFA, MBA
Senior Research Analyst, Warren Street Wealth Advisors


DISCLOSURES

Investment Advisor Representative, Warren Street Wealth Advisors, LLC., a Registered Investment Advisor

The information presented here represents opinions and is not meant as personal or actionable advice to any individual, corporation, or other entity. Any investments discussed carry unique risks and should be carefully considered and reviewed by you and your financial professional. Nothing in this document is a solicitation to buy or sell any securities, or an attempt to furnish personal investment advice. Warren Street Wealth Advisors may own securities referenced in this document. Due to the static nature of content, securities held may change over time and current trades may be contrary to outdated publications.

Form ADV available upon request 714-876-6200

[1] Performance represented by ETFs designed to track various market segments: SPY (S&P 500), AGG (Barclay’s Aggregate Bond index), EEM (emerging markets equity), EFA (developed international equity), GLD (gold prices)

[2] Performance represented by ETFs designed to track various market segments: SPY (S&P 500), AGG (Barclay’s Aggregate Bond index), EEM (emerging markets equity), EFA (developed international equity), GLD (gold prices)

[3] https://www.wsj.com/graphics/us-farmers-miserable-year/?mod=article_inline&mod=hp_lead_pos5

[4] https://blogs.wsj.com/economics/2019/09/25/newsletter-housings-maybe-rebound-chinas-decoupling-warning-and-consumers-cloudy-crystal-ball/?guid=BL-REB-39607&dsk=y

April 2019 Market Commentary

April 2019 Market Commentary

Key Takeaways

    • 1st quarter GDP beat expectations at 3.2%, due in part to increasing net exports and inventories
    • The U.S. stock market reached new highs as economic data and corporate earnings were stronger than expected, though stock prices of companies with disappointing results have been punished
    • Despite slowing GDP in China and continuing budgetary and political challenges throughout Europe, economic growth overseas remains modestly positive
    • The Conference Board’s Leading Economic Indicators Index® increased in February and March, though is expected to weaken slightly going forward; new home sales and job growth beat expectations
    • Though central banks are on hold for now, interest rate ‘normalization’ will resume when inflation gains traction, which could happen later this year due to tight labor markets and rising commodity prices
  • Conclusion: Enjoy the party! Global stock markets have had a good run so far, and recent earnings announcements and economic data suggest a positive environment for the rest of the year.

The death of the U.S. economy has been greatly exaggerated.

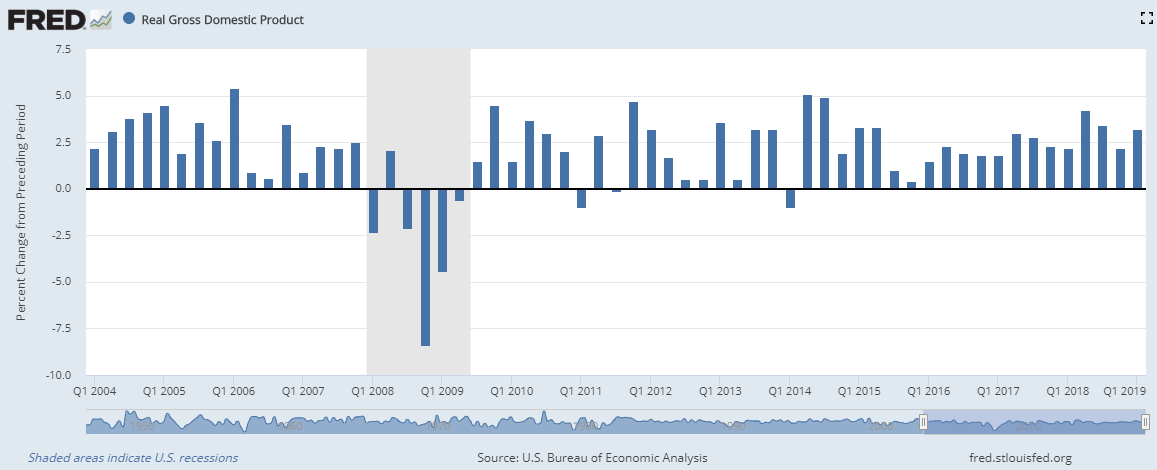
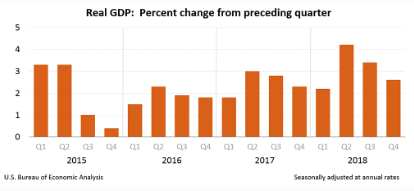
1st quarter GDP beat expectations at 3.2%, due in part to increases in net exports and inventories. This strong growth came despite the consensus view earlier in the year that the U.S. economy was nearing a recession. In fact, the U.S. economy is still benefiting from several sources of stimulus such as low interest rates, 2017 corporate tax cuts, and deregulation. While it’s unlikely we’ll see such strong GDP numbers going forward, there’s no sign yet that these supportive factors have fully played themselves out.

Time to celebrate! The U.S. economy is not dead!

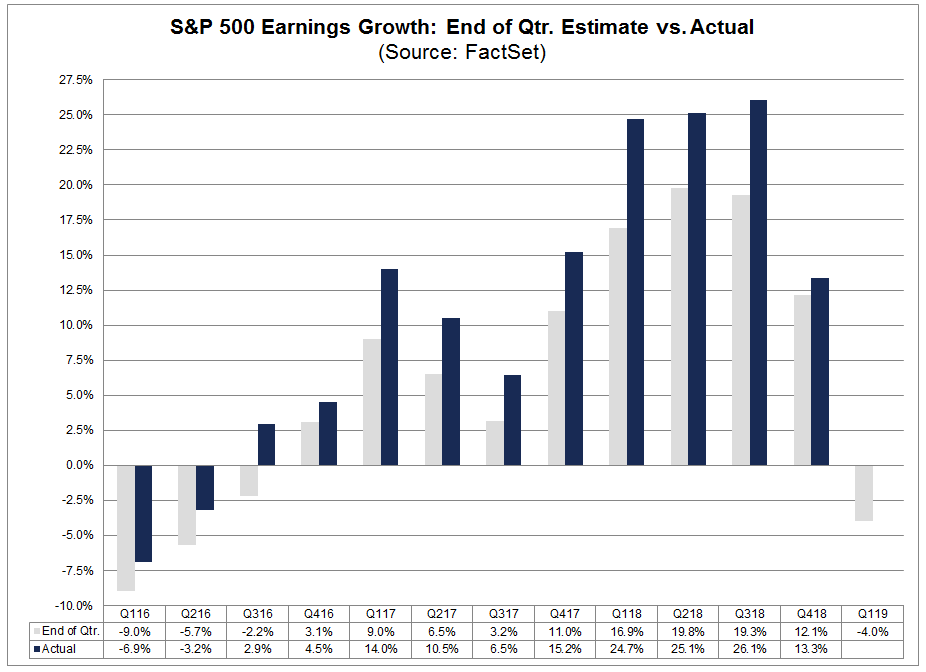
The strong GDP growth was also reflected in the U.S. stock market.  As of April 26, 77% of S&P 500 companies reporting actual earnings during the 1st quarter of 2019 were higher than expected. The chart below compares projected quarterly corporate earnings (gray bar) to actual earnings (blue bar) over the past few years. Actual earnings surpassed estimated earnings in the 4th quarter of 2018 and are looking to do the same in the 1st quarter of 2019. Add to this the size of the positive surprise so far in 2019 being larger than the historical average, and you have the U.S. stock market hitting new highs in April.

But it isn’t all roses and sunshine. The U.S. stock market has rewarded upward earnings surprises for sure, but has been unusually harsh with companies reporting disappointing earnings. According to the Wall Street Journal, the stock price of companies reporting actual earnings below estimates has fallen an average of 3.5% in the two days before and after their earnings announcement, compared to a historical average decline of only 2.5%. Investors don’t seem convinced that corporate profits are going to continue to grow.

One indicator of this lack of trust in the strength of the economy is very low bond yields. Despite decent earnings growth and high stock prices, the yield on the 10-year Treasury bond remains very low at about 2.5%, barely above inflation. The fact that investors are willing to buy bonds at this very low yield indicates skepticism about where the global economy is headed and how quickly we’re likely to get there.

Countries outside the U.S. are also facing economic uncertainty. Europe continues to struggle with trade tariffs and political unrest, and tensions between the U.S. and China remain unsettled. The U.K. hasn’t yet figured out how to exit the European Union gracefully, Italy missed its budget deficit target (again), and business sentiment in Germany is falling.

One bright spot is stronger-than-expected first quarter growth in China. But international investors are now worried that Chinese authorities will slow the pace of policy easing and the economy will fall back. While Europe and the U.K. seem to be navigating their challenges well enough, heaven help us if the expected resolution of the U.S.-China trade talks gets derailed! Given the uncertain state of global economies, skittish investors may run for the sidelines at the slightest negative news about escalating trade tensions.

But don’t let me be a ‘Debbie Downer’! Global stock markets are doing great so far this year.

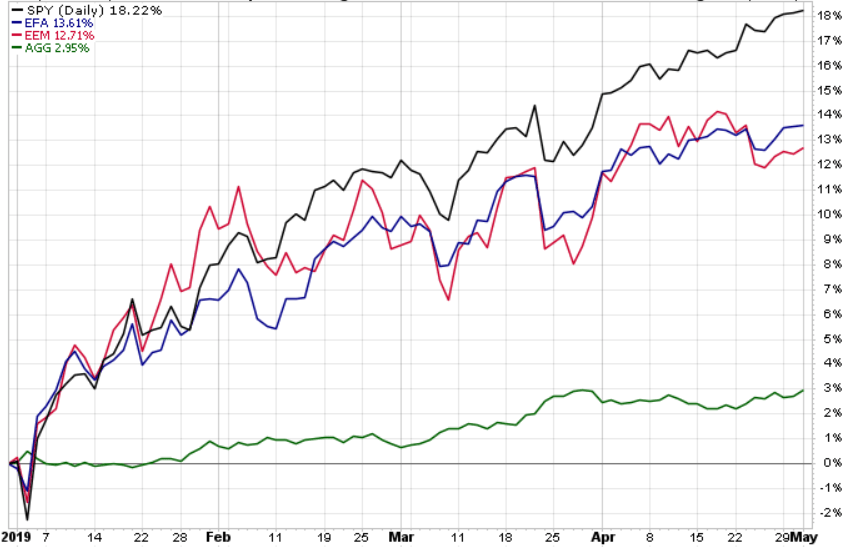
If the year ends with no more gains than we already have, the S&P 500 return for the first four months of 2019 will be in the top third of historic returns for an entire year. As you can see in the graph below, developed and emerging global markets are also having a good run in 2019 (blue and red lines). Even bond market returns are positive, as shown by the green line at the bottom of the graph.

https://stockcharts.com/h-perf/ui


There is one cautionary note on the U.S. stock market, however: higher-than-average stock valuations. According to Factset, the forward 12-month Price/Earnings ratio for S&P 500 companies has risen to 16.8. This is higher than both the 15-year and 10-year average, and a signal that the market may not have much more room to run.

So far, so good…but for how long?

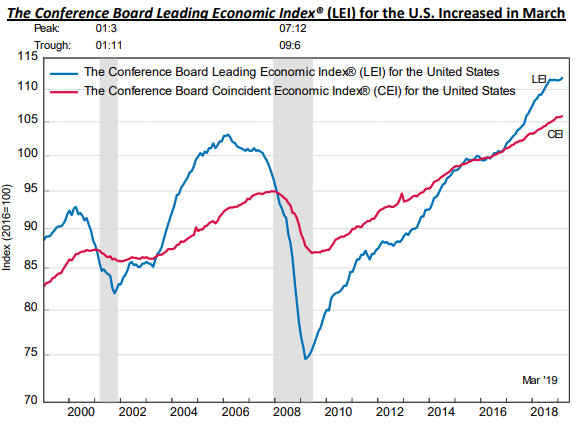
In mid-April the Conference Board announced its Leading Economic Indicators Index® (LEI) for the 1st quarter of 2019. The LEI posted a gain of 0.4% in March after increasing 0.1% in February, primarily due to strength in the labor markets, improved consumer outlook, and better-than-expected financial conditions. Eight out of the 10 LEI factors were positive in March, with 2 factors holding steady (average weekly manufacturing hours and building permits.) New home sales also rose unexpectedly in March, the third gain in a row. The three-month average sales rate is close to its best since December 2007.

Despite the recent strength in economic data, the trend in the LEI is leveling out, suggesting the U.S. economy will slow toward its long-term potential growth rate of about 2% by year end. This trend is reflected in the reduced pace of home price appreciation in March and a slight drop in labor participation.

The Fed echoed this ‘slow growth’ story in the statement released after the May 1st FOMC meeting. The committee highlighted a slowdown in household spending and business investment, as well as inflation below its 2% target, but indicated this weakness was probably “transient” and short term rates were appropriate at the current level.

All in all, the data continue to support the conclusion we’ve been talking about since late 2018 – the U.S. economy is slowing, but a recession is not imminent. In fact, the surprise that might spook investors later this year isn’t recession, but inflation.

With stronger than expected economic data so far in 2019, is inflation around the corner?

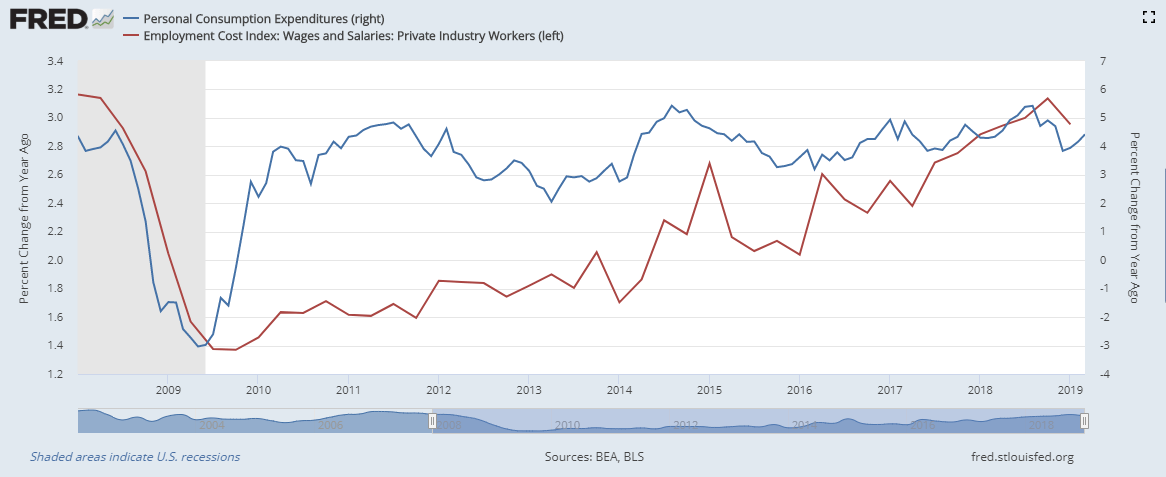
The tight labor market and increasing commodity prices might catch up with us later this year. As shown on the graph below, the cost of personal consumption has fallen recently but ticked up again in March (blue line). The Employee Compensation Index increased 0.7% for the quarter, though the 12-month growth rate slowed a bit (red line.) And the job report released in early May reported non-farm payrolls up 263,000, while the unemployment rate fell to 3.6%, the lowest level since 1969. It’s reasonable to expect higher wages to boost consumer purchases going forward, which may enable businesses to pass the increased labor cost on to consumers.

If you add increasing commodity prices such as oil (red line) and copper (blue line) to the rising wage trend, we may finally see the increase in inflation many of us have been watching for during the past few years of the economic recovery.

What is the end result? If commodity prices remain high and sales of goods and services absorb price pressure from increased labor and input costs (inflation), the Fed may have to revisit its mission to ‘normalize’ interest rates to keep the U.S. economy from overheating later this year. Market participants aren’t expecting this. Investors tend to react badly when caught by surprise, so we’re keeping a close watch on the data in the hope of being one step ahead of the crowd when the time comes to head for the exits.

Source: https://www.cmegroup.com/trading/interest-rates/countdown-to-fomc.html

Conclusion: Enjoy the ride! (for now)

While we can’t predict when the party will end, that’s no reason not to enjoy ourselves in the meantime. A higher proportion of people are participating in the workforce than at any time since the 2008-2009 recession. Wages are rising, political tensions are easing, corporate profits aren’t as bad as feared, and interest rates remain low. What’s not to like?!

Just keep an eye out for warning lights as we get closer to the end of the year.

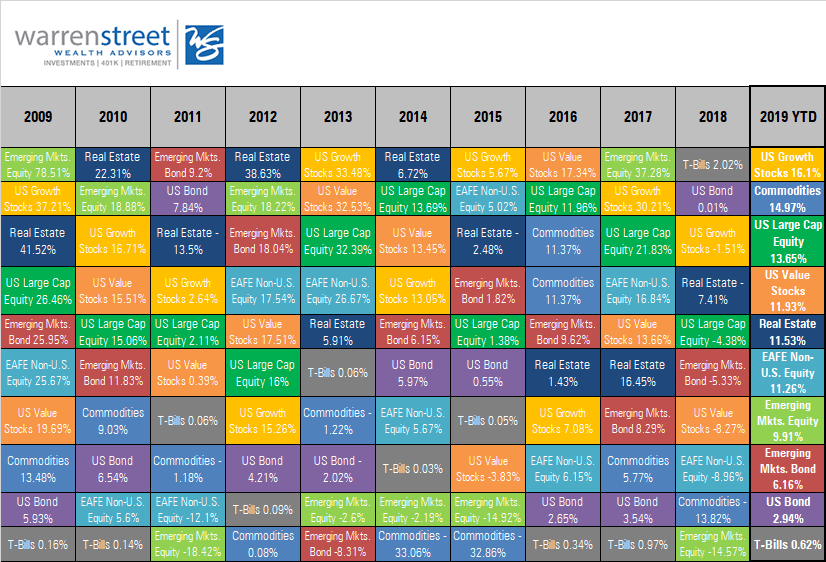
ASSET CLASS and SECTOR RETURNS as of APRIL 2019

Source: Morningstar Direct

Source: S&P Dow Jones Indices


Marcia Clark, CFA, MBA
Senior Research Analyst
Warren Street Wealth Advisors

Warren Street Wealth Advisors, a Registered Investment Advisor. The information contained herein does not involve the rendering of personalized investment advice but is limited to the dissemination of general information. A professional advisor should be consulted before implementing any of the strategies or options presented. Any investments discussed carry unique risks and should be carefully considered and reviewed by you and your financial professional. Past performance may not be indicative of future results. All investment strategies have the potential for profit or loss. 


DISCLOSURES

Investment Advisor Representative, Warren Street Wealth Advisors, LLC., a Registered Investment Advisor


The information presented here represents opinions and is not meant as personal or actionable advice to any individual, corporation, or other entity. Any investments discussed carry unique risks and should be carefully considered and reviewed by you and your financial professional. Nothing in this document is a solicitation to buy or sell any securities, or an attempt to furnish personal investment advice. Warren Street Wealth Advisors may own securities referenced in this document. Due to the static nature of content, securities held may change over time and current trades may be contrary to outdated publications.

Form ADV available upon request 714-876-6200


March 2019 Market Commentary

Key Takeaways

    • The rally in U.S. stocks slowed in March but still posted the best 1st quarter in recent memory at 13.65%, though stock markets remain volatile as investors seem to overreact to fears of the Fed increasing interest rates too much or not increasing rates at all
    • A slightly better-than-expected jobs report for March helped calm fears about mixed economic data in the U.S., supporting the Fed’s decision to keep short-term interest rates low for the foreseeable future
    • The OECD lowered its forecast for European GDP growth to a paltry 1.0% in 2019 and 1.2% in 2020; German government bonds fell into negative territory after the ECB reported weak manufacturing data
    • Overall, improved labor conditions, lower headline inflation, and accommodative monetary policy should help support real income growth and household spending in most developed countries


  • Conclusion: Recent market swings seem driven more by fear than by fundamentals. Economic data isn’t great, but the data doesn’t support a forecast for a global recession; U.S. markets are likely to hang on to gains until or unless weakness in the economy becomes more clear.


Is the U.S. economy getting better? Or getting worse?

The S&P 500 had its best 1st quarter return in recent memory, yet the Federal Reserve Bank kept interest rates low to avoid derailing the economy. Which of these forward-looking indicators is correct? To answer this question, let’s start at the beginning. You may have learned in school that GDP – the primary measure of economic strength – is simply the value of all goods and services sold in a country over a given period of time. In essence, GDP represents the value of business transactions. These transactions flow into company financial statements and impact the ability of these companies to pay dividends or launch new ventures. This increased cash flow is recognized by investors, who become willing to pay more for shares of those businesses in the stock market, pushing stock prices up. If the economy is up, stock prices are up too.

Easy, right? All the dominoes line up and we understand how the market works…or maybe not?

Here is the conundrum: stock prices are a ‘leading economic indicator’ because investors buy today expecting gains in the future. Interest rates are also leading indicators because investors need to forecast future interest rates – which typically move up and down with economic activity – before they’re willing to tie up their money for 10 or 20 years. Stock and bond prices don’t usually go up together.

Source: https://www.pimco.com/en-us/resources/education/everything-you-need-to-know-about-bonds

If interest rates go up, prices of existing fixed-rate bonds go down in order to compete with new bonds issued with higher coupon (interest) rates. But rising interest rates usually indicate more demand for funds, which is often associated with a strong economy, which means more profits, and consequently higher stock prices.

The upshot of all this is when stock prices go up, bond prices are usually flat or negative. Conversely, when stock prices go down, bond prices are usually positive as investors sell volatile stocks and seek safer assets such as government bonds.

Source: https://stockcharts.com/h-perf/ui

As you can see from the chart above, bond prices as represented by the long-term Treasury ETF (ticker ‘TLT’ – blue line) usually go up when stock prices go down (represented by the Dow Jones Industrial Average – black line), and vice versa. This effect was particularly dramatic during the 4th quarter of 2018.

Despite the strong start for stocks in 2019, if you look back 6-months from October to March, bonds have been among the best performing asset classes. Bonds may not be sexy, but they sure are welcome when markets get rough! But wait – look at the red box in February and March. Bond and stock prices are moving together. Why??

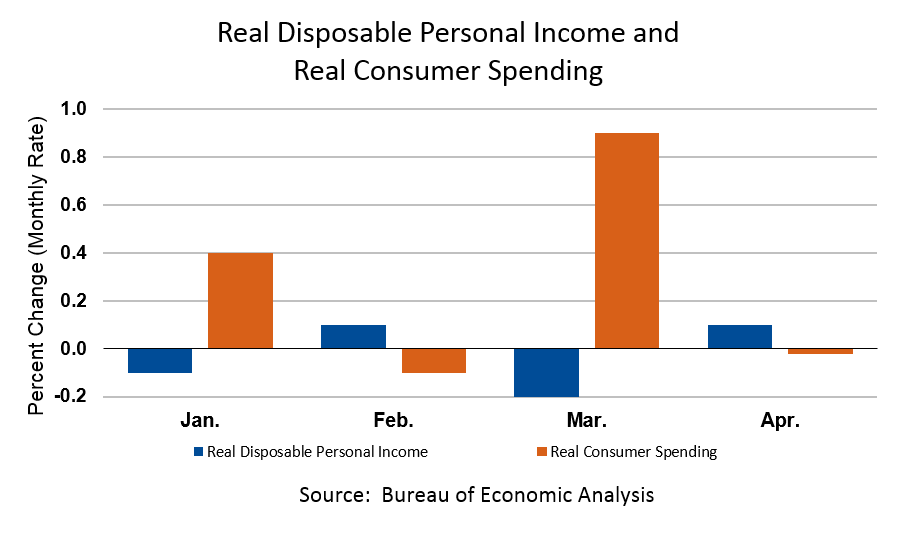
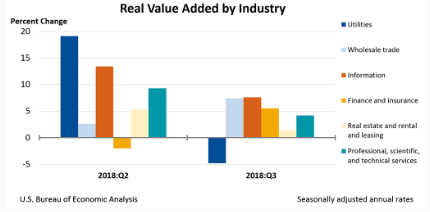
The charts below from the Bureau of Economic Analysis may hold some of the answers. In a nutshell, the problem is Change. And I don’t mean the kind of change you find in your sofa cushions…

Chart 1: The U.S. economy is growing, but slower than in recent quarters.


Consumer spending takes a breath after spiking in April

Chart 2: Disposable income is increasing, but consumer spending is down.

Chart 3: Companies are adding value to GDP, but at a slower pace than previously.

The economic data is okay, but clearly slowing from the strong levels of 2017-2018. Does ‘slowing’ economic activity mean a recession is around the corner? I don’t think so, and many commentators are coming around to this view. What’s really moving the market, then? In addition to economic fundamentals, the stock market seems to be overreacting to the possibility of interest rates going up…or going down. Does being afraid of both situations make any sense? Probably not.

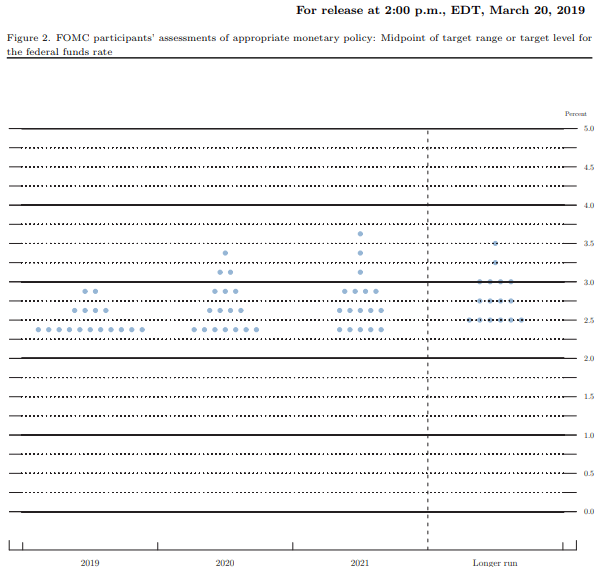
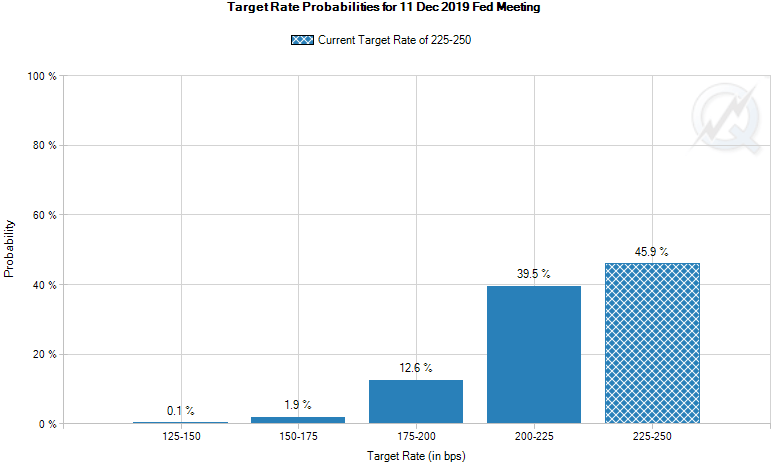
If the Fed increases rates too aggressively, they could indeed stall the economy. But we should take comfort in the persistent ‘data dependent’ stance of the Fed. They have no intention of being aggressive with interest rate hikes, so the stock market should probably find something else to worry about. In fact, institutional investors seem to agree that short-term rates are going nowhere any time soon. Federal Funds futures contracts are predicting the Fed will decrease rates by the end of 2019, though the Fed’s own ‘dot plot’ shows a possibility of one rate increase by the end of the year.

Source: https://www.cmegroup.com/trading/interest-rates/countdown-to-fomc.html

Source: https://www.federalreserve.gov/monetarypolicy/files/fomcprojtabl20190320.pdf

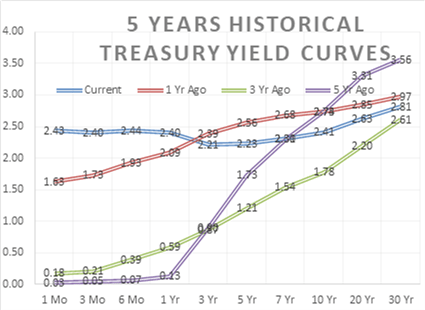
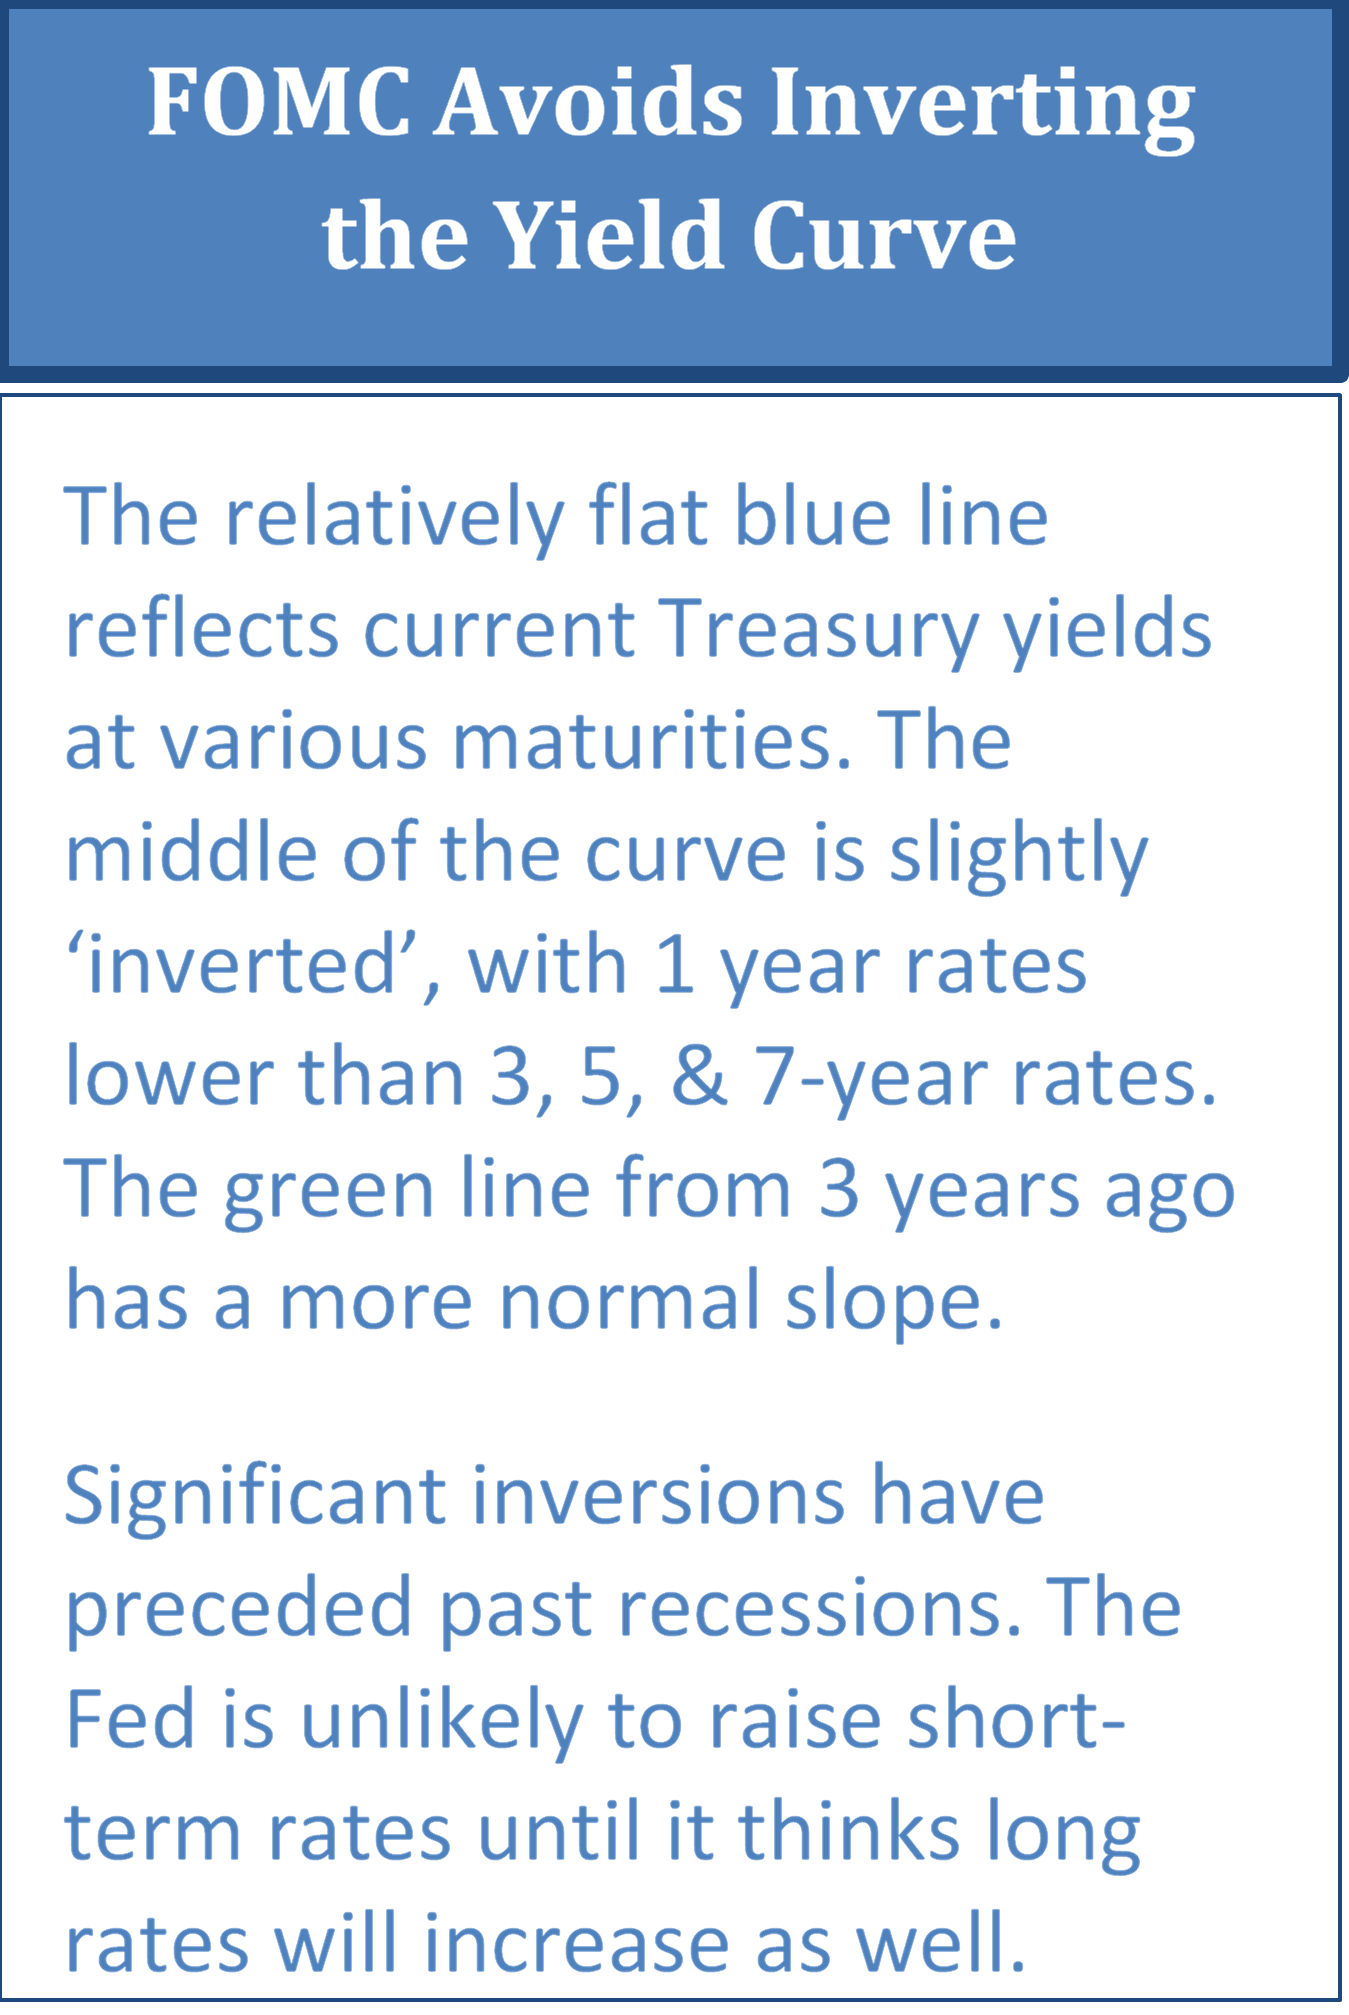
The Fed is also cautious about raising short-term rates too quickly and causing the Treasury yield curve to become ‘inverted’. An inverted yield curve is one where short-term interest rates are higher than longer term rates. This isn’t normal! Investors and lenders usually require higher rates to lock up their money for a longer period of time. An inverted curve is usually driven by…here’s that word again…Change.

The yield curve can invert under three basic scenarios:


  • The Fed is aggressively increasing short-term interest rates to cool down an overheated economy


  • Investors are demanding less return for longer maturities because they believe inflation, and consequently future interest rates, will be lower than they are currently


  • Differing supply and demand pressures on the short and long portions of the yield curve, sometimes driven by interest rate differentials between the U.S. and other developed countries


An inverted yield curve has preceded many recessions in the past few decades, which is why it makes people uncomfortable. But the inversion has happened as much as 2 years before the recession, so I’m not sure that the curve is actually predicting anything. It’s more helpful to analyze the economic situation driving the curve shape, rather than drawing conclusions from the curve alone. You might take comfort in knowing that post-inversion recessions have only happened when the 10-year Treasury yield was at least 0.50% below the Fed Funds rate, which we’re nowhere near. Right now my money is on Option #3 – a supply demand imbalance, not an imminent recession. Nonetheless, the current Treasury curve is slightly inverted between the 1 year and 5 year maturities and the Fed doesn’t want it to get worse and spook investors.

Source: Morningstar.com

It doesn’t make much sense for investors to be afraid of interest rates going up and also afraid of interest rates going down. But that seems to be the case at the moment and is a key driver of recent volatility in the U.S. stock market. Let’s be ‘data dependent’ for a minute and draw our own conclusions based on what we can see in the global economic landscape:

  1. The Fed is being cautious about raising or lowering interest rates because economic data doesn’t point strongly either up or down and they don’t want to spook the financial markets
  2. Though corporate earnings forecasts are lower than 2018, the majority of S&P 500 companies reporting slower earnings projections for the 1st quarter of 2019 have experienced positive stock price movement; S&P 500 gains year-to-date have been felt broadly across many sectors
  3. U.S. manufacturing output slipped to its lowest level in 2 years, despite trade tensions between the U.S. and China moderating somewhat rather than getting worse
  4. Challenges persist overseas, particularly in Europe, as trade tariffs hit European and Asian businesses harder than the U.S.; factory output in the Eurozone fell in March at the fastest pace in 6 years
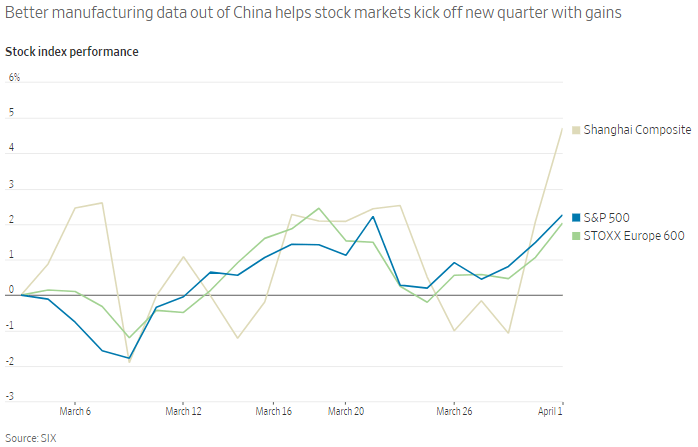
  5. Manufacturing data in China, the second largest economy in the world, was stronger than expected in March; the Chinese economy is expected to slow to a still robust 6% GDP growth in 2019 and beyond
  6. European markets are stabilizing as the U.K. Parliament seems to be making progress identifying a viable ‘Brexit’ strategy; economic disaster in Europe due to stalled trade with Britain seems unlikely
  7. Trade tariffs aside, improved labor conditions, lower headline inflation, and accommodative monetary policy should help support real income growth and household spending in most developed countries
  8. Emerging economies are avoiding much of the global slowdown as many smaller countries benefit from strong capital investment, improving income growth, and economic and political reforms in recent years

What conclusions can we draw from all this data?

The economic data is certainly mixed, but most indicators point to slower growth in 2019, not a recession. From what we can see today, global economies, and consequently financial markets, should stay in modestly positive territory for the near term. We can sleep well at night knowing the ship is headed in the right direction…for now.


ASSET CLASS and SECTOR RETURNS as of MARCH 2019

Source: Morningstar Direct

Source: S&P Dow Jones Indices

Marcia Clark, CFA, MBA
Senior Research Analyst
Warren Street Wealth Advisors

Warren Street Wealth Advisors, a Registered Investment Advisor. The information contained herein does not involve the rendering of personalized investment advice but is limited to the dissemination of general information. A professional advisor should be consulted before implementing any of the strategies or options presented. Any investments discussed carry unique risks and should be carefully considered and reviewed by you and your financial professional. Past performance may not be indicative of future results. All investment strategies have the potential for profit or loss. 

DISCLOSURES

Investment Advisor Representative, Warren Street Wealth Advisors, LLC., a Registered Investment Advisor


The information presented here represents opinions and is not meant as personal or actionable advice to any individual, corporation, or other entity. Any investments discussed carry unique risks and should be carefully considered and reviewed by you and your financial professional. Nothing in this document is a solicitation to buy or sell any securities, or an attempt to furnish personal investment advice. Warren Street Wealth Advisors may own securities referenced in this document. Due to the static nature of content, securities held may change over time and current trades may be contrary to outdated publications.

Form ADV available upon request 714-876-6200


Market Volatility – “A Few Minutes with Marcia”

Volatility measures the frequency and magnitude of price movements, both up and down, that a financial instrument experiences over a certain period of time. The more dramatic the price swings, the higher the level of volatility.

Learn the basics of market volatility with Marcia Clark, CFA, MBA.

Watch:

For those who prefer to read!

Welcome to A Few Minutes with Marcia. My name is Marcia Clark, Senior Research Analyst at Warren Street Wealth Advisors. Today we’re going to talk about the 4th quarter 2018 stock market dive and 1st quarter 2019 rebound in an attempt to understand more about market volatility.

Prior to 2018, the stock market had experienced 2 years of unusually low volatility, despite a few bumps along the way. After a mixed start to 2018, the Dow Jones Industrial Average looked like it was back to its winning ways, then came the 4th quarter tumble. Investors were caught by surprise by the huge swings in market prices – volatility – and started selling stocks like crazy. To better understand these market dynamics, let’s put the recent activity into context.

You may have heard of a common measure of market volatility called the ‘VIX’ – the Chicago Board Options Exchange volatility index. The VIX measures expected future volatility by evaluating the prices of put and call options traded on the exchange. If you’re looking at the slideshow, you can see how much calmer the VIX index was during the quiet years of the stock market, especially in 2017. As the market swooped up in late 2017, expected future volatility spiked shortly thereafter – remember that volatility can spike when prices go up as well as down.

When the market gave back some of its gains in early 2018, the volatility index fell back as well. Then came the market tumble in late 2018. The VIX index starts jumping around like a Richter scale during an earthquake. As we move into 2019, even with the recent pick up in volatility the graph shows that the VIX is at a pretty normal level compared to prior years. We’re just not used to ‘normal’ volatility anymore.

Where do we go from here? No one knows for sure, and if anyone says they can predict the future they’re kidding themselves and their clients. What we can say is that financial markets react to rumors and headlines, many of which don’t fundamentally change the financial landscape. This ‘knee jerk’ reaction causes market volatility, and this volatility is normal. In fact, active investment managers appreciate market volatility, because market dips based on headlines rather than fundamental changes in the economic landscape give investors with a strong stomach and an evidence-based outlook the ability to buy good assets at cheap prices. If all goes well, those assets will recover their value plus more over time, and patient investors will be rewarded.


Marcia Clark, CFA, MBA
Senior Research Analyst
Warren Street Wealth Advisors

Warren Street Wealth Advisors, a Registered Investment Advisor. The information contained herein does not involve the rendering of personalized investment advice but is limited to the dissemination of general information. A professional advisor should be consulted before implementing any of the strategies or options presented. Any investments discussed carry unique risks and should be carefully considered and reviewed by you and your financial professional. Past performance may not be indicative of future results. All investment strategies have the potential for profit or loss. 


DISCLOSURES

Investment Advisor Representative, Warren Street Wealth Advisors, LLC., a Registered Investment Advisor

The information presented here represents opinions and is not meant as personal or actionable advice to any individual, corporation, or other entity. Any investments discussed carry unique risks and should be carefully considered and reviewed by you and your financial professional. Nothing in this document is a solicitation to buy or sell any securities, or an attempt to furnish personal investment advice. Warren Street Wealth Advisors may own securities referenced in this document. Due to the static nature of content, securities held may change over time and current trades may be contrary to outdated publications.

Form ADV available upon request 714-876-6200

The IRA and the 401(k)

The IRA and the 401(k)

Comparing their features, merits, and demerits. 

How do you save for retirement? Two options probably come to mind right away: the IRA and the 401(k). Both offer you relatively easy ways to build a retirement fund. Here is a look at the features, merits, and demerits of each account, starting with what they have in common.

Taxes are deferred on money held within IRAs and 401(k)s. That opens the door for tax-free compounding of those invested dollars – a major plus for any retirement saver. (1)

IRAs and 401(k)s also offer you another big tax break. It varies depending on whether the account is traditional or Roth in nature. When you have a traditional IRA or 401(k), your account contributions are tax deductible, but when you eventually withdraw the money for retirement, it will be taxed as regular income. When you have a Roth IRA or 401(k), your account contributions are not tax deductible, but if you follow Internal Revenue Service rules, your withdrawals from the account in retirement are tax-free. (1)  

Generally, the I.R.S. penalizes withdrawals from these accounts before age 59½. Distributions from traditional IRAs and 401(k)s prior to that age usually trigger a 10% federal tax penalty, on top of income tax on the withdrawn amount. Roth IRAs and Roth 401(k)s allow you to withdraw a sum equivalent to your account contributions at any time without taxes or penalties, but early distributions of the account earnings are taxable and may also be hit with the 10% early withdrawal penalty.1  

You must make annual withdrawals from 401(k)s and traditional IRAs after age 70½. Annual withdrawals from a Roth IRA are not required during the owner’s lifetime, only after his or her death. Even Roth 401(k)s require annual withdrawals after age 70½. (2)

Now, on to the major differences.

Annual contribution limits for IRAs and 401(k)s differ greatly. You may direct up to $18,500 into a 401(k) in 2018; $24,500, if you are 50 or older. In contrast, the maximum 2018 IRA contribution is $5,500; $6,500, if you are 50 or older. (1)

Your employer may provide you with matching 401(k) contributions. This is free money coming your way. The match is usually partial, but certainly, nothing to disregard – it might be a portion of the dollars you contribute up to 6% of your annual salary, for example. Do these employer contributions count toward your personal yearly 401(k) contribution limit? No, they do not. Contribute enough to get the match if your company offers you one. (1)

An IRA permits a wide variety of investments, in contrast to a 401(k). The typical 401(k) offers only about 20 investment options, and you have no control over what investments are chosen. With an IRA, you have a vast range of potential investment choices. (1,3)

You can contribute to a 401(k) no matter how much you earn. Your income may limit your eligibility to contribute to a Roth IRA; at certain income levels, you may be prohibited from contributing the full amount, or any amount. (1)

If you leave your job, you cannot take your 401(k) with you. It stays in the hands of the retirement plan administrator that your employer has selected. The money remains invested, but you may have less control over it than you once did. You do have choices: you can withdraw the money from the old 401(k), which will likely result in a tax penalty; you can leave it where it is; you can possibly transfer it to a 401(k) at your new job; or, you can roll it over into an IRA. (4,5)

You cannot control 401(k) fees. Some 401(k)s have high annual account and administrative fees that effectively eat into their annual investment returns. The plan administrator sets such costs. The annual fees on your IRA may not nearly be so expensive. (1)

All this said, contributing to an IRA or a 401(k) is an excellent idea. In fact, many pre-retirees contribute to both 401(k)s and IRAs at once. Today, investing in these accounts seems all but necessary to pursue retirement savings and income goals.

I want to talk to someone about my IRA or 401(k)


J Rucci

Justin D. Rucci, CFP®
Wealth Advisor
Warren Street Wealth Advisors


Justin D. Rucci is an Investment Advisor Representative of Warren Street Wealth Advisors, a Registered Investment Advisor. The information contained herein does not involve the rendering of personalized investment advice but is limited to the dissemination of general information. A professional advisor should be consulted before implementing any of the strategies or options presented.

This material was prepared by Marketing Pro, Inc. Any investments discussed carry unique risks and should be carefully considered and reviewed by you and your financial professional. Past performance may not be indicative of future results. All investment strategies have the potential for profit or loss. Changes in investment strategies, contributions or withdrawals may materially alter the performance, strategy, and results of your portfolio. Historical performance results for investment indexes and/or categories, generally do not reflect the deduction of transaction and/or custodial charges or the deduction of an investment-management fee, the incurrence of which would have the effect of decreasing historical performance results. Economic factors, market conditions, and investment strategies will affect the performance of any portfolio and there are no assurances that it will match or outperform any particular benchmark. Nothing in this commentary is a solicitation to buy, or sell, any securities, or an attempt to furnish personal investment advice. We may hold securities referenced in the blog and due to the static nature of the content, those securities held may change over time and trades may be contrary to outdated posts.

Citations.

1 – nerdwallet.com/article/ira-vs-401k-retirement-accounts [4/30/18]
2 – irs.gov/retirement-plans/retirement-plans-faqs-regarding-required-minimum-distributions [5/30/18]
3 – tinyurl.com/y77cjtfz [10/31/17]
4 – finance.zacks.com/tax-penalty-moving-401k-ira-3585.html [9/6/18]
5 – cnbc.com/2018/04/26/what-to-do-with-your-401k-when-you-change-jobs.html [4/26/18]

Tax Deductions Gone in 2018

Tax Deductions Gone in 2018
What standbys did tax reforms eliminate?

Are the days of itemizing over? Not quite, but now that H.R. 1 (popularly called the Tax Cuts & Jobs Act) is the law, all kinds of itemized federal tax deductions have vanished.

Early drafts of H.R. 1 left only two itemized deductions in the Internal Revenue Code – one for home loan interest, the other for charitable donations. The final bill left many more standing, but plenty of others fell. Here is a partial list of the itemized deductions unavailable this year.(1)

Moving expenses. Last year, you could deduct such costs if you made a job-related move that had you resettling at least 50 miles away from your previous address. You could even take this deduction without itemizing. Now, only military servicemembers can take this deduction.(2,3)

Casualty, disaster, and theft losses. This deduction is not totally gone. If you incur such losses during 2018-25 due to a federally declared disaster (that is, the President declares your area a disaster area), you are still eligible to take a federal tax deduction for these personal losses.(4)

Home office use. Employee business expense deductions (such as this one) are now gone from the Internal Revenue Code, which is unfortunate for people who work remotely.(1)

Unreimbursed travel and mileage. Previously, unreimbursed travel expenses related to work started becoming deductible for a taxpayer once his or her total miscellaneous deductions surpassed 2% of adjusted gross income. No more.(1)

Miscellaneous unreimbursed job expenses. Continuing education costs, union dues, medical tests required by an employer, regulatory and license fees for which an employee was not compensated, out-of-pocket expenses paid by workers for tools, supplies, and uniforms – these were all expenses that were deductible once a taxpayer’s total miscellaneous deductions exceeded 2% of his or her AGI. That does not apply now.(2,5)

Job search expenses. Unreimbursed expenses related to a job hunt are no longer deductible. That includes payments for classes and courses taken to improve career or professional knowledge or skills as well as and job search services (such as the premium service offered by LinkedIn).(5)

Subsidized employee parking and transit passes. Last year, there was a corporate deduction for this; a worker could receive as much as $255 monthly from an employer to help pay for bus or rail passes or parking fees linked to a commute. The subsidy did not count as employee income. The absence of the employer deduction could mean such subsidies will be much harder to come by for workers this year.(2)

Home equity loan interest. While the ceiling on the home mortgage interest deduction fell to $750,000 for mortgages taken out starting December 15, 2017, the deduction for home equity loan interest disappears entirely this year with no such grandfathering.(2)

Investment fees and expenses. This deduction has been repealed, and it should also be noted that the cost of investment newsletters and safe deposit boxes fees are no longer deductible.  In some situations, investors may want to deduct these fees from their account balances (i.e., pre-tax savings) rather than pay them by check (after-tax dollars).(5)

Tax preparation fees. Individual taxpayers are now unable to deduct payments to CPAs, tax prep firms, and tax software companies.(3)

Legal fees. This is something of a gray area: while it appears hourly legal fees and contingent, attorney fees may no longer be deductible this year, other legal expenses may be deductible.(5)

Convenience fees for debit and credit card use for federal tax payments. Have you ever paid your federal taxes this way? If you do this in 2018, such fees cannot be deducted.(2)

An important note for business owners. All the vanished deductions for unreimbursed employee expenses noted above pertain to Schedule A. If you are a sole proprietor and routinely file a Schedule C with your 1040 form, your business-linked deductions are unaltered by the new tax reforms.(1)

An important note for teachers. One miscellaneous unreimbursed job expense deduction was retained amid the wave of reforms: classroom teachers who pay for school supplies out-of-pocket can still claim a deduction of up to $250 for such costs.(6)

The tax reforms aimed to simplify the federal tax code, among other objectives. In addition to eliminating many itemized deductions, the personal exemption is gone. The individual standard deduction, though, has climbed to $12,000. (It is $18,000 for heads of household and $24,000 for married couples filing jointly.) For some taxpayers used to filling out Schedule A, the larger standard deduction may make up for the absence of most itemized deductions.(1)


Cary Warren Facer

Founding Partner
Warren Street Wealth Advisors


This material was prepared by MarketingPro, Inc., and does not necessarily represent the views of the presenting party, nor their affiliates. This information has been derived from sources believed to be accurate. Please note – investing involves risk, and past performance is no guarantee of future results. The publisher is not engaged in rendering legal, accounting or other professional services. If assistance is needed, the reader is advised to engage the services of a competent professional. This information should not be construed as investment, tax or legal advice and may not be relied on for the purpose of avoiding any Federal tax penalty. This is neither a solicitation nor recommendation to purchase or sell any investment or insurance product or service, and should not be relied upon as such. All indices are unmanaged and are not illustrative of any particular investment.

Warren Street Wealth Advisors, LLC is a Registered Investment Advisor. The information posted here represents opinion and is not meant as personal or actionable advice to any individual, corporation, or other entity. Any investments discussed carry unique risks and should be carefully considered and reviewed by you and your financial professional.  Nothing in this commentary is a solicitation to buy, or sell, any securities, or an attempt to furnish personal investment advice. We may hold securities referenced in the blog and due to the static nature of content, those securities held may change over time and trades may be contrary to outdated posts.

Citations.

1 – forbes.com/sites/kellyphillipserb/2017/12/20/what-your-itemized-deductions-on-schedule-a-will-look-like-after-tax-reform/ [12/20/17]
2 – tinyurl.com/y7uqe23l [12/26/17]
3 – bloomberg.com/news/articles/2017-12-18/six-ways-to-make-the-new-tax-bill-work-for-you [12/28/17]
4 – taxfoundation.org/retirement-savings-untouched-tax-reform/ [1/3/18]
5 – tinyurl.com/yacz559c [1/8/18]
6 – vox.com/policy-and-politics/2017/12/19/16783634/gop-tax-plan-provisions [12/19/17]