Beyond the Magnificent Seven: A 2026 Midyear Check-In
Back in January, we published our 2026 Outlook under the title “Beyond AI & Mega-Cap Tech.” Our argument was simple: real diversification was working and could add value beyond the AI trade which was concentrated to a handful of household names (namely the Magnificent Seven, which includes Microsoft, Amazon, and other big tech names). Six months later, we observe that the AI trade has indeed packed its bag, picked up a passport, and traveled to other asset categories including small caps and emerging markets.
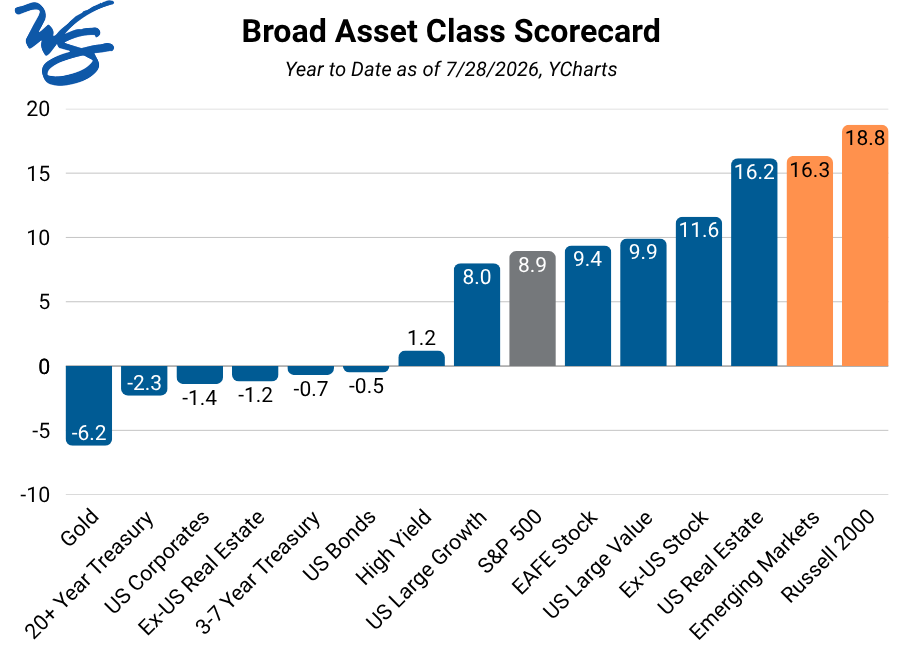
As of late July, small caps and emerging markets are leading the pack. The Russell 2000 (small cap index) is up 18.8% year-to-date while emerging markets 16.3% — all outpacing the S&P 500’s respectable 8.9%. Investors rotated into other corners of the same AI story, with small caps and EM carrying their own AI-adjacent demand related to chips, data centers, and power.
The AI Trade, Domestically: Rotated, But With More Vulnerability
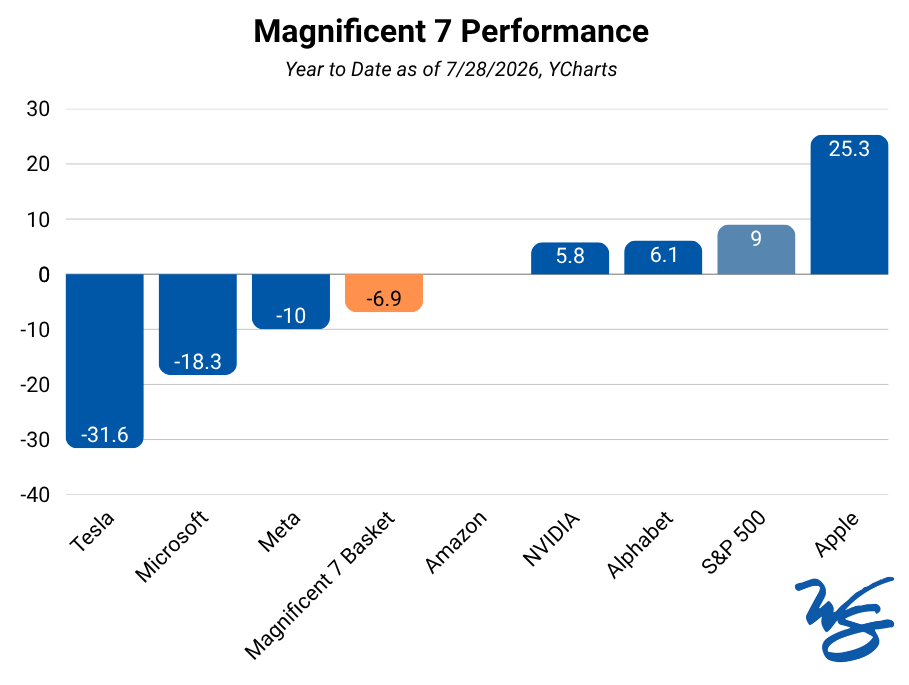
The Magnificent Seven, as a basket, is down 6.9% year-to-date. Hyperscalers (i.e., the biggest spenders on AI infrastructure) including Microsoft (-18.3%), Meta (-10%), and Amazon have struggled in 2026. Only Apple (+25.3%), Alphabet (+6.1%), and Nvidia (+5.8%) are green — and none are this year’s real winners in tech.
That title belongs to the memory and storage names behind the AI buildout: Micron and other chip manufacturers (i.e., CPUs, Memory, etc) are leading the trade, even after “taking a breath” off early-summer highs. Data center demand for memory has minted bigger winners than the household names that started the AI story.
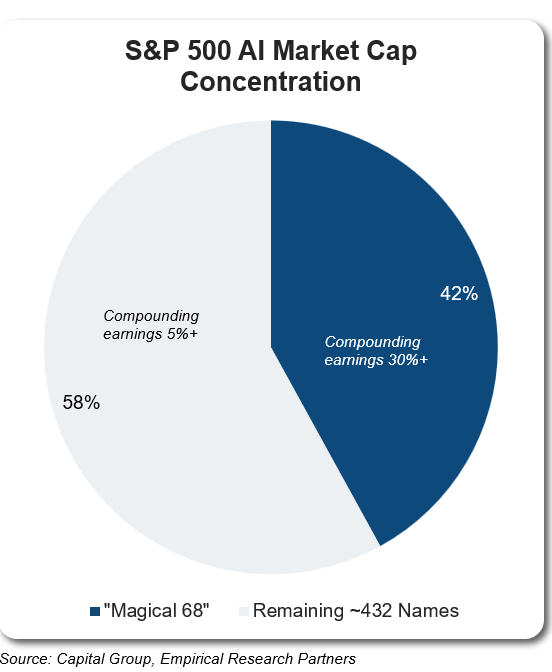
Research cited by Capital Group and Empirical Research Partners shows 68 AI-linked stocks (a.k.a. “Magical 68”) now make up 42% of the S&P 500’s market cap and are compounding earnings north of 30% vs. roughly 5%+ for non-AI stocks – evidence that backlogs are being structurally rewritten to meet supply-constrained demand. In fact, the semiconductors industry alone has also grown from roughly 6–7% of the index three years ago to nearly 20% today.
The bigger question remains whether that demand holds up. Chips are being sold into datacenters built for AI service demands assumed to keep compounding for years – a slowdown, or is absorbed faster than expected – today’s earnings – and the valuations riding on them – could reprice just as fast as they arrived.
The AI Trade, Internationally: Same Movie, Different Language
Emerging markets caught the same bug. The MSCI EM Index — up 16% YTD — now carries a heavier tech weighting than the S&P 500, essentially making EM an AI trade. Investors adding EM for diversification may just be buying semiconductors or memory chips in a different currency.
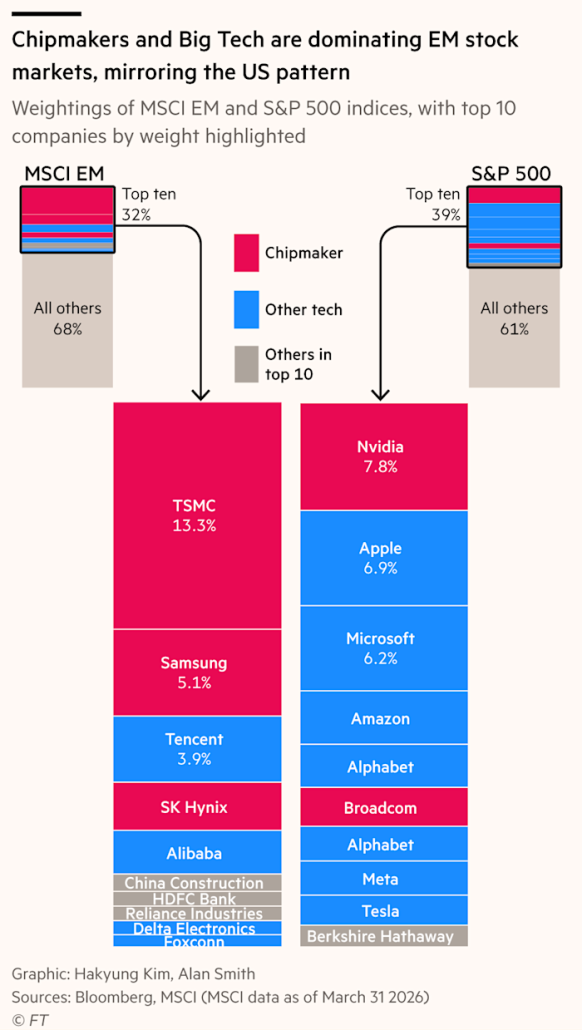
It’s worth noting that EM’s recent outperformance traces back to a handful of AI-linked chip names. Taiwan and South Korea now make up roughly 45% of the benchmark — nearly double their weight a year ago, and above the dot-com peak. Taiwan’s market cap alone exceeds China’s, despite an economy a fraction of the size, with forward earnings (i.e., market cap to cash earnings) running several standard deviations above trend. Put plainly, the diversification benefit of market-cap weighted EM is thinner than it once was and is linked to the fragility of the AI supply chain.
Kevin Warsh and the Inflation Watch
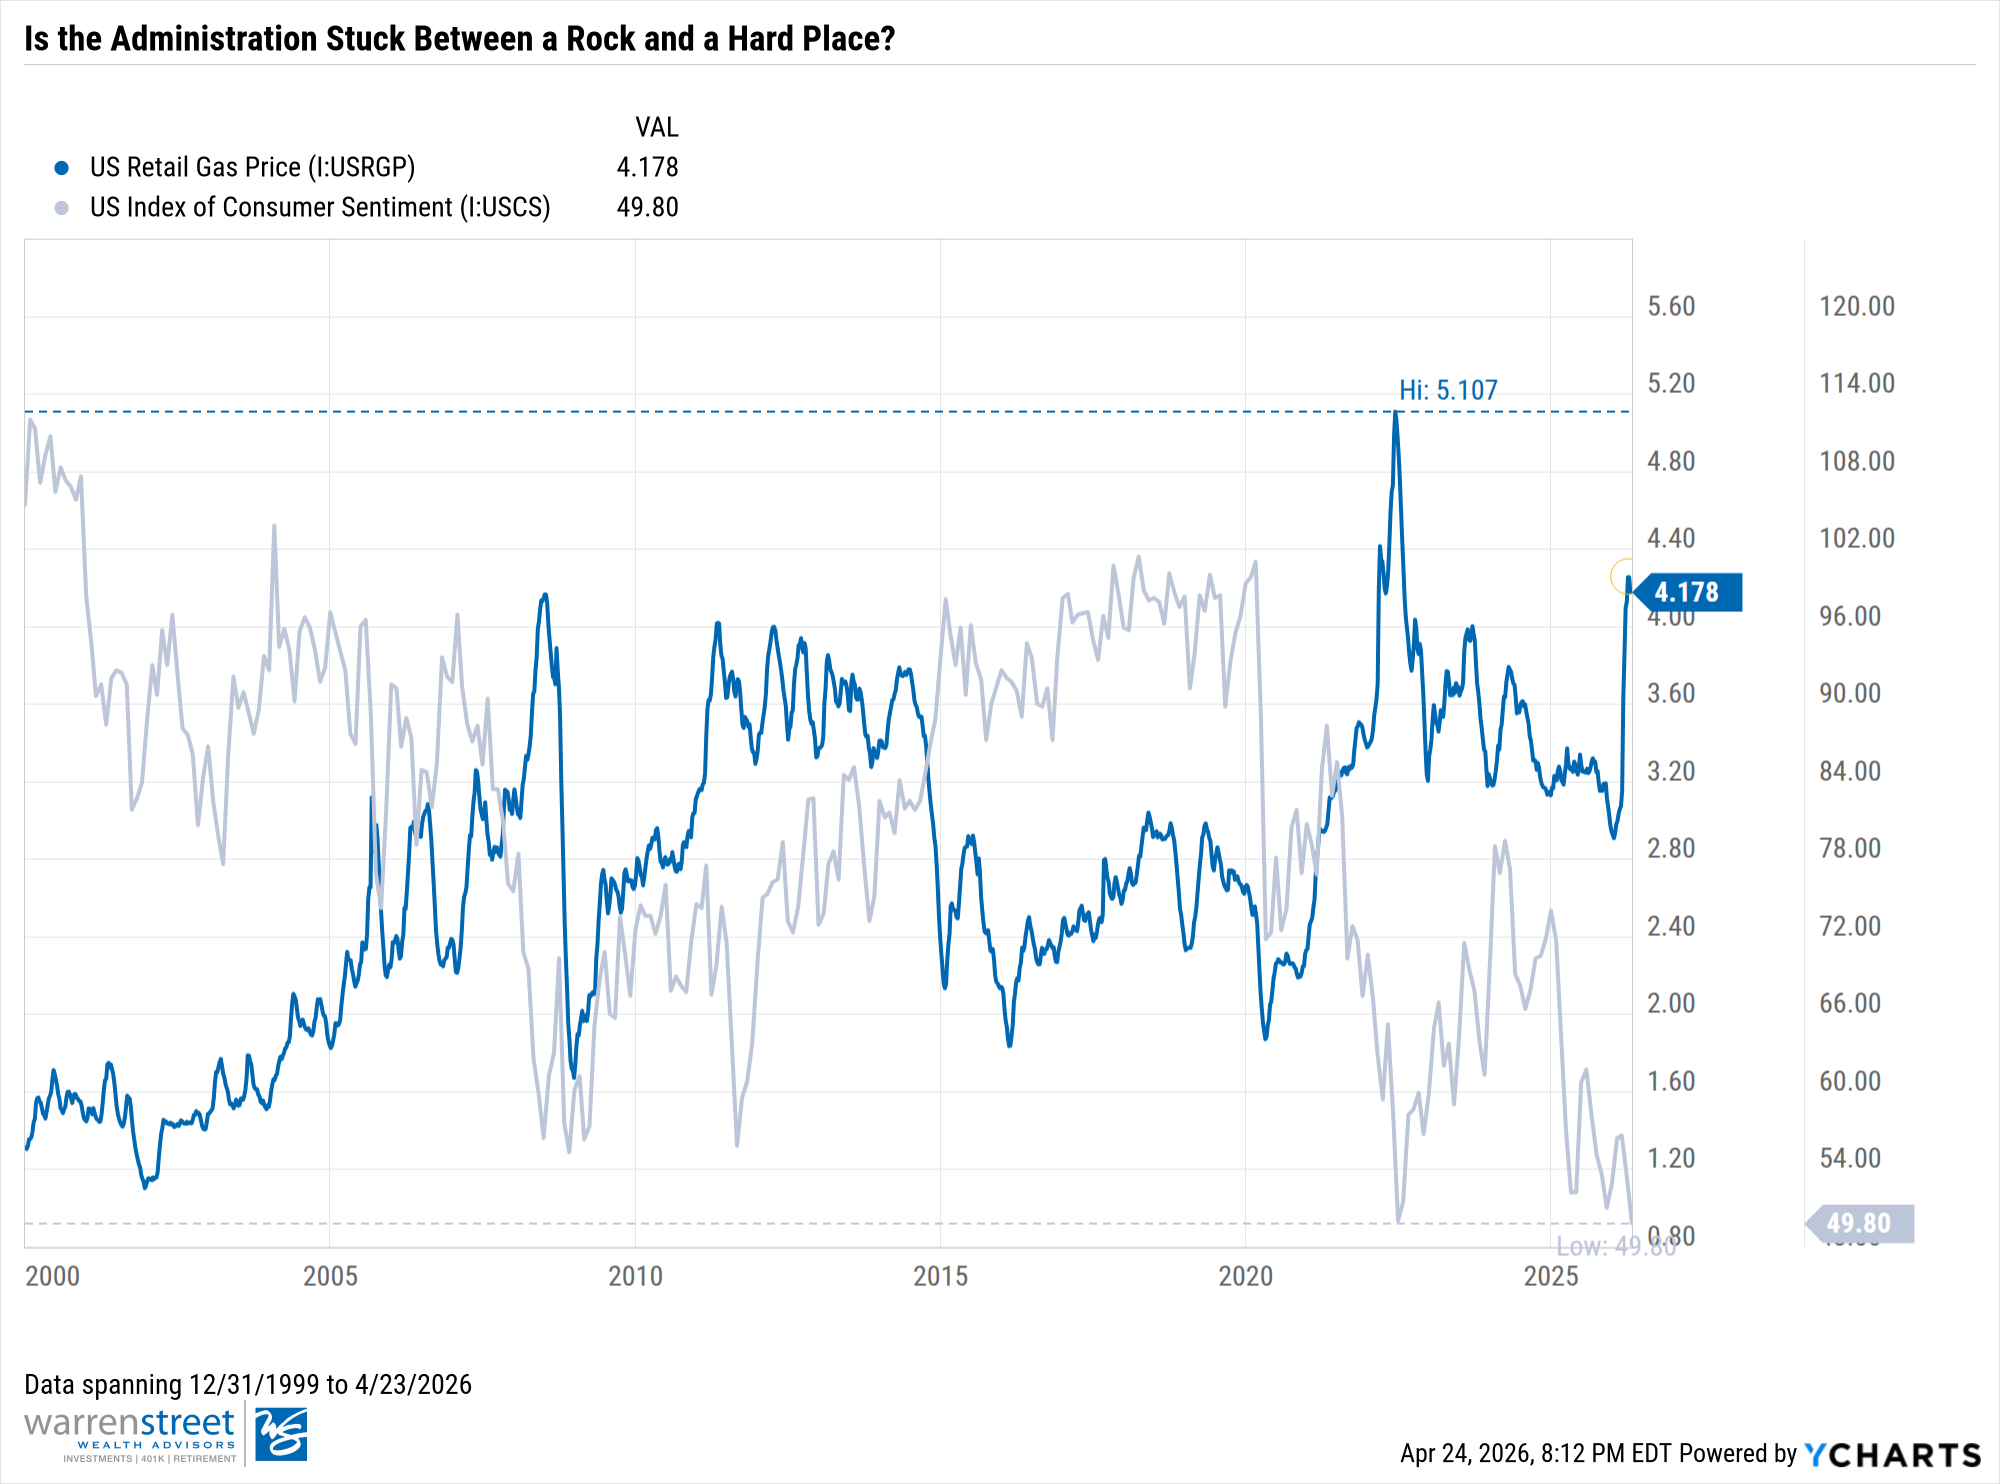
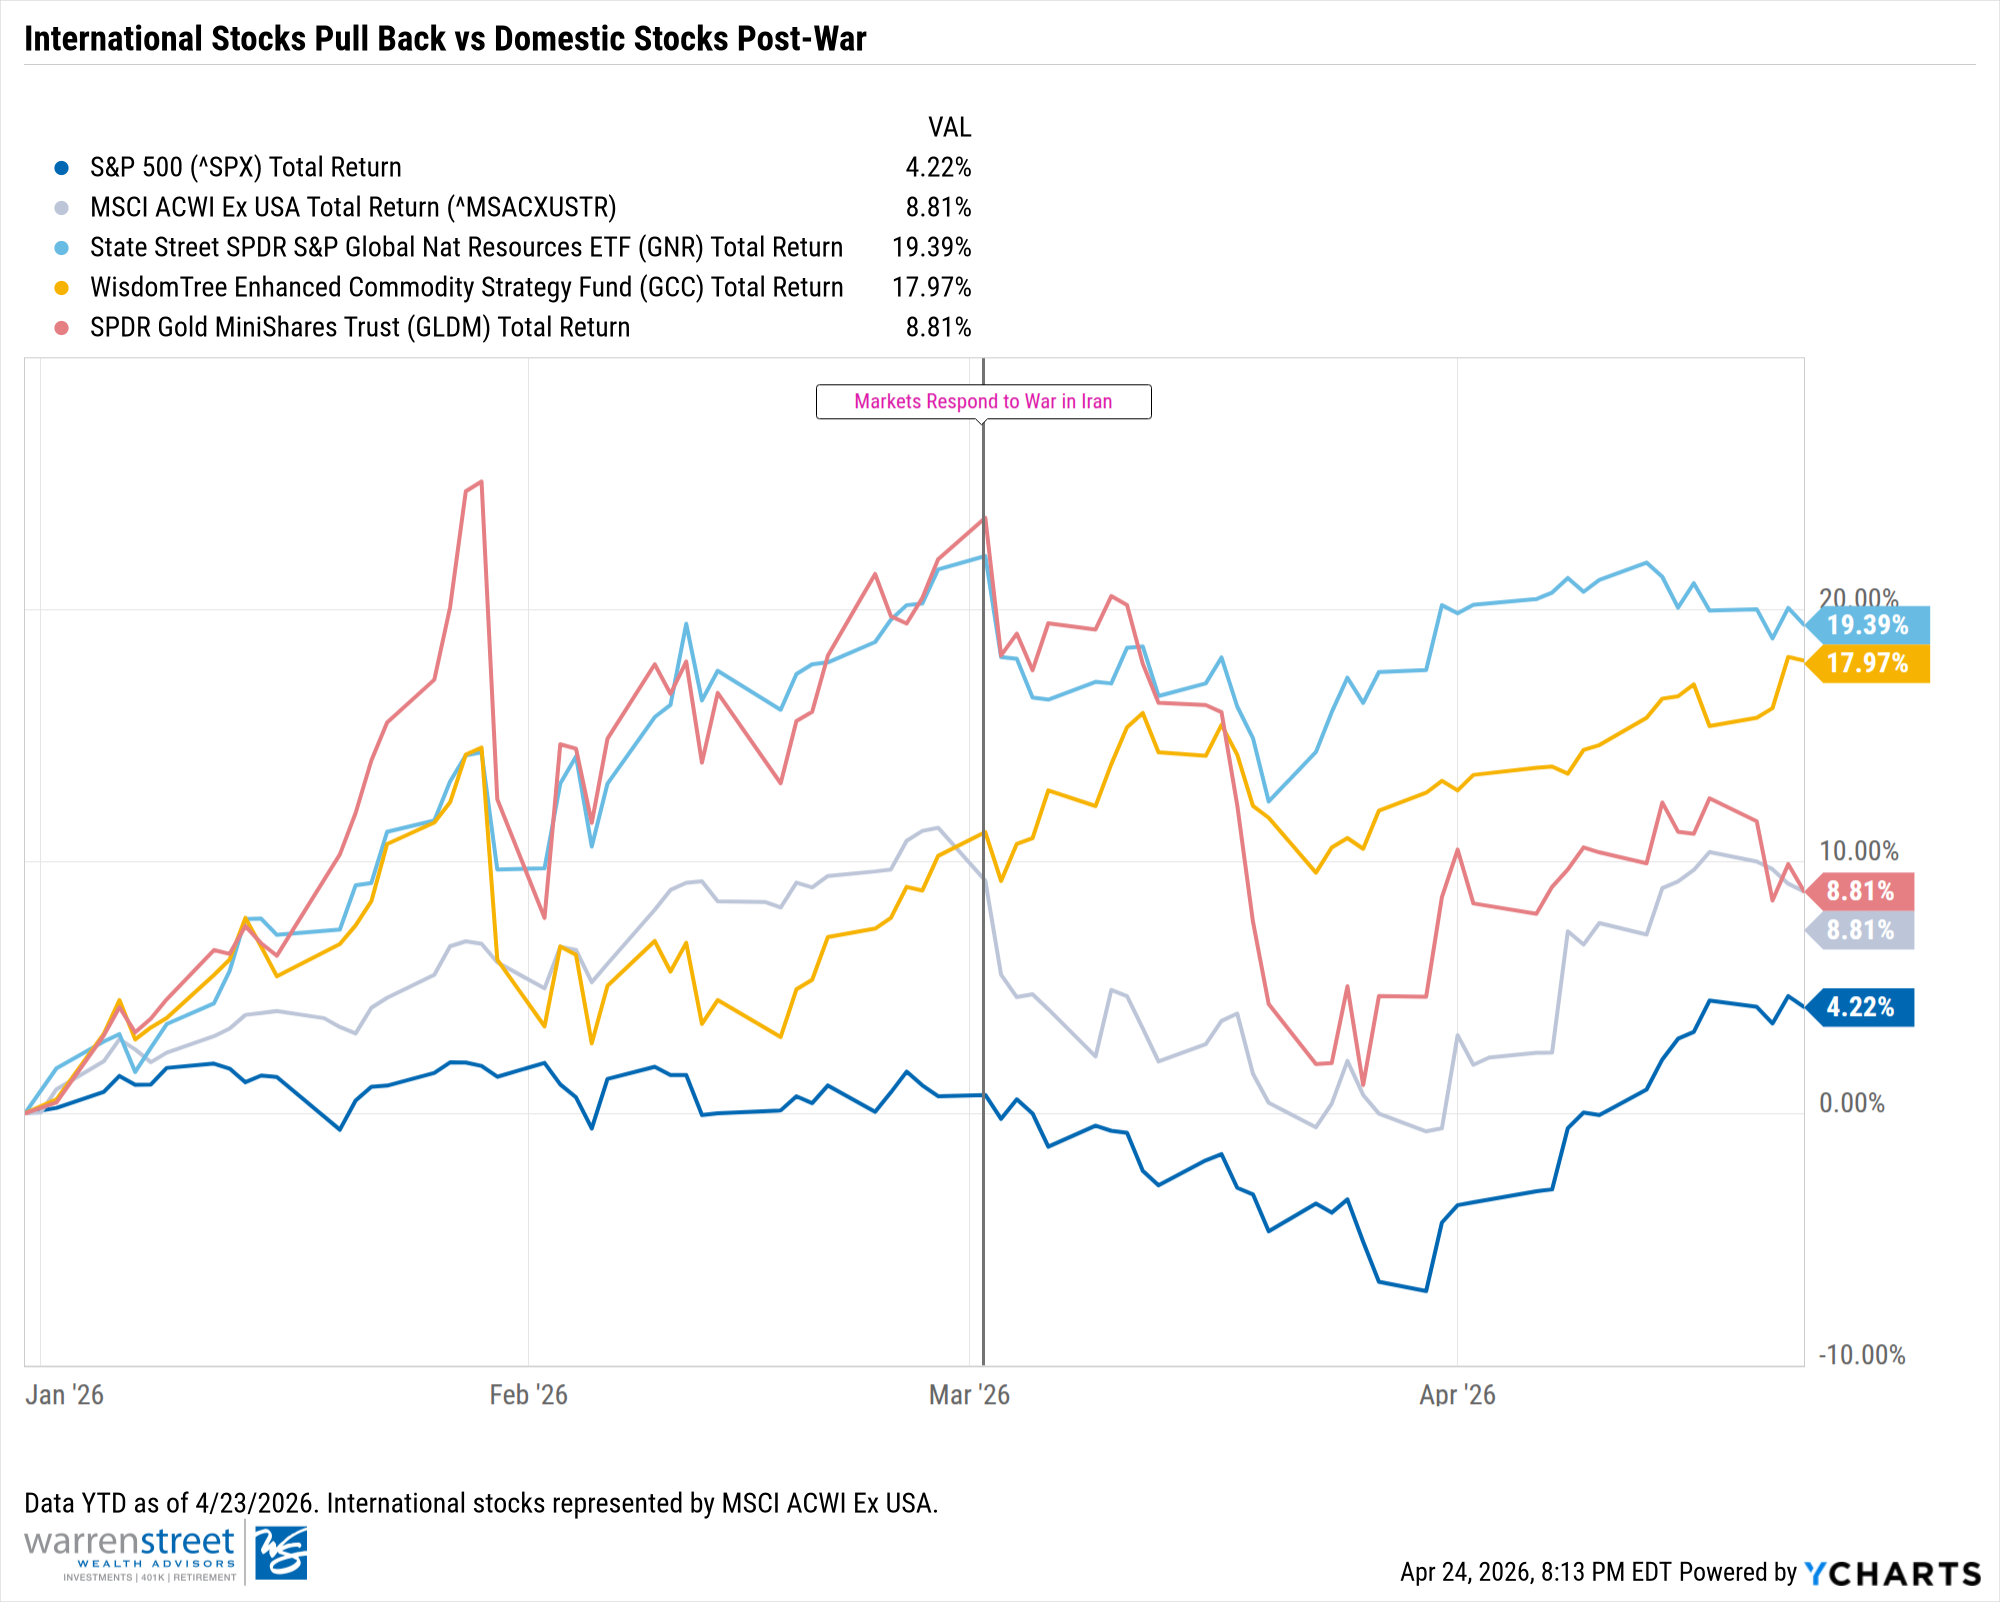
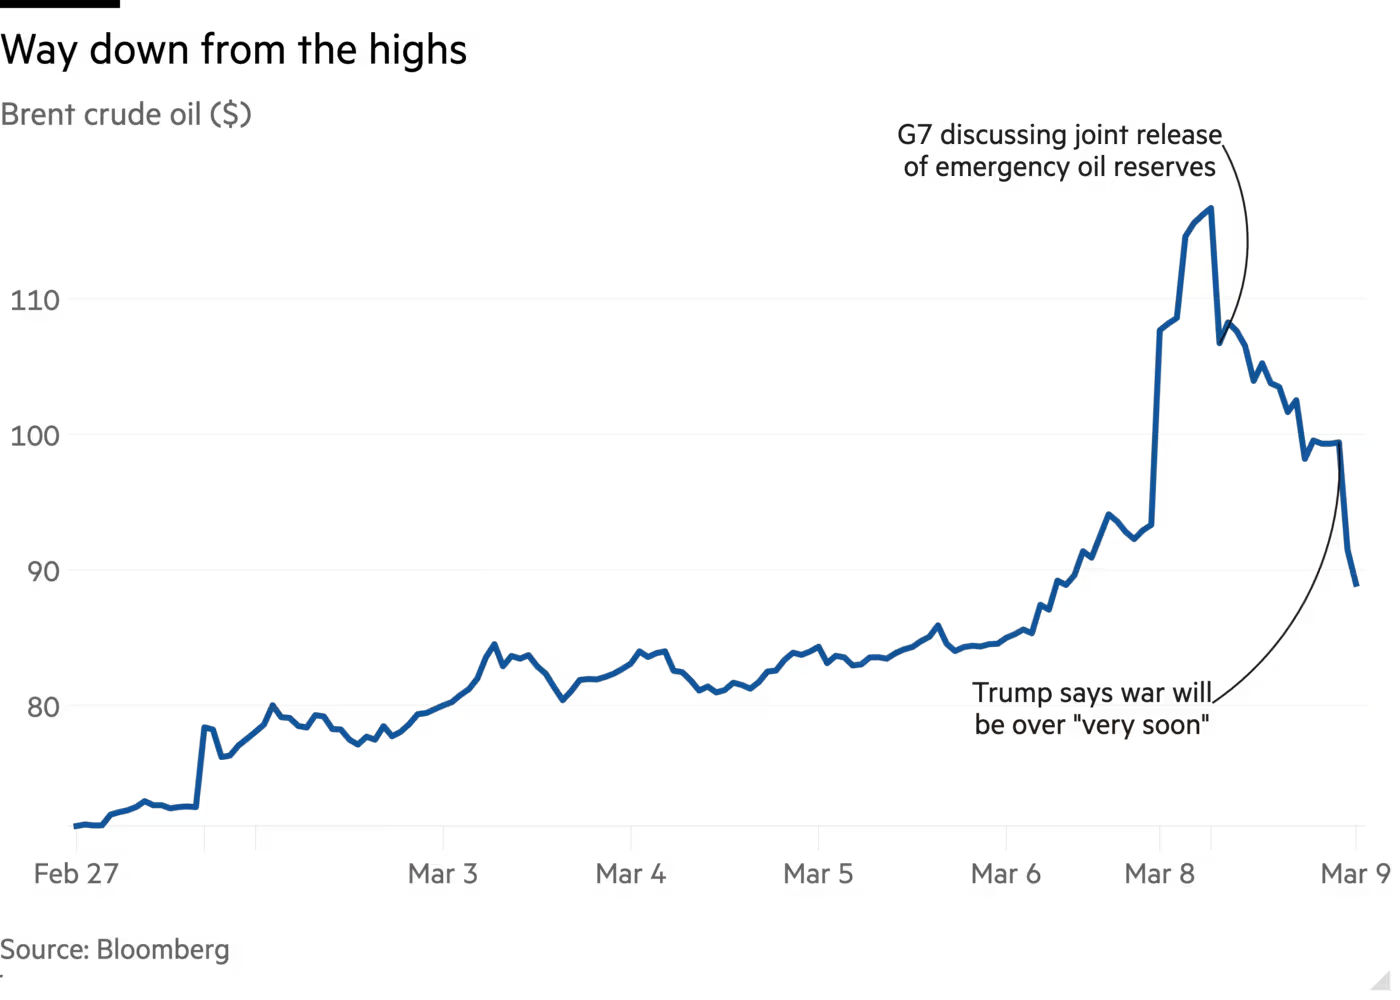
Inflation is sending mixed signals, with core prices (excluding food and energy) running near 2.5%, but the headline number — what you actually feel at the pump and grocery store — is up 3.5% year-over-year due to tensions in the Middle East (the Federal Reserve’s target is ~2%). Consumer spending remains resilient and AI-related business investment is creeping into higher prices. Despite these pressures, cooling wage growth and anchored long-term inflation expectations make it less likely that this turns into a longer-lasting, demand-driven problem.
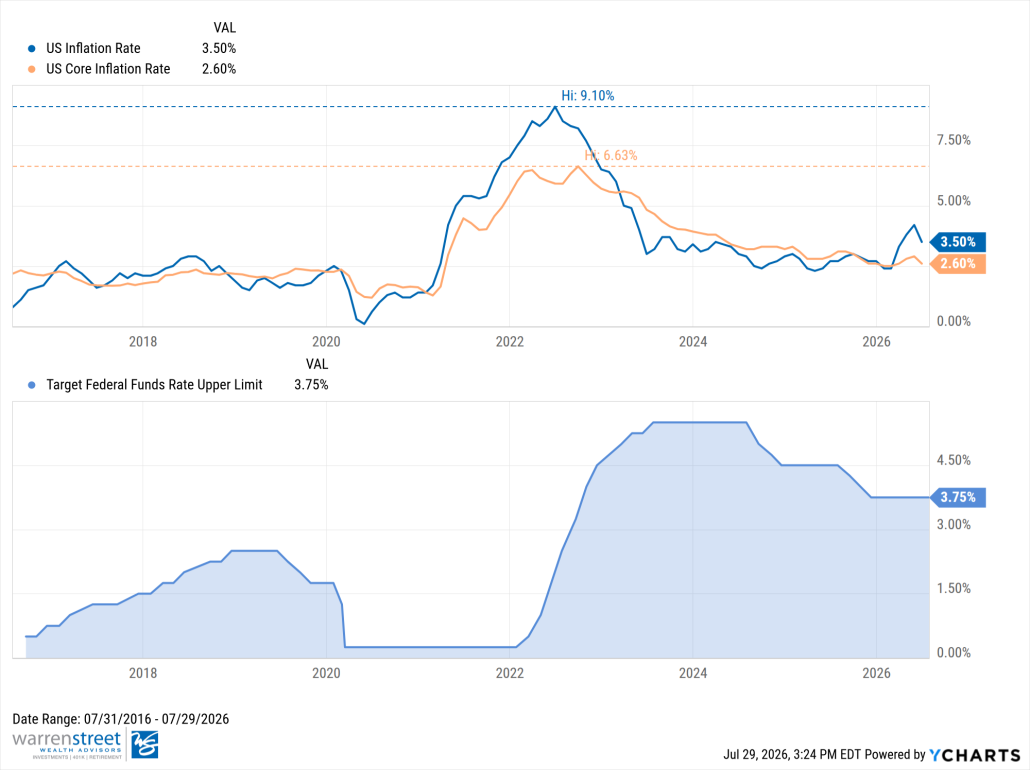
Kevin Warsh, the Fed’s new chair, wasted no time setting a firmer tone. At his first meeting, he scrapped the Fed’s usual forward guidance and signaled a tougher stance, holding rates steady while making clear that further rate hikes — not cuts — could be on the table. That represents a sizable shift from earlier this year, where markets expected two rate cuts; year; now they’re pricing in the possibility of an interest rate hike.
There’s a less obvious ripple effect worth knowing about: the AI boom is increasingly funded by borrowed money, not just cash on hand. Big tech companies have issued roughly $130 billion in bonds so far this year to fund AI infrastructure, already surpassing all of last year’s total, with the broader AI debt market on track to exceed $500 billion in 2026. If interest rates rise, that borrowing gets more expensive — which could eventually squeeze the profits and stock valuations behind the AI trade that’s driven so much of the market’s gains.
Investment Implications
We recognize the risks building in the AI ecosystem, but the technology remains genuinely transformative, with substantial earnings potential and runway left in the build-out. Rather than timing an exit from one of the market’s most powerful themes, we’ve repositioned equity exposure to manage these imbalances more deliberately.
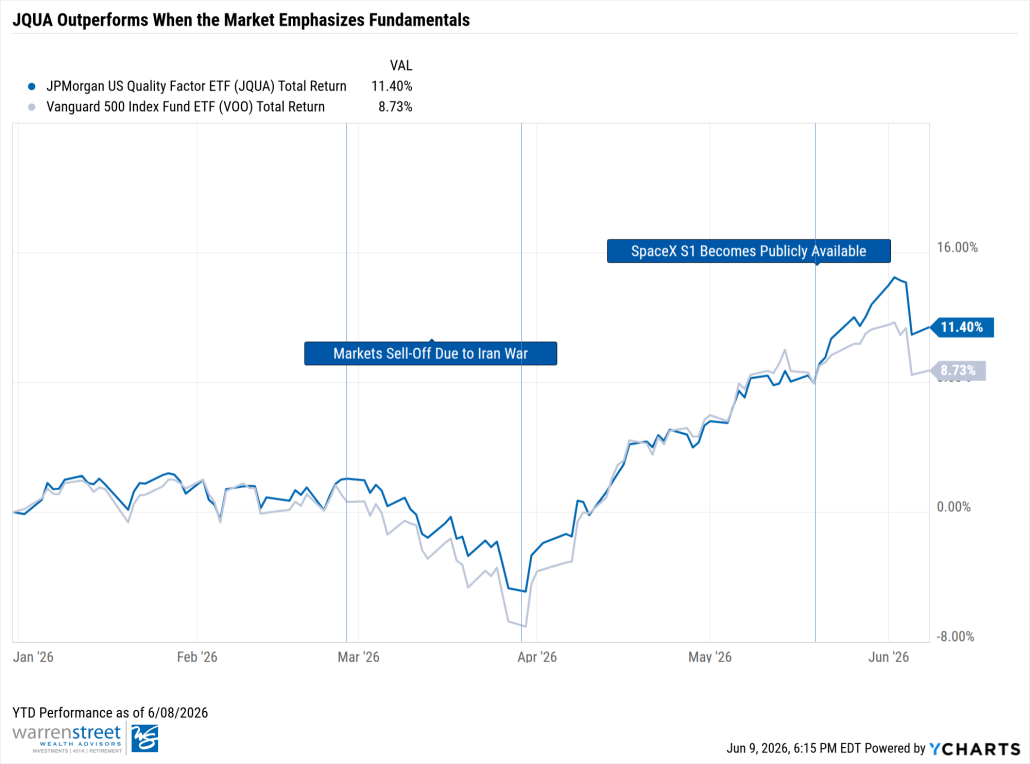
On the U.S. side, we’ve paired core market-cap-weighted exposure with a Quality tilt (JQUA), favoring companies with stronger balance sheets, durable free cash flow, and healthy returns on equity. This is a more disciplined way to own the AI trade — capturing upside while screening out the accounting and accrual adjustments that can inflate earnings tied to the theme.
On the EM side, we’ve balanced our pure-growth exposure (XSOE) with a value- and income-oriented fund (EYLD), tilting toward cash-generative businesses focused on dividends, buybacks, and debt paydown. This preserves our exposure to developing-market growth while reducing sensitivity to EM’s biggest AI-related vulnerabilities over a multi-year horizon.
The AI story likely has room to run, but we expect turbulence as investors scrutinize return on investment, large language model providers limit token usage, and frontier-model competitors emerge (e.g., Kimi K3). We view these positioning shifts as a thoughtful way to stay invested in AI while diversifying risk and return within an increasingly concentrated market

Phillip Law, CFA
Senior Portfolio Manager
Warren Street Wealth Advisors, LLC., a Registered Investment Advisor
The information presented here represents opinions and is not meant as personal or actionable advice to any individual, corporation, or other entity. Any investments discussed carry unique risks and should be carefully considered and reviewed by you and your financial professional. Nothing in this document is a solicitation to buy or sell any securities, or an attempt to furnish personal investment advice. Warren Street Wealth Advisors and/or its clients may hold positions in the securities mentioned. Holdings may change at any time without notice. Due to the static nature of content, securities held may change over time and current trades may be contrary to outdated publications. Form ADV available upon request 714-876-6200.