Market Commentary – November 2018
Market Commentary – November 2018
Key Points:
- Global markets remained volatile despite more clarity about the geopolitical landscape and economic outlook
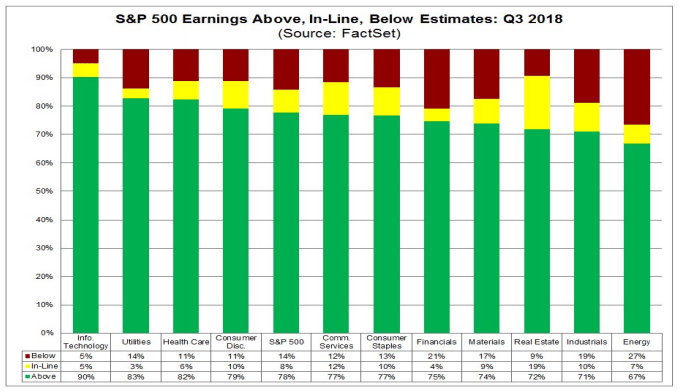
- 78% of S&P 500 companies reported positive earnings surprises. A survey of large corporations indicated an expectation for EPS to slow somewhat in 2019 from the current high levels.
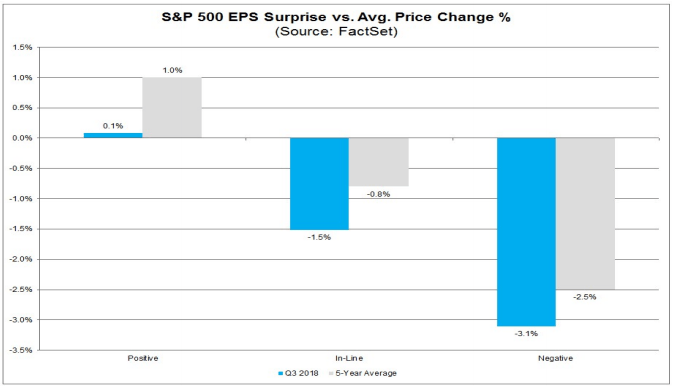
- The U.S. stock market is not rewarding positive surprises as much as usual and is punishing negative surprises more than usual, resulting in lower lows and not-as-high highs as might be expected.
- The Fed’s mission to bring short-term rates to more ‘normal’ levels is narrowing the difference between short- and longer-term interest rates (a ‘flat’ or ‘inverted’ Treasury yield curve.) Muted inflation expectations and investor ‘flight to quality’ is keeping demand for long-term bonds high, putting downward pressure on yields. Neither of these factors indicates a recession is imminent.
- Conclusion: The U.S. economy isn’t going into a recession, it’s just taking a bit of a breather. The stock market will eventually recognize this and stabilize, but it may take a few more months.
Finally! A month of positive returns for the global financial markets.
Uncertainty eased a bit in November as midterm elections were completed with no big surprises, talks of trade wars continued without significant escalation, and Fed Chairman Jerome Powell indicated interest rates were nearing a neutral point. What a relief! Not that the month was pretty, it was far from it, but at least we ended up higher than where we started.
Of course, there are still things to worry about. According to the World Bank¹, energy-related commodities dropped 15.4% in November as OPEC and other oil-producing countries failed to limit supply. European banks and automakers continued to struggle amid news of the German financial giant Deutsche Bank being accused of money laundering. Here in the U.S., General Electric is battling CEO drama, debt issues, and anemic revenues. General Motors announced plans to close some of their factories. These events are certainly worth keeping an eye on but aren’t likely to kick the feet out from under global economies.
So if the economy is doing OK, why is the stock market so jittery?
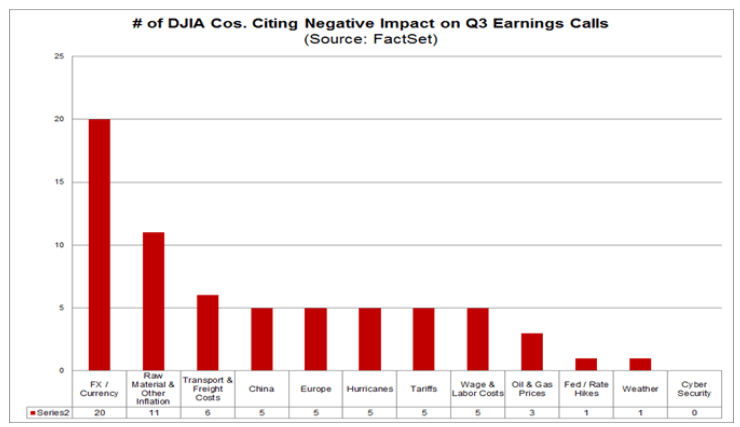
When all is said and done, stock prices should reflect expectations of future profits. According to a recent article published by FactSet², the most commonly reported factor negatively impacting corporate earnings in the 4th quarter wasn’t trade tariffs or rising interest rates like we’ve heard from market commentators, but rather the strength of the U.S. dollar. The next most mentioned factor was the rising costs of raw materials and labor. Despite these headwinds, corporate profits have been strong.
We also were told earlier in the year that the markets were ‘fully valued’ or ‘expensive’ relative to historical norms. One positive outcome of the market corrections in October, November, and early December is that stock prices are now well within the normal range for fair value.
According to FactSet’s ‘Earnings Insight’ report published November 30, 2018³:
- 78% of S&P 500 companies reported a positive EPS surprise and 61% reported a positive sales surprise
- The blended earnings growth rate for the S&P 500 is 25.9%. If 25.9% is the actual growth rate for the quarter, it will mark the highest earnings growth since Q3 2010.
- All eleven sectors have higher growth rates than the 3rd quarter due to positive EPS surprises and upward revisions to EPS estimates.
- 68 S&P 500 companies have issued negative EPS guidance and 31 S&P 500 companies have issued positive EPS guidance
- The forward 12-month P/E ratio for the S&P 500 is 15.6, below the 5-year average (16.4) but above the 10-year average (14.6)
All this data means that U.S. corporations are doing fine. We recognize that many companies are forecasting slower growth in 2019 but slower growth from a robust pace doesn’t mean the economy is falling off a cliff. In fact, the U.S. has never had a recession when corporate profits are growing⁴. What we’re seeing in the market is a disconnect between reality and expectations, with wary investors sitting on the sidelines instead of jumping in to ‘buy the dip’. The volatility in the U.S. stock market is not due to deteriorating fundamentals, but rather to investors not rewarding positive surprises as much as usual (fewer buyers), and punishing negative surprises more than usual (more sellers.)
- Companies reporting positive earnings surprises have seen their stock price rise by only +0.1% in the two days prior to and after the announcement, relative to the 5-year average gain of +1.0%
- Companies posting negative earnings surprises have seen their stock price slump by -3.1% in the same timeframe, compared to the 5-year average of -2.5%
OK, maybe the stock market is overreacting. But what’s this we hear about the ‘inverted yield curve’ forecasting that a recession is imminent?
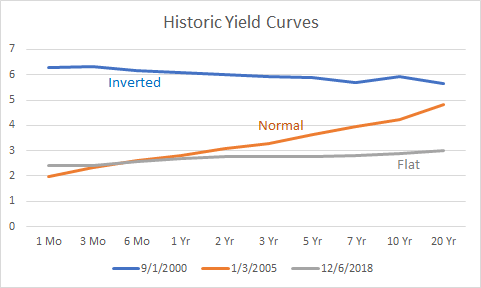
A ‘yield curve’ is a graphical depiction of market-based yield-to-maturity for bonds with different maturity dates. The curve is usually upwardly sloping, meaning that lenders and investors require higher returns the longer they have to wait to get their money back. Over the past year, the difference between the 10-year and 2-year Treasury yields has been getting smaller and smaller, causing the yield curve to ‘flatten’. If short-term bond yields become higher than longer-term yields – an ‘inverted’ yield curve – investors interpret this as a signal of a coming recession.
What you don’t hear in the news is that yield curve inversion has preceded recessions by up to 2 years, which isn’t much of a prediction. When you add the observation that there have been more yield curve inversions than recessions, perhaps we should take a closer look at the ‘cause’ of the yield curve inversion before we jump to the ‘effect’.
Let’s start by refreshing our memory on the definition of a recession:
- GDP (Gross Domestic Product) is the value of goods and services produced in the U.S.
- A recession is two quarters of negative GDP growth
By definition then, corporate profits have to slow substantially for GDP growth to become negative. Right now employment is strong, wages are growing, and corporate profits are solid. As long as people have jobs, they tend to buy stuff. As long as people buy stuff, corporations will be profitable. If corporations are profitable, GDP growth should remain positive. Given everything we see in regard to the current macroeconomic environment, the investment team at Warren Street Wealth Advisors expects slow and steady growth to continue at least through summer of 2019, and probably longer. As long we can dodge potential catastrophes caused by weather, wars, or geopolitical events, there’s no reason for the U.S. economy to fall into a recession.
So if the economy isn’t going to stall, what’s with the inverted yield curve?
There’s nothing mysterious about why short-term rates are going up – the Fed is pushing short-term interest rates back to ‘normal’ levels. The question then revolves around why long-term rates aren’t going up as much.
Long-term Treasury rates aren’t set by the Fed, but by the willingness of investors and businesses to borrow and lend. This willingness is driven by 1) economic growth, 2) inflation expectations, and 3) risk appetites.
-
- We’ve already talked about economic growth being solid but not outstanding, so no need for long-term rates to rise significantly in response to business demand for funds
- Inflation is hovering around 2%, just where the Fed wants it, so current yields are sufficient to protect purchasing power
- The biggest reason for the current inversion is probably related to risk appetites
What kind of risk am I talking about? Market risk.
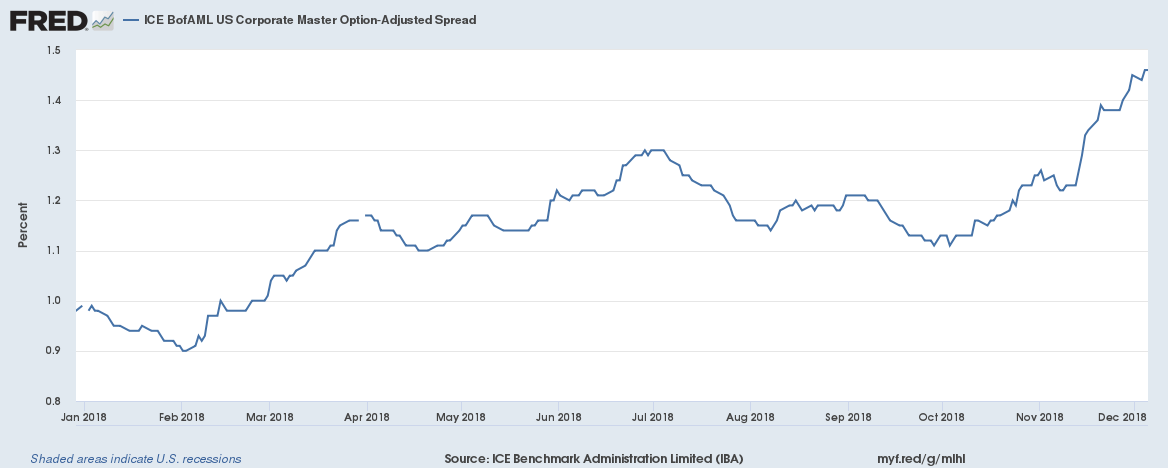
With the wide swings in the stock market in recent months, we’ve seen a ‘flight to quality’ away from stocks and toward the safety of Uncle Sam. More demand for Treasury bonds leads to higher prices, and when bond prices rise, yields fall. With short-term rates moving up due to Fed actions and long-term rates staying low due to market forces, the yield curve flattens. It isn’t recessionary, it’s just simple supply and demand. In fact, if you look at corporate bond yields instead of Treasuries, longer-term yields have indeed been rising as the Fed increases short-term rates.
There’s really only one conclusion to draw from the available evidence. The U.S. economy isn’t going into a recession, it’s just taking a bit of a breather.
While the markets adjust to this new reality, investors are getting tired of enduring the huge swings in stock prices. When investors stay on the sidelines and stop ‘buying the dips’, stock prices have trouble finding a floor. Hence the tendency for the market to fall by hundreds of points on news headlines, whether the information impacts long-term profits or not. What should we do now? The investment team at Warren Street Wealth Advisors is buckling our seatbelts and holding on tight as we speed toward a turbulent year-end close. We’re confident that the fundamental strength of U.S. and global economies will win out eventually, but it may take another few months for the markets to reward our patience.
In the meantime, we’re here for you! Call or stop by any time to share your questions, concerns, or suggestions.
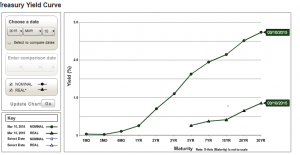
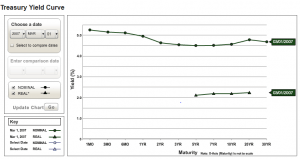
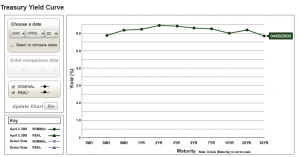
Which of the following yields curves is best characterized as ‘inverted’? (Focus on the upper line on each chart)
 Marcia Clark, MBA, CFA
Senior Research Analyst
Warren Street Wealth Advisors
Warren Street Wealth Advisors, a Registered Investment Advisor. The information contained herein does not involve the rendering of personalized investment advice but is limited to the dissemination of general information. A professional advisor should be consulted before implementing any of the strategies or options presented. Any investments discussed carry unique risks and should be carefully considered and reviewed by you and your financial professional. Past performance may not be indicative of future results. All investment strategies have the potential for profit or loss.
¹ http://www.worldbank.org/en/research/commodity-markets
² https://insight.factset.com/what-factors-may-have-a-negative-impact-on-revenue-and-earnings-growth-in-q4
³ https://www.factset.com/hubfs/Resources%20Section/Research%20Desk/Earnings%20Insight/EarningsInsight_113018.pdf
⁴ https://www.wsj.com/articles/stocks-stage-recovery-after-dow-drops-over-700-points-1544075565
⁵ https://www.wsj.com/articles/stocks-stage-recovery-after-dow-drops-over-700-points-1544075565
Quiz Answer: Chart #2
