It’s Your Stream, Your Money

As many have come to learn, taxes can be the most complicated part of being a full time content creator, streamer on Twitch or professional gamer. With some people being considered contractors or employees of a team, or both, it can be difficult to navigate your tax liability and learn how to reduce it.

However, there are solutions available. The biggest solution for those receiving a majority of their income via 1099 is the Solo 401(k) option, or “Solo(k)”. The Solo(k) is essentially a 401(k) plan but for a single person, and potentially a spouse, giving them the ability to defer their taxes and profit share themselves to help reduce tax liability come April.

So what can the Solo 401(k) do for a streamer or pro player?


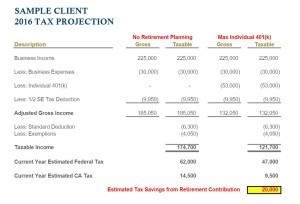
solo projection
Table provided by Robert McConchie, CPA/PFS®

This example shows a streamer/player earning $225,000 in 1099 income, assumes $30,000 in business expenses across the year, a standard deduction (single person, 2016), and standard exemption (single person, 2016). Additionally, California state tax rate was used in conjunction with the Federal tax, and you can see the savings between utilizing and not utilizing the Solo 401(k), a $20,000 savings to be exact.

The savings comes from the $18,000 personal deferral then a profit share from the business of $35,000 for a max total deferral of $53,000 income within the year. Establishing a Solo 401(k) account is beneficial on multiple fronts; it allows you to set money aside for your retirement date, reduces your tax liability today, and can even be borrowed against should you find yourself in a pinch.

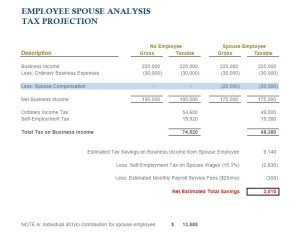
Now, for some streamers who are married, you have the ability to put your spouse on to your business’ payroll. How can that impact your tax savings come year end? Here’s a conservative estimate below.

solo projection spouse
Table provided by Robert McConchie, CPA/PFS®

Using the same amount of income, we can see that tax savings can also be found by correctly setting up your business to include your spouse on payroll, a 401(k) contribution for them and take advantage of additional tax savings.

Opening a Solo 401(k) is one thing you can do, but you can see the immediate impact it can make for full time content creators.

The Solo 401(k) is one of many things that every content creator should do to help minimize their tax liability into the future. Don’t wait to open one. In order to receive the tax benefit, the account must be opened within the calendar year.

Contact us today to set up a free consultation and learn what you can do to maximize your tax savings for 2016 and into 2017.


Joe Occhipinti

Joe@Warrenstreetwealth.com
714.823.3328
www.warrenstreetwealth.com/esports


The contents of this article are not meant to be personal or actionable tax advice. Please consult a tax professional or your personal advisor before making any decisions. IRS & DOL guidelines must be carefully considered before choosing the retirement plan or tax advantaged savings vehicle that is right for you. The illustrations above are of hypothetical scenarios and are meant strictly for informational purposes.

Joe Occhipinti is an Investment Advisor Representative of Warren Street Wealth Advisors, a Registered Investment Advisor. The information posted here represents his opinions and is not meant as personal or actionable advice to any individual, corporation, or other entity. Any investments discussed carry unique risks and should be carefully considered and reviewed by you and your financial professional.  Nothing in this commentary is a solicitation to buy, or sell, any securities, or an attempt to furnish personal investment advice. We may hold securities referenced in the blog and due to the static nature of content, those securities held may change over time and trades may be contrary to outdated posts.

Marketing the Safety Out of It

A growing theme in investing is to target and invest only in the least volatile stocks in the market. One simple example of this is take the S&P500, which is a representation of the 500 largest publicly traded stocks in the United States, and only invest in the 10% of companies with the lowest standard deviation of the 500. This would produce names such as AT&T, Coca-Cola, and Johnson & Johnson. 

This simple concept traditionally would result in an investor owning a lot more safety, blue chip, and high dividend yielding stocks. Not a bad bet in a historic context. Looking forward however, we have an accelerating concern over the price of these types of companies, which may lead to them not being as safe as one would expect.

One metric we look at to value stocks is the Price to Earnings ratio, the easiest way to describe this is what price is an investor willing to pay for every dollar a company earns in profit? A higher P/E ratio implies more expensive,  a lower one implies cheap. Comparing a stock, or an index, such as the S&P500 to its historical average P/E can give you a relative idea of whether something is expensive or cheap compared to historical  standards.
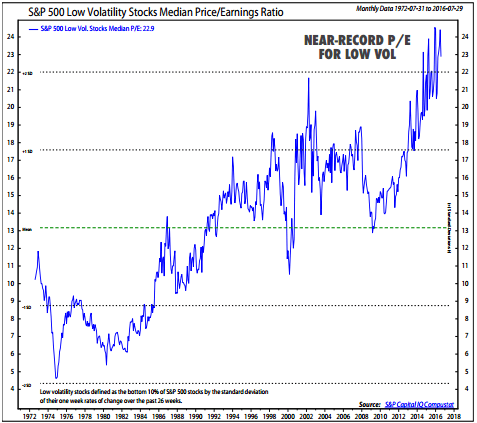
Historically, going back to 1972, the companies in the lowest 10% volatility bucket in the S&P500 (as measured by standard deviation) produce a historical median P/E ratio of roughly 13. As is stands today that same low volatility class of stocks trades between a P/E ratio of 23 to 24.

Low Vol Record PEChart provided by Ned Davis Research, Inc.

Why is this troubling? Well, when prices revert to the mean, and investors are willing to pay less for those same dollars of earnings, it spells trouble for those who hold these assets, especially those who have been chasing the stability and dividends these stocks were expected to provide.

What is causing this? Let’s take a look at the major contributors:

Fed policy. While artificially low interest rate policy is intended to push investors into riskier assets, some investors still want safer assets. Low volatility stocks have higher dividend yields, making them bond proxies.

Sector attribution. The low volatility group is concentrated in Utilities, Financials, and Consumer Staples, which have high dividend yields and P/E ratios that are above their long-term averages.

High valuations for the broad market. The median P/E for the S&P 500 is 24.0, well above its historical norm, which has pushed investors into “safer” stocks.

Secular trends. Fear is a stronger emotion than greed, so investors have flocked to “safer” assets.

Industry innovation. ETFs have enabled investors to more easily buy themes like low volatility.

The first three factors are the most likely the first ones to threaten this crowded trade. The one that has me the most troubled is the fifth factor. Industry innovation has led to specialized investment products that make it very simple for retail investors to buy into this wave of low or minimum volatility assets. We’re seeing these assets recommended in droves to competitor’s clients, with little to no consideration given to how crowded or expensive the trade may be.

These assets in the broad context of a well diversified portfolio may make sense, but from my perspective every asset has a time and a place. Currently, I would not be overpaying for safety by using these low volatility factors we’ve explored above. There are other ways. Like always, when assets deviate from a historical valuation range, it can take quite awhile to be proven right and see them correct. We’re not yelling fire in a crowded theater but would like to see investors better educated on the risks ahead.


Thank you for reading!

Blake Street
Written by: Blake Street, CFA®, CFP®, Chief Investment Officer

Blake Street is an Investment Advisor Representative of Warren Street Wealth Advisors, a Registered Investment Advisor. The information posted here represents his opinions and is not meant as personal or actionable advice to any individual, corporation, or other entity. Any investments discussed carry unique risks and should be carefully considered and reviewed by you and your financial professional.  Nothing in this commentary is a solicitation to buy, or sell, any securities, or an attempt to furnish personal investment advice. We may hold securities referenced in the blog and due to the static nature of content, those securities held may change over time and trades may be contrary to outdated posts.

Why Aren’t Interest Rates Going Up?

Interest Rates, Inflation, and Monetary Policy: Why aren’t U.S. interest rates going up?

Our topic today is interest rates, inflation, and monetary policy. The question we will attempt to answer is: When are interest rates in the United States finally going to rise?


Defensive Strategies Depress Returns

If you’re like most bond investors, you’ve been expecting interest rates to rise for over 2 years now. As a prudent investor, you’ve been holding the duration, or interest rate risk, of your portfolios shorter than usual to protect against falling prices when rates rise. Unfortunately, the result of your prudent behavior has been to underperform standard indexes such as the Barclays U.S. Aggregate Bond index. And if your portfolio is focused primarily on safe assets such as U.S. Treasuries, all but the longest maturity funds struggled to provide a return even modestly better than inflation.
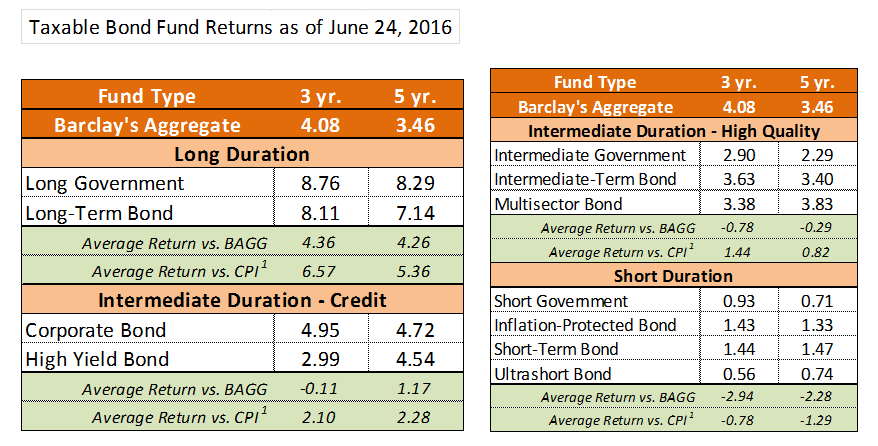
Capture1

Source: http://news.morningstar.com/fund-category-returns/ and https://fred.stlouisfed.org
1Author’s calculations

While short-term rates have indeed risen with the Federal Reserve rate hike in December 2015, interest rates for Treasuries maturing in 10 years and beyond have actually fallen by an average of more than -0.50% over the past 3 years. Granted, this article was written the day after the British referendum to exit the European Union, which caused global stock markets to tumble and U.S. Treasury yields to fall. If we measure the change in yields as of June 23, 2016 when most experts expected the British to vote to remain in the E.U., long term interest rates have still fallen an average of -0.37% since January 2013.

Capture2Source: www.treasury.gov

In contrast to the lack of upward movement in nominal interest rates, real yields – nominal yields adjusted for inflation – have risen across all maturities in recent years, albeit from an extremely low starting point. As of January 2, 2013 real yields for 5-year Treasury bonds were nearly -1.50%, whereas by June 24, 2016 5-year real yields are only negative -0.50%. And if you were willing to invest for 20 or 30 years, you could earn the princely sum of approximately +0.35% to +0.75% real yield as of January 2013 and June 2016, respectively.

If we take a longer term perspective and look back 10 years, we observe an enviable real rate of approximately 2.5% across maturities from 5 years to 30 years! At today’s paltry real yields of less than 1%, it seems unsustainable to invest hard-earned funds for 5 years or more and barely keep up with inflation. Surely interest rates must return to more normal levels eventually.

But when will that long-awaited time finally arrive?

Building Blocks of Interest Rates

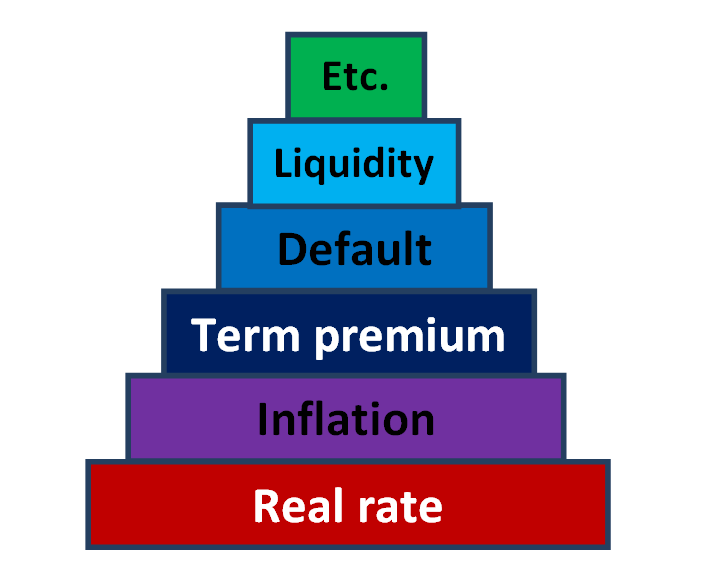
To gain some insight into the drivers of interest rates, let’s take a moment to review the building blocks using what I like to call my ‘interest rate birthday cake’.

Capture4

Theory would have us believe that the minimum return investors will accept is a modestly positive ‘real return’, historically between 1.0% and 2.5%. If you add a maturity term premium and inflation expectations to the real rate, the result is the ‘risk free’ rate of interest, which we typically consider the U.S. Treasury yield curve.

The average annual inflation rate from 2006 to 2016 was 1.93%¹, so we could expect the risk free rate of interest over that time period to be approximately 3% to 4.5%. And yet 10-year Treasury yields are currently hovering below 2%, while 30-year yields stand at approximately 2.5%. In fact, 10-year Treasury rates have been falling ever since the ‘taper tantrum’ in mid-2013 as the U.S. economy continues to struggle to sustain momentum after the financial crisis of 2008-2009.

¹Source: U.S. Bureau of Labor Statistics


Capture5


Let’s not forget the aggressive monetary policy actions of the Federal Reserve bank since the financial crisis. The unprecedented amount of monetary stimulus has long been expected to cause inflation, and yet the only result to date has been to keep the U.S. economy from stalling.

Capture6

Source: http://www.federalreserve.gov/monetarypolicy/bst_recenttrends.htm

Why Has Aggressive Monetary Policy Not Sparked Inflation?

In times past economists observed a fairly reliable relationship between ‘easy money’ and the ‘velocity of money’, or the amount of times a single dollar changes hands. It is the velocity of money that traditionally puts pressure on prices of goods and services.

But as bank lending standards and capital requirements remain strict, consumer debt levels low, and with the ‘shadow banking system’ taking the place of traditional lenders, the velocity of money has been on a steady decline. Consequently, the impact of monetary policy on the economy has diminished.
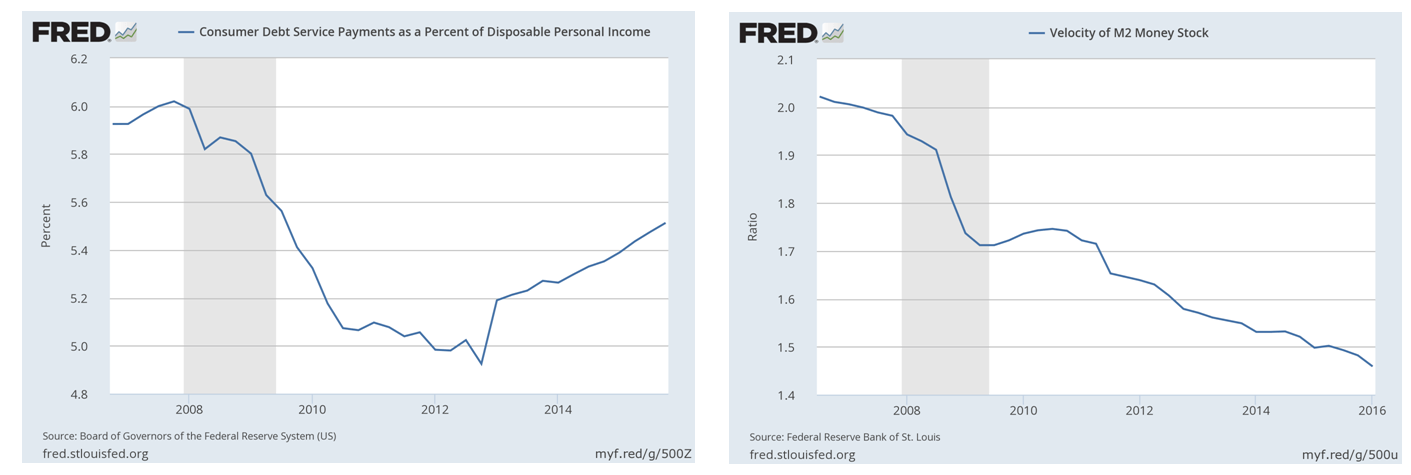
Capture7

So if yields on Treasury securities remain stagnant, where else can we look for pressure on interest rates? One answer is the market appetite for risk – what Keynesian economists term ‘animal spirits’. The layers of my ‘interest rate birthday cake’ related to market risk appetites are default risk, liquidity risk, call risk, and others.Capture8
The term ‘animal spirits’ is used to describe human emotions that drive consumer confidence. Rising consumer confidence can increase the general level of economic activity if individuals feel wealthier and purchase more goods and services. If consumer demand grows sufficiently, prices of goods and services will increase, as will the general level of interest rates.

Chasing Yield – Investors Look to Corporate Bonds

If we look to Treasury yields for the risk-free interest rate, corporate bond yields should reflect a risk-adjusted rate of interest for various levels of default risk. In recent years, investors with an appetite for risk had found opportunities in low-quality corporate bonds, only to be traumatized in late 2015 and early 2016 as the precipitous drop in oil and gas prices put extreme pressure on the profitability of the energy sector of the U.S. economy. Because the credit quality of many smaller oil and gas producers was below investment grade, the high-yield sector of the bond market was particularly hard hit.

Option-adjusted yield spreads for BBB-rated corporate bonds – the additional yield above the yield of a matched-maturity Treasury – averaged approximately 1.75% in 2006-2007, prior to the financial crisis. In 2015-2016, BBB spreads averaged 2.31%. It seems investors are being fairly compensated for default risk at the current level of yields, despite a rather bumpy ride along the way.
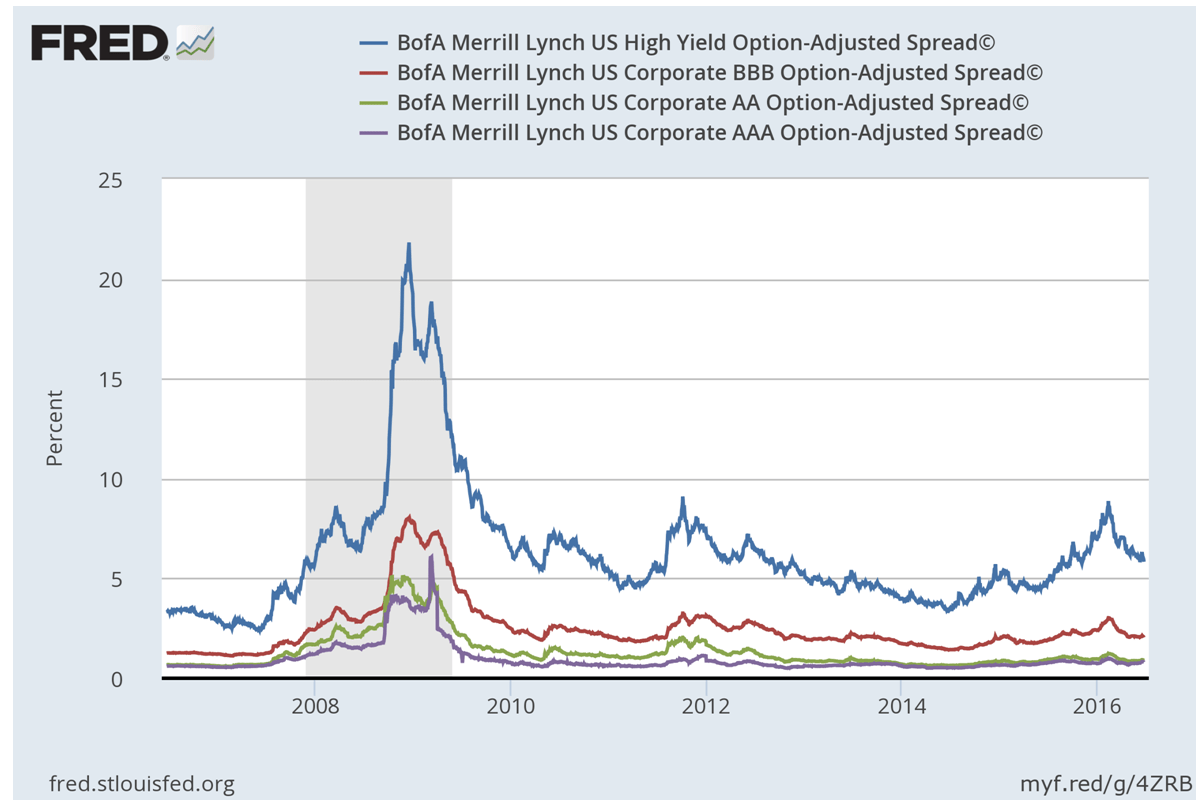
Capture9

Traditional Drivers of Inflation Are Absent

So with this understanding of the building blocks of interest rates, can we answer the question of why Treasury yields remain stubbornly at levels barely above inflation?

The answer lies in the middle block of the interest rate pyramid: inflation. More precisely, the market’s expectation for future levels of inflation.

As you may recall from your Econ 101 course in school (assuming our readers stayed awake during class!), inflation typically occurs when either, 1) input prices are rising, causing manufacturers and service providers to increase their finished goods prices to the extent possible, or 2) consumer demand for goods and services exceeds the current supply, enabling manufacturers and service providers to increase their prices.

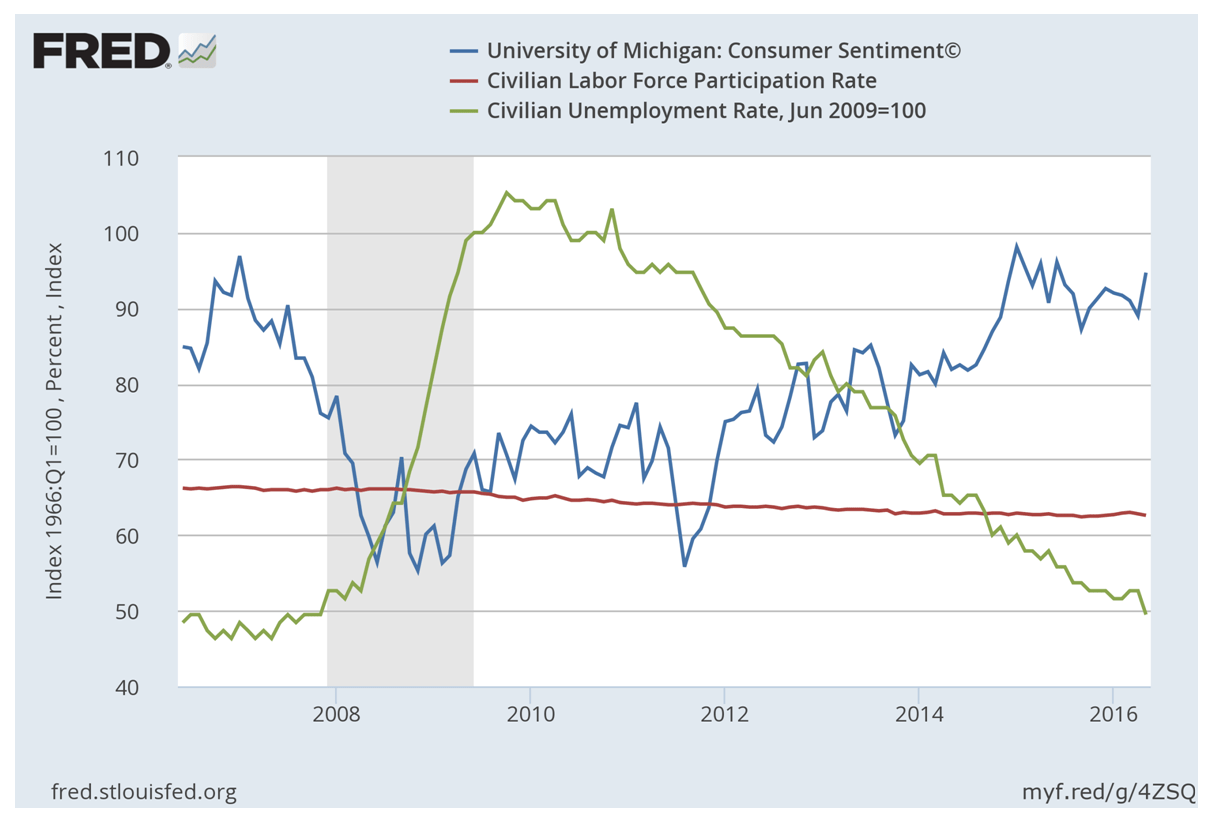
Though employment and consumer sentiment in the U.S. have certainly improved since the financial crisis of 2008-2009, the persistent trend of lower employment participation is thought to dampen the impact of the current, nominally low, unemployment rate relative to previous economic cycles.
Capture10

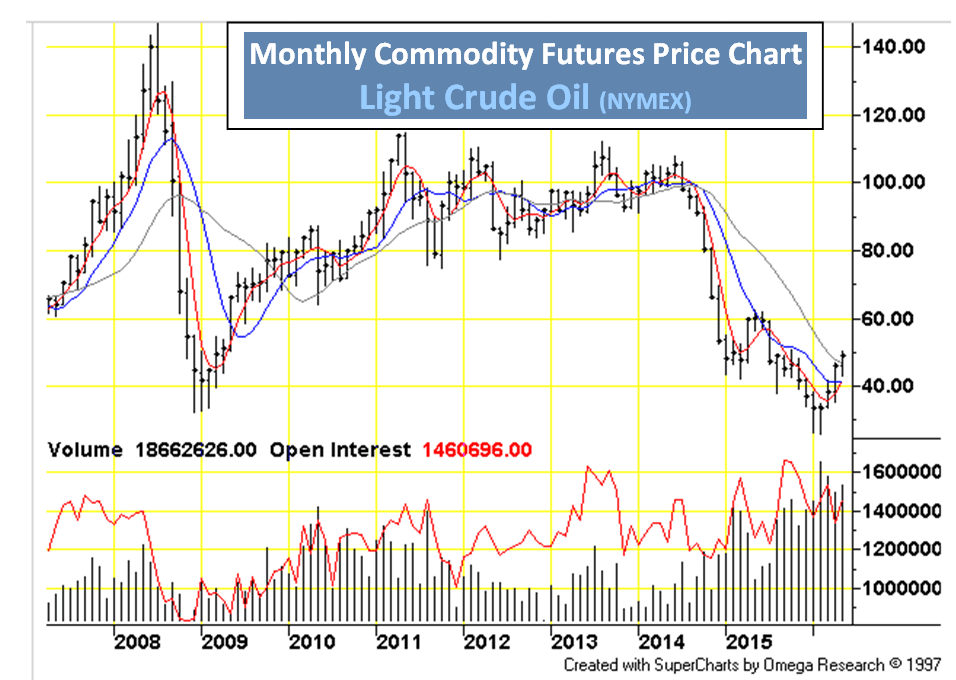
Even though the recent drop in oil and gas prices has stabilized, these essential commodities remain at historically low levels enabling manufacturing, transportation, and leisure travel firms to keep prices low.
Capture11 Capture12

Source: futures.tradingcharts.com

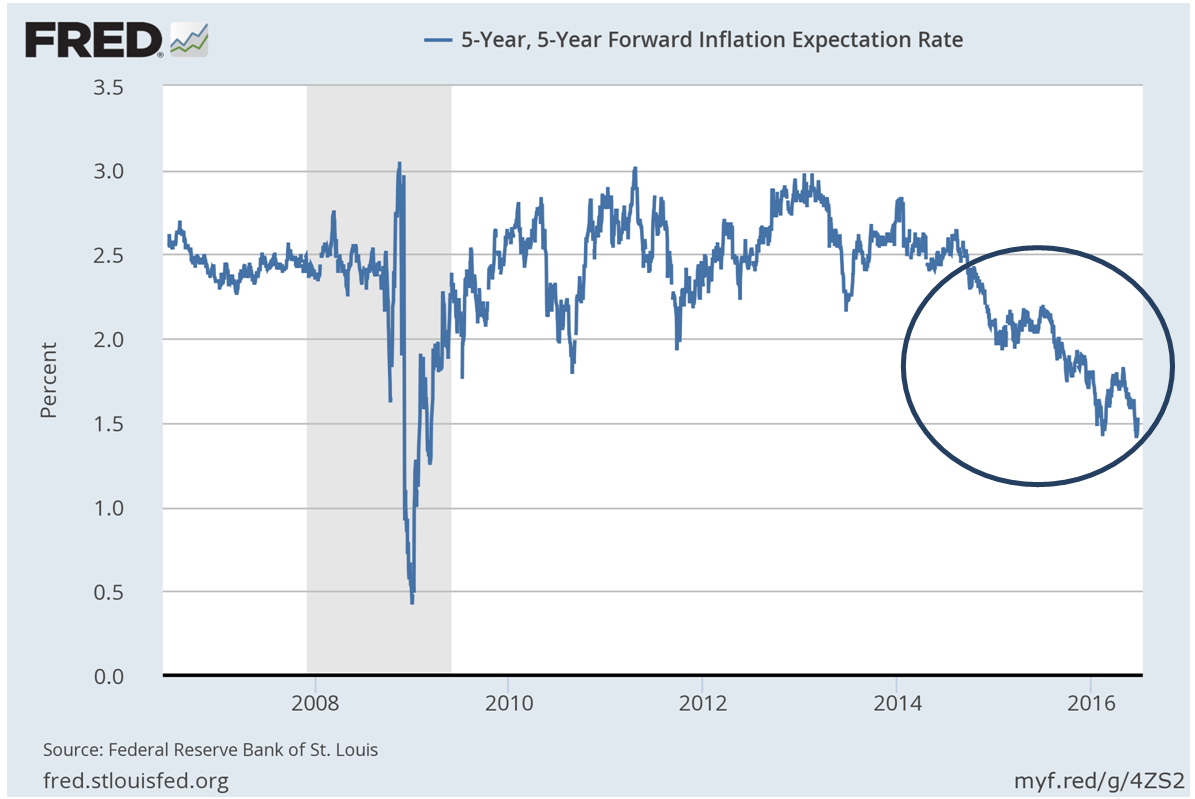
So when are these competing forces going to settle out and the long-awaited inflation pressures manifest themselves? Not any time soon, if the forward inflation rate expectations published by the Federal Reserve Bank of St. Louis are any guide.
Capture13

If inflation pressures are indeed muted on both the supply and demand fronts, and risk appetites are being satisfied with the current level of yield spreads, it is difficult to see where inflation pressures, and therefore interest rate increases, are likely to arise in the near term.

And yet investors cannot endure miniscule real yields indefinitely. Surely there must be something else keeping interest rates low?

As Long as U.S. Treasury Bonds Remain a Safe Haven, Treasury Yields will Remain Low

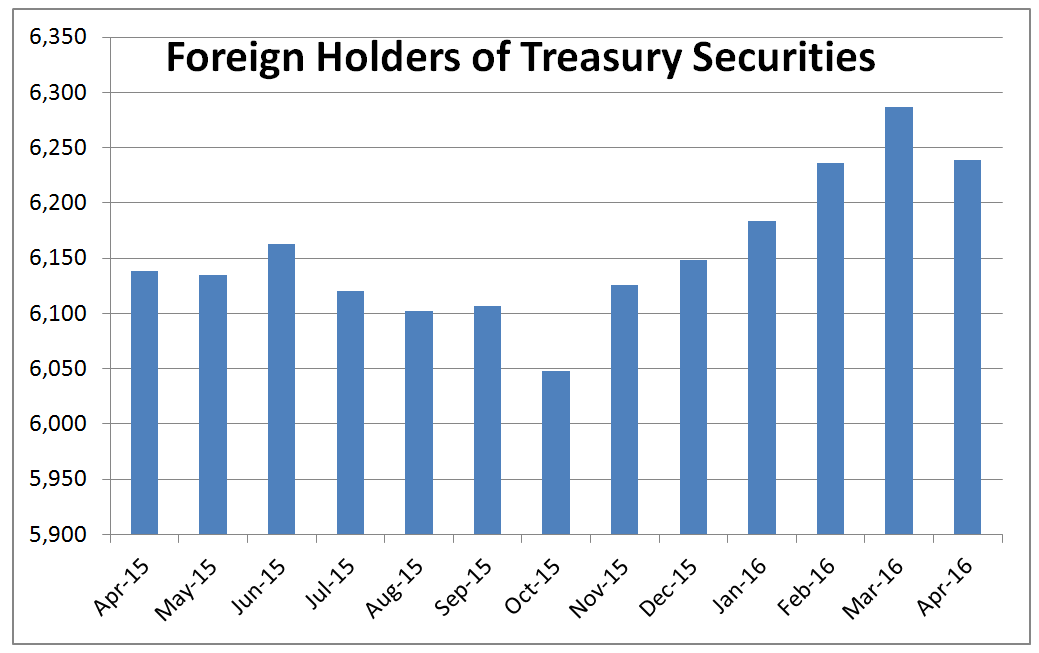
The final piece in the interest rates puzzle comes from outside the ‘birthday cake’; in fact, outside the U.S. entirely. The final piece is the capital ‘flight to safety’ as international investors seek positive returns amid a global economic slowdown and negative interest rates elsewhere in the world.
Capture14Source: U.S. Bureau of Labor Statistics

Given the economic uncertainty caused by the British referendum to leave the European Union, and the dearth of alternative ‘safe haven’ investments, we should expect demand for U.S. securities to remain strong over the near term. Continuing demand for U.S. Treasuries, even at historically low yields, coupled with muted economic activity dampening inflation pressures, means U.S. interest rates can remain low for the foreseeable future.

Eventually, foreign economies should recover and demand for U.S. Treasury securities should fall, pushing yields up to more normal levels as global economic activity strengthens.

But as long as the U.S. is ‘the only game in town’, prudent investors can legitimately maintain the maturities of their portfolios near- to above the standard market index to capture a positive inflation and term premium while awaiting calmer global markets sometime in the intermediate future.


Marcia Clark is an Investment Advisor Representative of Warren Street Wealth Advisors, a Registered Investment Advisor. The information posted here represents her opinions and is not meant as personal or actionable advice to any individual, corporation, or other entity. Any investments discussed carry unique risks and should be carefully considered and reviewed by you and your financial professional.  Nothing in this commentary is a solicitation to buy, or sell, any securities, or an attempt to furnish personal investment advice. We may hold securities referenced in the blog and due to the static nature of content, those securities held may change over time and trades may be contrary to outdated posts.
Brexit, Bremain, Blah, Blah, Blah…

Last week we watched our version of “The City” lose in Game 7 of the NBA Finals, after blowing a 3-1 lead in the series. This week we watch as London, aka, “The City” and the U.K. at large enter their own final referendum homestand on whether to leave or remain in the European Union. Whether the U.K. stays or leaves, most of this outcome will be short term noise, and will deliver little long term impact in our opinion. Similar to how Cleveland winning a championship has their town in hysterics right now, it still won’t change the fact that their rivers light on fire.

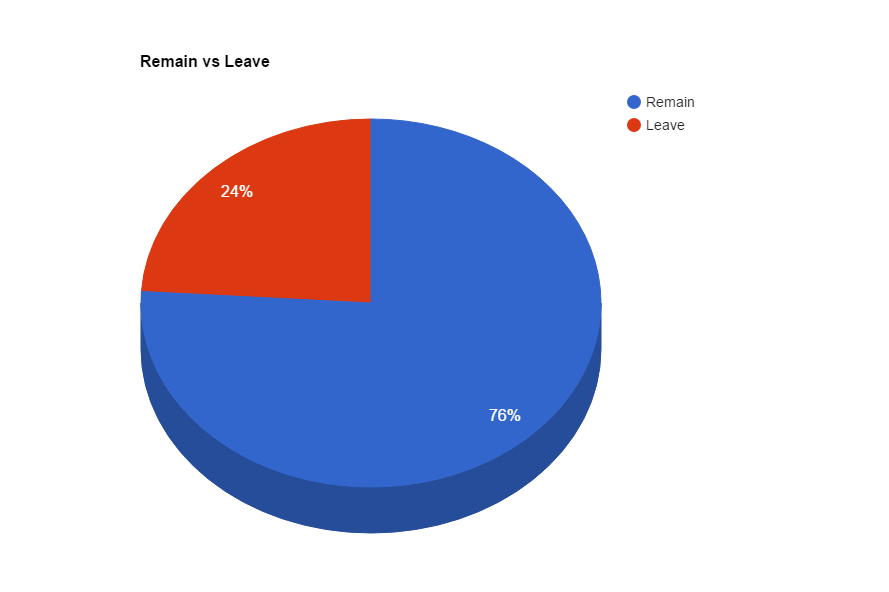
As the clock ticks down, most polls show a healthy balance of IN or OUT voting leading to a proverbial coin flip for the U.K referendum. Consult the odds makers or gambling experts and you’ll get a slightly more confident story for the U.K to remain in the European Union. Let’s see where the money is:

capture1111111

Source: http://www.oddschecker.com/politics/british-politics/eu-referendum/

If the masses turn out to be asses in betting, which would not be a first, what ultimate impact would a “Brexit” have on the EU or U.K. as a whole? Your guess is as good as mine at this point. A successful “Brexit” vote would start a minimum two year process described in Article 50 of the Lisbon Treaty in which E.U. treaties would still apply as negotiations were carried out to determine how the exit is ultimately handled. Big takeaway here is we’re not dealing with a binary event where a switch is flipped and suddenly everything we know about the E.U. changes overnight.

One of the larger talking points we hear discussed is how the U.K. will lose the majority of existing trading agreements and will be on an economic island. This is simply just not true. Sure the U.K. will need to go back to the negotiation table but they’ll have ample opportunity to continue relationships with the common market via the European Economic Area, European Free Trade Area, and even other more regional trade groups. Here’s an example of how many tangled webs one can weave:

File:Supranational European Bodies-en.svg
Source: Wikipedia

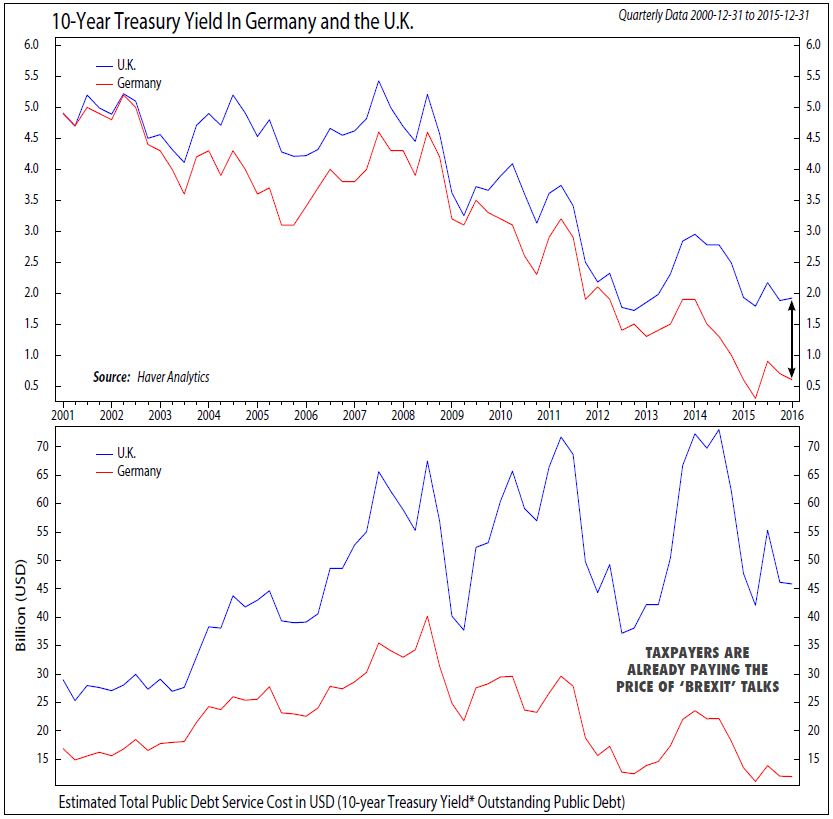
One could argue, and it is our personal sentiment, that much of the market is already pricing in a “Brexit” discount. It appears that the consensus view is that the U.K. would bear the brunt of the near term pain from an exit. This risk premium can be viewed in the form of currency volatility of the British Pound relative to the Euro as of late, shrinking British equity premiums relative to Eurozone stocks, and last but not least higher relative interest rates that lead to increased debt servicing costs. The U.K. and Germany for example have similar public debt loads, but it costs the U.K. approximately an extra $33 billion a year to service its public debt load.

UKvGER Yields

Source: Haver Analytics, Ned Davis Research

Having seen that a “Brexit” discount may already be priced, whether it passes or not, we remain committed to our international holdings and will likely take any near term dip as an opportunity to buy into weakness. Ideally, a remain vote instills confidence in some of the countries on the E.U. periphery that are struggling with structural reform and the European Union as a whole can get back to trend level growth. Something we’ve been patiently waiting for now for years.

All in all, a small part of me will be sad to see the “Brexit” vote come and go, it was a welcome distraction from the impending circus of an election the United States is about to endure. On that note, my counsel remains the same, turn off the TV talking heads, spend time with those you love, grow your value in the workplace, and be a strong steward of your wealth. That’s what we’ll be doing.


Respectfully yours,
Blake Street, CFP®

The A, B, C, & D of Medicare

The A, B, C, & D of Medicare
Breaking down the basics & what each part covers.
Provided by Joe Occhipinti

Whether your 65th birthday is on the horizon or decades away, you should understand the parts of Medicare – what they cover, and where they come from.

Parts A & B: Original Medicare. America created a national health insurance program for seniors in 1965 with two components. Part A is hospital insurance. It provides coverage for inpatient stays at medical facilities. It can also help cover the costs of hospice care, home health care, and nursing home care – but not for long, and only under certain parameters.¹

Seniors are frequently warned that Medicare will only pay for a maximum of 100 days of nursing home care (provided certain conditions are met). Part A is the part that does so. Under current rules, you pay $0 for days 1-20 of skilled nursing facility (SNF) care under Part A. During days 21-100, a $161 daily coinsurance payment may be required of you.²

If you stop receiving SNF care for 30 days, you need a new 3-day hospital stay to qualify for further nursing home care under Part A. If you can go 60 days in a row without SNF care, the clock resets: you are once again eligible for up to 100 days of SNF benefits via Part A.²

Part B is medical insurance and can help pick up some of the tab for physical therapy, physician services, expenses for durable medical equipment (scooters, wheelchairs), and other medical services such as lab tests and varieties of health screenings.¹

Part B isn’t free. You pay monthly premiums to get it and a yearly deductible (plus 20% of costs). The premiums vary according to the Medicare recipient’s income level; in 2016, most Medicare recipients are paying $121.80 a month for their Part B coverage. The current yearly deductible is $166. Some people automatically get Part B, but others have to sign up for it.³

Part C: Medicare Advantage plans. Insurance companies offer these Medicare-approved plans. Part C plans offer seniors all the benefits of Part A and Part B and more: many feature prescription drug coverage and vision and dental benefits. To enroll in a Part C plan, you need have Part A and Part B coverage in place. To keep up your Part C coverage, you must keep up your payment of Part B premiums as well as your Part C premiums.4

To say not all Part C plans are alike is an understatement. Provider networks, premiums, copays, coinsurance, and out-of-pocket spending limits can all vary widely, so shopping around is wise. During Medicare’s annual Open Enrollment Period (Oct. 15 – Dec. 7), seniors can choose to switch out of Original Medicare to a Part C plan or vice versa; although any such move is much wiser with a Medigap policy already in place.5

How does a Medigap plan differ from a Part C plan? Medigap plans (also called Medicare Supplement plans) emerged to address the gaps in Part A and Part B coverage. If you have Part A and Part B already in place, a Medigap policy can pick up some copayments, coinsurance, and deductibles for you. Some Medigap policies can even help you pay for medical care outside the United States. You have to pay Part B premiums in addition to Medigap plan premiums to keep a Medigap policy in effect. These plans no longer offer prescription drug coverage; in fact, they have been sold without drug coverage since 2006.6   

Part D: prescription drug plans. While Part C plans commonly offer prescription drug coverage, insurers also sell Part D plans as a standalone product to those with Original Medicare. As per Medigap and Part C coverage, you need to keep paying Part B premiums in addition to premiums for the drug plan to keep Part D coverage going.7

Every Part D plan has a formulary, a list of medications covered under the plan. Most Part D plans rank approved drugs into tiers by cost. The good news is that Medicare’s website will determine the best Part D plan for you. Go to medicare.gov/find-a-plan to start your search; enter your medications and the website will do the legwork for you.8

Part C & Part D plans are assigned ratings. Medicare annually rates these plans (one star being worst; five stars being best) according to member satisfaction, provider network(s), and quality of coverage. As you search for a plan at medicare.gov, you also have a chance to check out the rankings.9


Joe Occhipinti may be reached at 714.823.3328 or Joe@Warrenstreetwealth.com

www.warrenstreetwealth.com

This material was prepared by MarketingPro, Inc., and does not necessarily represent the views of the presenting party, nor their affiliates. This information has been derived from sources believed to be accurate. Please note – investing involves risk, and past performance is no guarantee of future results. The publisher is not engaged in rendering legal, accounting or other professional services. If assistance is needed, the reader is advised to engage the services of a competent professional. This information should not be construed as investment, tax or legal advice and may not be relied on for the purpose of avoiding any Federal tax penalty. This is neither a solicitation nor recommendation to purchase or sell any investment or insurance product or service, and should not be relied upon as such. All indices are unmanaged and are not illustrative of any particular investment.

Citations.

1 – mymedicarematters.org/coverage/parts-a-b/whats-covered/ [6/13/16]
2 – medicare.gov/coverage/skilled-nursing-facility-care.html [6/13/16]
3 – medicare.gov/your-medicare-costs/part-b-costs/part-b-costs.html [6/13/16]
4 – tinyurl.com/hbll34m [6/13/16]
5 – medicare.gov/sign-up-change-plans/when-can-i-join-a-health-or-drug-plan/when-can-i-join-a-health-or-drug-plan.html#collapse-3192 [6/13/16]
6 – medicare.gov/supplement-other-insurance/medigap/whats-medigap.html [6/13/16]
7 – ehealthinsurance.com/medicare/part-d-cost [6/13/16]
8 – medicare.gov/part-d/coverage/part-d-coverage.html [6/13/16]
9 – medicare.gov/sign-up-change-plans/when-can-i-join-a-health-or-drug-plan/five-star-enrollment/5-star-enrollment-period.html [6/13/16]


What Are Catch-Up Contributions Really Worth?

What Are Catch-Up Contributions Really Worth?
What degree of difference could they make for you in retirement?
Provided by Joe Occhipinti

At a certain age, you are allowed to boost your yearly retirement account contributions. For example, you can direct an extra $1,000 per year into a Roth or traditional IRA starting in the year you turn 50.¹

Your initial reaction to that may be: “So what? What will an extra $1,000 a year in retirement savings really do for me?”

That reaction is understandable, but consider also that you can contribute an extra $6,000 a year to many workplace retirement plans starting at age 50. As you likely have both types of accounts, the opportunity to save and invest up to $7,000 a year more toward your retirement savings effort may elicit more enthusiasm.¹ ²

What could regular catch-up contributions from age 50-65 potentially do for you? They could result in an extra $1,000 a month in retirement income, according to the calculations of retirement plan giant Fidelity. To be specific, Fidelity says that an employee who contributes $24,000 instead of $18,000 annually to the typical employer-sponsored plan could see that kind of positive impact. ²

To put it another way, how would you like an extra $50,000 or $100,000 in retirement savings? Making regular catch-up contributions might help you bolster your retirement funds by that much – or more.  Plugging in some numbers provides a nice (albeit hypothetical) illustration.³

Even if you simply make $1,000 additional yearly contributions to a Roth or traditional IRA starting in the year you turn 50, those accumulated catch-ups will grow and compound to about $22,000 when you are 65 if the IRA yields just 4% annually. At an 8% annual return, you will be looking at about $30,000 extra for retirement. (Besides all this, a $1,000 catch-up contribution to a traditional IRA can also reduce your income tax bill by $1,000 for that year.)³   

If you direct $24,000 a year rather than $18,000 a year into one of the common workplace retirement plans starting at age 50, the math works out like this: you end up with about $131,000 in 15 years at a 4% annual return, and $182,000 by age 65 at an 8% annual return.³

If your financial situation allows you to max out catch-up contributions for both types of accounts, the effect may be profound indeed. Fifteen years of regular, maximum catch-up contributions to both an IRA and a workplace retirement plan would generate $153,000 by age 65 at a 4% annual yield, and $212,000 at an 8% annual yield.³

The more you earn, the greater your capacity to “catch up.” This may not be fair, but it is true.

Fidelity says its overall catch-up contribution participation rate is just 8%. The average account balance of employees 50 and older making catch-ups was $417,000, compared to $157,000 for employees who refrained. Vanguard, another major provider of employer-sponsored retirement plans, finds that 42% of workers aged 50 and older who earn more than $100,000 per year make catch-up contributions to its plans, compared with 16% of workers on the whole within that demographic.²

Even if you are hard-pressed to make or max out the catch-up each year, you may have a spouse who is able to make catch-ups. Perhaps one of you can make a full catch-up contribution when the other cannot, or perhaps you can make partial catch-ups together. In either case, you are still taking advantage of the catch-up rules.

Catch-up contributions should not be dismissed. They can be crucial if you are just starting to save for retirement in middle age or need to rebuild retirement savings at mid-life. Consider making them; they may make a significant difference for your savings effort.  


Joe Occhipinti may be reached at 714.823.3328 or Joe@warrenstreetwealth.com


www.warrenstreetwealth.com

This material was prepared by MarketingPro, Inc., and does not necessarily represent the views of the presenting party, nor their affiliates. This information has been derived from sources believed to be accurate. Please note – investing involves risk, and past performance is no guarantee of future results. The publisher is not engaged in rendering legal, accounting or other professional services. If assistance is needed, the reader is advised to engage the services of a competent professional. This information should not be construed as investment, tax or legal advice and may not be relied on for the purpose of avoiding any Federal tax penalty. This is neither a solicitation nor recommendation to purchase or sell any investment or insurance product or service, and should not be relied upon as such. All indices are unmanaged and are not illustrative of any particular investment.

Citations.
1 – nasdaq.com/article/retirement-savings-basics-sign-up-for-ira-roth-or-401k-cm627195 [11/30/15]
2 – time.com/money/4175048/401k-catch-up-contributions/ [1/11/16]
3 – marketwatch.com/story/you-can-make-a-lot-of-money-with-retirement-account-catch-up-contributions-2016-03-21 [3/21/16]


Black April: The Twitch Partner Reckoning

April 2016 may have seemed like just another month on Twitch.tv, but the volume of Twitch partners struggling with the complexity of taxes on social media was louder than ever.


People are continuing to take their hobby of streaming video games and turning it into careers, many with great success. These successful careers are creating lives for many people that they haven’t experienced before, getting paid to do what they love. With this new found success and income came an increase in payments to the outstretched hand of the tax man, Uncle Sam. While for a majority of the people who have experienced this before, their thought may be: “Seems standard.” In this case, many who were impacted the most were not prepared for the impending tax bill and did not know what steps to take to soften the blow. Successful streamers in the past got away with standard tax preparations in their first year of business, but they did not anticipate the increase in the complexity of their taxes with the increase in their annual pay. This has always been a problem for those making a significant amount of money, a relatively new situation in the Twitch world.


Obviously, some may allude to the fact that tax preparation should be common knowledge. It’s hard to disagree with that statement, but many of these young entrepreneurs look at themselves as employees taking home a paycheck instead of as small business owners looking to manage their tax burden. Streamers who grew their respective gaming communities were thrust into a new position that some were not prepared for from a financial standpoint.


What is the glaring issue here? The main issue was the lack of knowledge on the streamer front as to how to handle taxes proactively. This was a first time experience for many, and for someone working under the 1099 independent contractor banner, it can be easily forgotten that taxes are a looming liability. The even more forgotten concern is the full 15.3% payroll tax that becomes the liability of the streamer versus only paying half as a W2 employee. If taxes are not adequately addressed in the current tax year, it can create years of future problems, additional payments, and more time spent dealing with the IRS.


The silver lining to this story is the viability of the interactive media market as a career for professional players, streamers, or content creators. This growing market is a breeding ground for sponsors to find new users of their products and create lifetime customers. Each micro-community on Twitch represents a unique opportunity for streamers to leverage their audience.


With taxes continuing to be an annual problem for streamers, there are solutions. Individual firms, consultants, and even pro-bono counseling groups are being formed for the sole purpose to better educate, prepare, and potentially offer professional services to those in need. One example is the Player Resource Center being developed by esports lawyer Bryce Blum and former professional gamer Stephen “Snoopeh” Ellis to fill this exact void. The growing interactive media environment needs professional infrastructure to help it continue to thrive into the future.


Outside of being able to generate a living via streaming, the biggest financial problem that streamers face is proper consideration towards taxes at the end of the year. With many firms looking to help and resources becoming available to those in need, there is hope that these entrepreneurs will continue to increase their efficiency and make the most of their success for years to come.

warrenstreetadvisors006
Joe Occhipinti
Joe@warrenstreetwealth.com
714.823.3328

Retirement Planning Isn’t Just For “Retirees”

Retirement Planning Isn’t Just for “Retirees”
By: Joe Occhipinti


When people discuss the topic of saving or planning for retirement, the picture that often comes to mind is that of an employee that has been working for the same company for 20+ years and is on the verge of retirement.

When I hear about planning and saving for retirement, I find myself thinking about those who are 20+ years away and need to make the most of one variable that cannot be replaced – time.

Time is precious, and when it comes to preparing for retirement making up for lost time is one of the most difficult things to do. One of the most basic ways we see this is employees missing out on years of 401(k) matching contributions from their employer. A match can be a 100% return on your investment, assuming you are fully vested. That’s a tough return to beat in any financial market.

Too often financial planning and saving for retirement gets thrown to the wayside as something that can be put off for another year. For some, that could be an additional 6% of their salary they are choosing to forgo in their 401(k). If you got an additional 6% of your salary per year added to your retirement account, then how much sooner do you think you’ll be able to retire? How much stronger would your retirement look?

The other key piece of a strong retirement is a financial plan. A sound financial plan should you help surface all facets of your financial picture and ultimately how each piece helps or hinders you from achieving your long term goals. This includes budgeting, savings, investing, and managing risk.

Debt is probably the most often overlooked and underestimated piece of planning. Holding on to excessive debt during your working years can really put a damper on your ability to retire, especially if you have a large amount prior to retirement. Don’t let lack of planning be the sole reason for you to not get the retirement you’ve been dreaming of.

The final thoughts I will leave you with are: 1) Do I want to retire? 2) If I begin contributing to my 401k today, then how much do my chances of a successful retirement increase? 3) Am I managing debt appropriately? 4) Have I put enough time into financial planning to build a strong retirement?

Take the necessary steps to put you on track for retirement, whether that’s 2 or 20 years away.


warrenstreetadvisors006

Joe Occhipinti
Wealth Advisor
Joe@Warrenstreetwealth.com
714.823.3328

Investment Advisor Representative, Warren Street Wealth Advisors, LLC., a Registered Investment Advisor.
The information posted here represents opinions and is not means as personal or actionable advice to any individual, corporation, or other entity, Any investments discussed carry unique risks and should be carefully considered and reviewed by you and your financial professional. Nothing in this presentation is a solicitation to buy, or sell, any securities, or an attempt to furnish personal investment advice. We may hold securities referenced in the presentation and due to the static nature of content, those securities help may change over time and trade may be contrary to outdated posts.

Should You Downsize for Retirement?

Some retirees save a great deal of money by doing so; others do not.
Provided by Joe Occhipinti


You want to retire, and you own a large home that is nearly or fully paid off. The kids are gone, but the upkeep costs haven’t fallen. Should you retire and keep your home? Or sell your home and retire? Maybe it’s time to downsize.

Lower housing expenses could put more cash in your pocket. If your home isn’t paid off yet, have you considered how much money is going toward the home loan? When you took out your mortgage, your lender likely wanted your monthly payment to amount to no more than 28% of your total gross income, or no more than 36% of your total monthly debt repayments. Those are pretty standard metrics in the mortgage industry.1

What percentage of your gross income are you devoting to your mortgage payments today? Even if your home loan is 15 or 20 years old, you still may be devoting a significant part of your gross income to it. When you move to a smaller home, your mortgage expenses may lessen (or disappear) and your cash flow may greatly increase.

You might even be able to buy a smaller home with cash (if finances permit) and cut your tax liability. Optionally, that smaller home could be in a state or region with lower income taxes and a lower cost of living.

You could capitalize on some home equity. Why not convert some home equity into retirement income? If you were forced into early retirement by some corporate downsizing, you might have a sudden and pressing need for retirement capital, another reason to sell that home you bought decades ago and head for a smaller one.

The lifestyle reasons to downsize (or not). Maybe your home is too much to keep up, or maybe you don’t want to climb stairs anymore. Maybe a condo or an over-55 community appeals to you. Maybe you want to be where it seldom snows.

On the other hand, you may want and need the familiarity of your current home and your immediate neighborhood (not to mention the friends close by).

Sometimes retirees underestimate the cost of downsizing. Even the logistics can be expensive. As Kiplinger notes, just packing up and moving a two-bedroom condominium’s worth of furniture will cost about $1,500 if you are resettling locally. If you are sending it across the country, the journey could take $5,000 or more. If you can’t sell or move everything, the excess may go into storage, and the price tag on that may be well over $100 a month. In selling your home, you will probably pay commissions to both your agent and the buyer’s agent that add up to 6% of the sale price.2

Some people want to retire and then sell their home, but it may be wiser to sell a home and then retire if the real estate market slows. If you sell sooner instead of later, you can always rent until you find a smaller house that could save you thousands (or tens of thousands) of dollars over time.

Run the numbers as accurately as you think you can before you make a move. Downsizing always seems to have a hidden cost or two, but for many retirees, it can open a door to long-term savings. Other seniors may find it cheaper to age in place.


Joe Occhipinti may be reached at 714.823.3328 or Joe@warrenstreetwealth.com.

www.WarrenStreetWealth.com

This material was prepared by MarketingPro, Inc., and does not necessarily represent the views of the presenting party, nor their affiliates. This information has been derived from sources believed to be accurate. Please note – investing involves risk, and past performance is no guarantee of future results. The publisher is not engaged in rendering legal, accounting or other professional services. If assistance is needed, the reader is advised to engage the services of a competent professional. This information should not be construed as investment, tax or legal advice and may not be relied on for the purpose of avoiding any Federal tax penalty. This is neither a solicitation nor recommendation to purchase or sell any investment or insurance product or service, and should not be relied upon as such. All indices are unmanaged and are not illustrative of any particular investment.


Citations.

1 – nerdwallet.com/blog/mortgages/two-ways-to-determine-how-much-house-you-can-afford/ [2/3/16]
2 – kiplinger.com/article/retirement/T010-C022-S002-downsizing-costs-add-up.html [4/1/16]