The A, B, C, & D of Medicare

The A, B, C, & D of Medicare
Breaking down the basics & what each part covers.
Provided by Joe Occhipinti

Whether your 65th birthday is on the horizon or decades away, you should understand the parts of Medicare – what they cover, and where they come from.

Parts A & B: Original Medicare. America created a national health insurance program for seniors in 1965 with two components. Part A is hospital insurance. It provides coverage for inpatient stays at medical facilities. It can also help cover the costs of hospice care, home health care, and nursing home care – but not for long, and only under certain parameters.¹

Seniors are frequently warned that Medicare will only pay for a maximum of 100 days of nursing home care (provided certain conditions are met). Part A is the part that does so. Under current rules, you pay $0 for days 1-20 of skilled nursing facility (SNF) care under Part A. During days 21-100, a $161 daily coinsurance payment may be required of you.²

If you stop receiving SNF care for 30 days, you need a new 3-day hospital stay to qualify for further nursing home care under Part A. If you can go 60 days in a row without SNF care, the clock resets: you are once again eligible for up to 100 days of SNF benefits via Part A.²

Part B is medical insurance and can help pick up some of the tab for physical therapy, physician services, expenses for durable medical equipment (scooters, wheelchairs), and other medical services such as lab tests and varieties of health screenings.¹

Part B isn’t free. You pay monthly premiums to get it and a yearly deductible (plus 20% of costs). The premiums vary according to the Medicare recipient’s income level; in 2016, most Medicare recipients are paying $121.80 a month for their Part B coverage. The current yearly deductible is $166. Some people automatically get Part B, but others have to sign up for it.³

Part C: Medicare Advantage plans. Insurance companies offer these Medicare-approved plans. Part C plans offer seniors all the benefits of Part A and Part B and more: many feature prescription drug coverage and vision and dental benefits. To enroll in a Part C plan, you need have Part A and Part B coverage in place. To keep up your Part C coverage, you must keep up your payment of Part B premiums as well as your Part C premiums.4

To say not all Part C plans are alike is an understatement. Provider networks, premiums, copays, coinsurance, and out-of-pocket spending limits can all vary widely, so shopping around is wise. During Medicare’s annual Open Enrollment Period (Oct. 15 – Dec. 7), seniors can choose to switch out of Original Medicare to a Part C plan or vice versa; although any such move is much wiser with a Medigap policy already in place.5

How does a Medigap plan differ from a Part C plan? Medigap plans (also called Medicare Supplement plans) emerged to address the gaps in Part A and Part B coverage. If you have Part A and Part B already in place, a Medigap policy can pick up some copayments, coinsurance, and deductibles for you. Some Medigap policies can even help you pay for medical care outside the United States. You have to pay Part B premiums in addition to Medigap plan premiums to keep a Medigap policy in effect. These plans no longer offer prescription drug coverage; in fact, they have been sold without drug coverage since 2006.6   

Part D: prescription drug plans. While Part C plans commonly offer prescription drug coverage, insurers also sell Part D plans as a standalone product to those with Original Medicare. As per Medigap and Part C coverage, you need to keep paying Part B premiums in addition to premiums for the drug plan to keep Part D coverage going.7

Every Part D plan has a formulary, a list of medications covered under the plan. Most Part D plans rank approved drugs into tiers by cost. The good news is that Medicare’s website will determine the best Part D plan for you. Go to medicare.gov/find-a-plan to start your search; enter your medications and the website will do the legwork for you.8

Part C & Part D plans are assigned ratings. Medicare annually rates these plans (one star being worst; five stars being best) according to member satisfaction, provider network(s), and quality of coverage. As you search for a plan at medicare.gov, you also have a chance to check out the rankings.9


Joe Occhipinti may be reached at 714.823.3328 or Joe@Warrenstreetwealth.com

www.warrenstreetwealth.com

This material was prepared by MarketingPro, Inc., and does not necessarily represent the views of the presenting party, nor their affiliates. This information has been derived from sources believed to be accurate. Please note – investing involves risk, and past performance is no guarantee of future results. The publisher is not engaged in rendering legal, accounting or other professional services. If assistance is needed, the reader is advised to engage the services of a competent professional. This information should not be construed as investment, tax or legal advice and may not be relied on for the purpose of avoiding any Federal tax penalty. This is neither a solicitation nor recommendation to purchase or sell any investment or insurance product or service, and should not be relied upon as such. All indices are unmanaged and are not illustrative of any particular investment.

Citations.

1 – mymedicarematters.org/coverage/parts-a-b/whats-covered/ [6/13/16]
2 – medicare.gov/coverage/skilled-nursing-facility-care.html [6/13/16]
3 – medicare.gov/your-medicare-costs/part-b-costs/part-b-costs.html [6/13/16]
4 – tinyurl.com/hbll34m [6/13/16]
5 – medicare.gov/sign-up-change-plans/when-can-i-join-a-health-or-drug-plan/when-can-i-join-a-health-or-drug-plan.html#collapse-3192 [6/13/16]
6 – medicare.gov/supplement-other-insurance/medigap/whats-medigap.html [6/13/16]
7 – ehealthinsurance.com/medicare/part-d-cost [6/13/16]
8 – medicare.gov/part-d/coverage/part-d-coverage.html [6/13/16]
9 – medicare.gov/sign-up-change-plans/when-can-i-join-a-health-or-drug-plan/five-star-enrollment/5-star-enrollment-period.html [6/13/16]


What Are Catch-Up Contributions Really Worth?

What Are Catch-Up Contributions Really Worth?
What degree of difference could they make for you in retirement?
Provided by Joe Occhipinti

At a certain age, you are allowed to boost your yearly retirement account contributions. For example, you can direct an extra $1,000 per year into a Roth or traditional IRA starting in the year you turn 50.¹

Your initial reaction to that may be: “So what? What will an extra $1,000 a year in retirement savings really do for me?”

That reaction is understandable, but consider also that you can contribute an extra $6,000 a year to many workplace retirement plans starting at age 50. As you likely have both types of accounts, the opportunity to save and invest up to $7,000 a year more toward your retirement savings effort may elicit more enthusiasm.¹ ²

What could regular catch-up contributions from age 50-65 potentially do for you? They could result in an extra $1,000 a month in retirement income, according to the calculations of retirement plan giant Fidelity. To be specific, Fidelity says that an employee who contributes $24,000 instead of $18,000 annually to the typical employer-sponsored plan could see that kind of positive impact. ²

To put it another way, how would you like an extra $50,000 or $100,000 in retirement savings? Making regular catch-up contributions might help you bolster your retirement funds by that much – or more.  Plugging in some numbers provides a nice (albeit hypothetical) illustration.³

Even if you simply make $1,000 additional yearly contributions to a Roth or traditional IRA starting in the year you turn 50, those accumulated catch-ups will grow and compound to about $22,000 when you are 65 if the IRA yields just 4% annually. At an 8% annual return, you will be looking at about $30,000 extra for retirement. (Besides all this, a $1,000 catch-up contribution to a traditional IRA can also reduce your income tax bill by $1,000 for that year.)³   

If you direct $24,000 a year rather than $18,000 a year into one of the common workplace retirement plans starting at age 50, the math works out like this: you end up with about $131,000 in 15 years at a 4% annual return, and $182,000 by age 65 at an 8% annual return.³

If your financial situation allows you to max out catch-up contributions for both types of accounts, the effect may be profound indeed. Fifteen years of regular, maximum catch-up contributions to both an IRA and a workplace retirement plan would generate $153,000 by age 65 at a 4% annual yield, and $212,000 at an 8% annual yield.³

The more you earn, the greater your capacity to “catch up.” This may not be fair, but it is true.

Fidelity says its overall catch-up contribution participation rate is just 8%. The average account balance of employees 50 and older making catch-ups was $417,000, compared to $157,000 for employees who refrained. Vanguard, another major provider of employer-sponsored retirement plans, finds that 42% of workers aged 50 and older who earn more than $100,000 per year make catch-up contributions to its plans, compared with 16% of workers on the whole within that demographic.²

Even if you are hard-pressed to make or max out the catch-up each year, you may have a spouse who is able to make catch-ups. Perhaps one of you can make a full catch-up contribution when the other cannot, or perhaps you can make partial catch-ups together. In either case, you are still taking advantage of the catch-up rules.

Catch-up contributions should not be dismissed. They can be crucial if you are just starting to save for retirement in middle age or need to rebuild retirement savings at mid-life. Consider making them; they may make a significant difference for your savings effort.  


Joe Occhipinti may be reached at 714.823.3328 or Joe@warrenstreetwealth.com


www.warrenstreetwealth.com

This material was prepared by MarketingPro, Inc., and does not necessarily represent the views of the presenting party, nor their affiliates. This information has been derived from sources believed to be accurate. Please note – investing involves risk, and past performance is no guarantee of future results. The publisher is not engaged in rendering legal, accounting or other professional services. If assistance is needed, the reader is advised to engage the services of a competent professional. This information should not be construed as investment, tax or legal advice and may not be relied on for the purpose of avoiding any Federal tax penalty. This is neither a solicitation nor recommendation to purchase or sell any investment or insurance product or service, and should not be relied upon as such. All indices are unmanaged and are not illustrative of any particular investment.

Citations.
1 – nasdaq.com/article/retirement-savings-basics-sign-up-for-ira-roth-or-401k-cm627195 [11/30/15]
2 – time.com/money/4175048/401k-catch-up-contributions/ [1/11/16]
3 – marketwatch.com/story/you-can-make-a-lot-of-money-with-retirement-account-catch-up-contributions-2016-03-21 [3/21/16]


Retirement Planning Isn’t Just For “Retirees”

Retirement Planning Isn’t Just for “Retirees”
By: Joe Occhipinti


When people discuss the topic of saving or planning for retirement, the picture that often comes to mind is that of an employee that has been working for the same company for 20+ years and is on the verge of retirement.

When I hear about planning and saving for retirement, I find myself thinking about those who are 20+ years away and need to make the most of one variable that cannot be replaced – time.

Time is precious, and when it comes to preparing for retirement making up for lost time is one of the most difficult things to do. One of the most basic ways we see this is employees missing out on years of 401(k) matching contributions from their employer. A match can be a 100% return on your investment, assuming you are fully vested. That’s a tough return to beat in any financial market.

Too often financial planning and saving for retirement gets thrown to the wayside as something that can be put off for another year. For some, that could be an additional 6% of their salary they are choosing to forgo in their 401(k). If you got an additional 6% of your salary per year added to your retirement account, then how much sooner do you think you’ll be able to retire? How much stronger would your retirement look?

The other key piece of a strong retirement is a financial plan. A sound financial plan should you help surface all facets of your financial picture and ultimately how each piece helps or hinders you from achieving your long term goals. This includes budgeting, savings, investing, and managing risk.

Debt is probably the most often overlooked and underestimated piece of planning. Holding on to excessive debt during your working years can really put a damper on your ability to retire, especially if you have a large amount prior to retirement. Don’t let lack of planning be the sole reason for you to not get the retirement you’ve been dreaming of.

The final thoughts I will leave you with are: 1) Do I want to retire? 2) If I begin contributing to my 401k today, then how much do my chances of a successful retirement increase? 3) Am I managing debt appropriately? 4) Have I put enough time into financial planning to build a strong retirement?

Take the necessary steps to put you on track for retirement, whether that’s 2 or 20 years away.


warrenstreetadvisors006

Joe Occhipinti
Wealth Advisor
Joe@Warrenstreetwealth.com
714.823.3328

Investment Advisor Representative, Warren Street Wealth Advisors, LLC., a Registered Investment Advisor.
The information posted here represents opinions and is not means as personal or actionable advice to any individual, corporation, or other entity, Any investments discussed carry unique risks and should be carefully considered and reviewed by you and your financial professional. Nothing in this presentation is a solicitation to buy, or sell, any securities, or an attempt to furnish personal investment advice. We may hold securities referenced in the presentation and due to the static nature of content, those securities help may change over time and trade may be contrary to outdated posts.

You Retire, But Your Spouse Still Works

That development may mean lifestyle as well as financial adjustments.
Provided by Joe Occhipinti

 Your significant other may retire later than you do. Sometimes that reality reflects an age difference, other times one person wants to keep working for income or health coverage reasons. If you retire years before your spouse or partner does, you may want to consider how your lifestyle might change as well as your household finances.

How will retiring affect your identity? If you are one of those people who derives a great deal of pride and sense of self from your profession, leaving that career for life around the house may feel odd. Who are you now? Who will you become next? Can you retire and still be who you were? Hopefully, your spouse recognizes that you may have to entertain these questions. They may prompt some soul-searching, even enough to affect a relationship.

How much down time do you want? That is worth discussing with your spouse or partner. If you absolutely hate your job, you may want weeks, months, or years of relaxation after leaving it. You can figure out what to do next in good time. Alternately, you may see every day of retirement as a day for achievement; a day to get something done or connect with someone new. Your significant other should know whether you prefer an active, ambitious retirement or a more relaxed one.

How will household chores or caregiving be handled? Picture your loved one arising at 6:30am on a January morning, bundling up, heading for work and navigating inclement weather, all as you sleep in. Your spouse or partner may grow a bit envious of your retirement freedom. One way to offset that envy is to assume more of the everyday chores around the house.

For many baby boomers, caregiving is also a daily event. When one spouse or partner retires, that can rebalance the caregiving “equation.” One or more individuals have to provide 100% of the eldercare needed, and retirement can make shared percentages more equitable or allow a greater role for a son or daughter in that caregiving. Some people even retire to become a caregiver to Mom or Dad.

Do you have kids living at home? Adult children? Right now, in this country, every fifth young adult is living with his or her parents. With so many new college graduates having to accept part-time or low-paying service industry jobs, and with education loan debt averaging roughly $30,000 per indebted graduate, this situation will persist for years and, perhaps, even become a new normal.1

You and your loved ones may find yourself on different timetables. Maybe your spouse or partner works from 8:00 a.m. to 5:00 p.m. in a high-stress job. Maybe your children attend school on roughly the same schedule. How do they get to and from those places? Probably through a rush-hour commute, either in a car or amid the crowds lined up for mass transit. If you have abandoned the daily grind, you may have an enthusiasm and a chattiness in the evening that they lack. Maybe they just want to unwind at 6:30pm, but you might be anxious to reconnect with them after a day alone at home.

Talk about retirement before you retire. What should your daily life look like? What are the most important things you want out of the retirement experience? How do your answers to those questions align or contrast with the answers of your best friend? As you retire, make sure that your spouse or partner knows your point of view, and be sure to respect his or hers in the bargain.

Joe Occhipinti may be reached at 714.823.3328 or Joe@warrenstreetwealth.com.

www.WarrenStreetWealth.com

This material was prepared by MarketingPro, Inc., and does not necessarily represent the views of the presenting party, nor their affiliates. This information has been derived from sources believed to be accurate. Please note – investing involves risk, and past performance is no guarantee of future results. The publisher is not engaged in rendering legal, accounting or other professional services. If assistance is needed, the reader is advised to engage the services of a competent professional. This information should not be construed as investment, tax or legal advice and may not be relied on for the purpose of avoiding any Federal tax penalty. This is neither a solicitation nor recommendation to purchase or sell any investment or insurance product or service, and should not be relied upon as such. All indices are unmanaged and are not illustrative of any particular investment.


Citations.

1 – chicagotribune.com/business/success/savingsgame/tca-boomerang-children-affecting-parents-retirement-plans-20160413-story.html [4/13/16]

National Lineman Appreciation Day

We at Warren Street Wealth Advisors want to personally thank all of the lineman out there in the world.

These brave people are on call 24/7, 365 to make sure that we still can still have power in all of our house, along with all the other luxuries we enjoy in our home.

From all of us at Warren Street, thank you for all that you do. We greatly appreciate it.

Turmoil in China, Oil, and the US Markets

Why is the turmoil in China and the drop in oil prices depressing the U.S. markets?

Marcia Clark, CFA, MBA, Senior Research Analyst & Wealth Advisor, Warren Street Wealth Advisors

January 25, 2016  10:43am Pacific time

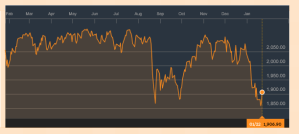
In case you’ve been enjoying an extended holiday season, you may not realize that January 2016 is on track to become the worst January for the U.S. stock market since 2009. How worried should you be? Based on my analysis, my opinion is that the stock market has over-reacted to both the turmoil in the Chinese stock market and the drop in oil prices. Investments in companies other than oil producers, particularly those that benefit from cheaper oil prices, may deliver good results in the coming year.

S&P 500 February 1st, 2015 – January 2nd, 2016

1


Source: http://www.bloomberg.com/quote/SPX:IND

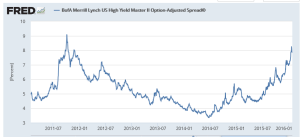
And the bond market hasn’t been immune. Yields on below-investment grade bonds in particular spiked to levels not seen since 2012.

2

https://research.stlouisfed.org/fred2/series/BAMLH0A0HYM2

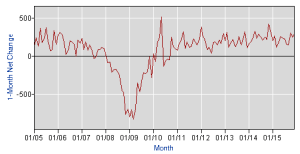
But why have the U.S. markets reacted so strongly to the Chinese market and oil prices? Has the U.S. economy encountered an unexpected pothole? Have an excessive amount of U.S. businesses or homeowners declared bankruptcy? Have scandals erupted in key corporations? Has the U.S. Congress threatened to shut down the government rather than pass a budget? No, none of these things has happened. Yes, industrial production and corporate profits have hit a bit of a slump. But the U.S. job market – probably the best indicator of imminent recession – continues to rebound with 292,000 new jobs in December and 2.7 million new jobs for the past year, according to the Bureau of Labor Statistics.

5

http://data.bls.gov/timeseries/CES0000000001?output_view=net_1mth

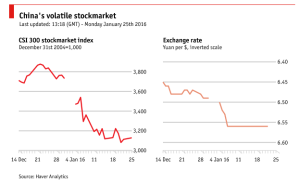
To recap the past few months in the Chinese stock market, as reported by The Economist (January 25, 2016), in early July 2015 China’s stock market crashed with share prices dropping by a third, wiping out some $3.5 trillion in wealth (more than the total value of India’s stock market).

6

A further plunge on August 24 followed by a fall of similar proportions the next day sent share prices down over 40% below their 2015 peak.

Since the summer, the Chinese stock market had rebounded approximately 20%, so one hoped that the worst was over. Unfortunately, on January 4th and again on January 7th the CSI 300 index of ‘blue chip’ Chinese stocks fell approximately 7% and fears of a serious economic decline were renewed.

Given that that Chinese stock market has indeed experienced a challenging 6 months, how can we extrapolate the severity of the problem to U.S. investors? Ultimately, the value of any stock market should reflect the profitability of domestic businesses.

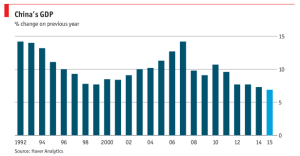
On January 19th, China reported its official annual GDP growth figure for 2015 at 6.9%, just a shade lower than 2014’s 7.3%, and much stronger than average global forecast GDP of 2.8%, reported by the Conference Board.org in November 2015.

3

The worry seems to be that the official GDP figure may be manipulated by the Chinese government and that much worse lies ahead.

But how much of the decline in the Chinese economy should legitimately be reflected in the U.S. economy? It is difficult to calculate a precise figure, but for context see the table below.

Country Exports Imports Total Trade Percent of Total
China 106.1 443.9 549.9 16.0%
Canada 259.0 271.6 530.6 15.4%
Mexico 217.8 271.6 489.4 14.2%
Japan 57.7 119.8 177.5 5.1%
Germany 45.9 113.4 159.3 4.6%
South Korea 40.1 66.4 106.5 3.1%
United Kingdom 52.0 53.7 105.7 3.1%
France 27.6 43.7 71.3 2.1%
India 20.0 41.7 61.7 1.8%
Taiwan 24.0 37.5 61.5 1.8%

https://www.census.gov/foreign-trade/statistics/highlights/top/top1511yr.html

As of November 2015, China was indeed the largest trade partner with the U.S., so changes in their economy could definitely impact ours. However, note that exports – which bring profits to U.S. businesses – are much smaller than imports. This should buffer the impact of the Chinese decline somewhat. So troubles in the Chinese economy can indeed impact the U.S., though by how much is very difficult to say.

But what about falling oil prices?

As an input to so much of what we consume, lower oil prices depress final goods prices – including gasoline – which leaves more money in consumers’ pocket to buy other things. Yes, a severe drop in oil prices driven by a lack of demand would definitely indicate a recession, but that’s not what’s happening these past months. The problem is an overabundance of supply.

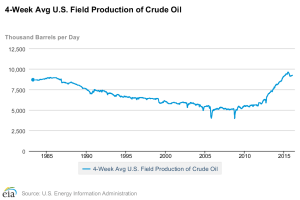
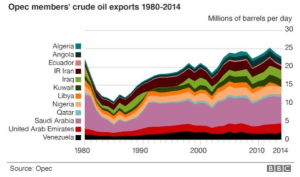
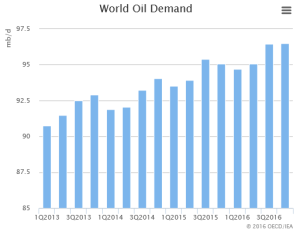
With the widespread use of hydraulic fracturing in the U.S., crude oil production in the U.S. has spiked to levels not seen in the last 30 years. With OPEC countries maintaining production near historic levels, and global demand growth increasing only modestly, basic laws of economics indicate that the market price of oil must fall.

7

https://www.eia.gov/dnav/pet/hist/LeafHandler.ashx?n=PET&s=WCRFPUS2&f=4

8

9


So where does that leave us? Yes, we should be concerned about the market turmoil in China as that country adjusts to a slower, but still strong, growth rate of their economy. Declining oil prices caused by excess supply is a good thing for consumers, but will depress profits of oil producers which can be a large component of stock market indexes.

On balance, the U.S. economy remains on an upward trajectory. Recent declines in the stock market should be viewed as a buying opportunity. But be selective! Companies whose revenues are strongly tied to the price of oil may continue to struggle until supply and demand reach a new equilibrium.

At Last, a Greek Debt Deal

A look at the winners, losers & terms. 

Provided by Warren Street Wealth Advisors


It looks like Greece will stay in the euro. After eurozone finance ministers pulled an all-nighter, negotiating for 17 hours into early Monday morning, the government of the beleaguered nation accepted the latest bailout terms offered by its creditors. The deal was unanimously approved by the eurozone’s 19 member countries.1


This third bailout agreement contains the harshest austerity measures yet. There was no debt haircut for Greece, and this latest round of relief comes at a remarkable price. In exchange for another $95 billion worth of aid over the next three years, Greece agreed to more than just sales tax hikes and cuts in pension payments – it also agreed to sell off state assets.1


To explain this a bit further, Greece will transfer about $50 billion worth of “valuable” assets into a “guarantee fund”. (This was Germany’s idea.) These assets – likely bank shares that the Greek government will buy up with bailout money in order to recapitalize its banks – will be used as collateral on the latest bailout package. The mission is to sell them in reasonable time, with half the cash going toward repayment of the bailout funds, a quarter toward investment, and another quarter applied to Greece’s national debt.2,3


This yet-to-be-named privatization fund will be based in Greece and run by Greek authorities, but Greece’s creditors will supervise its actions. Greece might have until the mid-2020s (or longer) to sell these assets, as the new bailout loans may have long maturities.3


In the words of French President Francois Hollande, Europe had “a good night, and a good day” – and no Grexit. Who won and lost most in this new deal? 1


The winner: Angela Merkel. Germany is the premier economy in the eurozone and Greece’s biggest creditor, and its chancellor decided enough was enough. Merkel took a very hard line in the negotiations; in fact, Germany, along with Finland, ardently supported throwing Greece out of the eurozone and letting the country take care of its financial problems without any further loans.1,4


Merkel looks very good even after Germany’s apparent conciliation to the pleas of France, Italy and other European Union members that argued for the necessity of a third Greek bailout. As she commented, “The advantages [of the deal] far outweigh the disadvantages.”2


The loser: Alexis Tsipras. Tsipras and his left-wing Syriza party have all but written themselves out of Greece’s future. After disparaging the austerity measures Greeks live with and praising the Greek people for the “very brave choice” they made in voting against another bailout, Tsipras signed off on austerity cuts that were even deeper.


In the end, he simply had to; for all his posturing, two financial shocks would have occurred if he had refused. Without a deal in place, Greece’s banking system could have collapsed this week. Greece also could have found itself out of the eurozone – a danger signal for institutional and retail investors.


Global markets started the week with a relief rally. Monday’s trading day found the Dow, Nasdaq and S&P 500 all rising 1.1% or higher; the STOXX Europe 600, FTSE 100 and Nikkei 225 were also up from 1.0-2.0%. The deal is not set in stone yet – eurozone parliaments must approve it – but the accord just reached relieves much uncertainty.5


Warren Street Wealth Advisors

190 S. Glassell St., Suite 209

Orange, CA 92866

714-876-6200 – office


This material was prepared by MarketingPro, Inc., and does not necessarily represent the views of the presenting party, nor their affiliates. This information has been derived from sources believed to be accurate. Please note – investing involves risk, and past performance is no guarantee of future results. The publisher is not engaged in rendering legal, accounting or other professional services. If assistance is needed, the reader is advised to engage the services of a competent professional. This information should not be construed as investment, tax or legal advice and may not be relied on for the purpose of avoiding any Federal tax penalty. This is neither a solicitation nor recommendation to purchase or sell any investment or insurance product or service, and should not be relied upon as such. All indices are unmanaged and are not illustrative of any particular investment.


Citations.

1 – usatoday.com/story/money/2015/07/13/greek-bailout-talks/30068857/ [7/13/15]

2 – time.com/3955221/greece-bailout-marathon/ [7/13/15]

3 – blogs.wsj.com/briefly/2015/07/13/how-will-the-greek-privatization-work-the-short-answer/ [7/13/15]

4 – reuters.com/article/2015/07/06/us-eurozone-greece-idUSKBN0P40EO20150706 [7/6/15]


5 – markets.wsj.com/us [7/13/15]


Quarterly Review 2Q 2015

A review of 2Q 2015

THE QUARTER IN BRIEF
A 2.10% June retreat left the S&P 500 down 0.23% for Q2 2015, putting an end to its 9-quarter winning streak. The quarter’s biggest economic events occurred in late June – Greece defaulted on its debt, the commonwealth of Puerto Rico said a default was imminent, and China’s stock market plunged. The Federal Reserve seemed committed to raising interest rates before the end of the year, even as it lowered its 2015 economic forecast. Spring brought more home buying, higher oil prices, improved hiring, and a number of encouraging signs that the economy was pulling out of a winter slump. Even with all those positives, the headwinds in the stock market were too strong to allow a broad advance.1,2


DOMESTIC ECONOMIC HEALTH
The second quarter saw the Federal Reserve revise its projections for 2015 GDP downward; the spring forecast of 2.3-2.7% growth was reduced to 1.8-2% growth. Its June 17 policy statement also signaled at least one interest rate hike later this year – but perhaps only one, as more Fed officials now believed the central bank should raise rates only once in 2015 with two calling for no move until 2016. It has long been thought that the Fed might raise rates starting in September, but futures markets disagreed as the quarter ended, envisioning the first move coming in December.3


With revisions included, Labor Department reports showed the economy adding 187,000 jobs in April, 254,000 jobs in May, and 223,000 jobs in June. The unemployment rate fell to 5.3% in June, a low unseen since April 2008; the U-6 rate measuring the unemployed and underemployed declined to 10.5% in June, down half a percent from a year earlier. Wages were up 2% in a year as of June.4


Two other key indicators showed continued growth for America’s factory and services sectors. While the Institute for Supply Management’s manufacturing PMI slipped to a 2-year low of 51.5 in April, it rose to readings of 52.8 and 53.5 in May and June. The ISM service sector PMI (which has averaged a robust 57.2 in the last 12 months) showed readings of 57.8 for April, 55.7 for May and 56.0 for June.5,6


Consumer confidence readings were higher by the quarter’s end. The University of Michigan’s consumer sentiment index posted final April, May, and June marks of 95.9, 90.7, and 96.1; that June reading was the best since January. The Conference Board’s respected survey jumped to 101.4 in June after coming in at 94.3 in April and 94.6 in May.7,8


Consumer inflation remained but a minor threat, even as the Consumer Price Index put up its largest monthly gain since February 2013 in May. (The 0.4% May rise was largely due to a 10.4% increase in retail gas prices.) Year-over-year, the headline CPI was flat while the core CPI was up just 1.7%.9


Personal spending was up just 0.1% in April, then soared 0.9% for May. Retail sales experienced the same “spring thaw,” advancing 0.2% in April and 1.2% in May.10,11


Headline durable goods orders sank 1.5% in April, then 1.8% in May; without volatile transportation orders, there was an 0.3% April loss and an 0.5% May gain. Producer prices jumped 0.5% in May after a 0.4% dip for April.10,12


As Q2 went on, the Bureau of Economic Analysis improved what was a dismal Q1 GDP reading. In the second BEA Q1 GDP estimate, the economy contracted 0.7%; in its third and final estimate, the contraction was 0.2%.10


Finally, Puerto Rico Governor Alejandro García Padilla told the world on June 28 that the commonwealth could not pay its $72 billion in public debt, shocking many investors but not many economists. Padilla’s administration is exploring a Chapter 9 bankruptcy as an option, but under current federal law that option is only available to U.S. cities, not territories.13


GLOBAL ECONOMIC HEALTH
As early as April, there were indications that Greece might default on its debt. Then it missed a June 30 deadline on a €1.5 billion debt repayment, triggering a global stock selloff as investors glimpsed a crack in the framework of the European Union. The quarter ended with Prime Minister Alexis Tsipras and the ruling Syriza party announcing a July 5 national vote on whether Greece should accept further austerity measures as a condition of additional financial aid; 61% of the electorate voted no, opening the door to Greece’s exit from the EU and leaving EU leaders with a hard choice for July – either play hardball with Greece and risk a humanitarian crisis, or play softball with Greece and placate its people in a last-ditch effort to keep it in the eurozone. On July 6, the Guardian reported that the Greek banking system held only about €500 million, or about €45 per person. This was the last development the eurozone needed as it tried to mount an economic recovery from its recent recession.14,15


The Greek debt crisis did not wholly distract investors from troubles in China – namely, the panic in its stock market. The Shanghai Composite fell 24% between June 12 and July 4 (prior to that, it was up 149% YTD). More than $2.4 trillion in wealth evaporated in this sudden bear market. China’s major brokerages actually formed a $19.4 billion rescue fund to buy up shares in major companies listed in the index, while the Chinese government encouraged its citizens to purchase stock. China’s annualized growth slowed to 7.0% in Q1, its poorest GDP reading since 2009; on June 29, the People’s Bank of China made its fourth interest rate cut in eight months.16,17


WORLD MARKETS
While many European indices suffered heavy Q2 losses, the picture was a bit brighter in other parts of the world. The damage in Europe was certainly severe: the CAC 40 sank 4.84%, the FTSE MIB 3.01%, the DAX 8.53%, the IBEX 35 6.52%, and the FTSE 100 3.72%. Russia’s RTS index and Ireland’s ISEQ were notable exceptions, posting respective quarterly gains of 6.76% and 2.42%.2


In the Asia Pacific region, the Shanghai Composite went +14.12% for the quarter even after all that slipping and sliding. Pakistan’s KSE 100 rivaled that performance, going +13.78%. Other quarterly gains and losses from the east: Sensex, -0.63%; Nikkei 225, +5.36%; Kospi, +1.63%; S&P/ASX 200, -7.34%; Hang Seng, +5.42%; Jakarta Composite, -11.02%. Looking at the Americas, we see gains of 7.56% for Argentina’s Merval, 3.04% for Mexico’s IPC All-Share, and 3.77% for Brazil’s Bovespa; Q2 brought a loss of 2.34% for Canada’s TSX Composite.2


The major multi-country benchmarks all went red in the quarter, registering the following losses: Global Dow, 0.19%; Asia Dow, 0.54%; Europe Dow, 1.95%; Dow Jones Americas, 0.38%; STOXX 600, 4.02%; MSCI World Index, 0.30%; MSCI Emerging Markets Index, 0.24%.2,18


COMMODITIES MARKETS
The second quarter of 2015 was noticeably better than the first in the commodities sector: the Thomson Reuters/Jefferies CRB Index rose 7.23% as the U.S. Dollar Index fell 2.92%.19,20


Oil staged a major rally in the quarter, rising 24.9% on the NYMEX as it rebounded from a 6-year low. WTI crude settled at on $59.04 on June 30. Cocoa futures also had a fine quarter, gaining 21.3%. Sugar futures rose 2.9%, lumber futures 3.6%.21,22


Metals, on the other hand, did not gain ground in Q2. Gold wrapped up June at a COMEX price of $1,171.80, down 1.0% for the quarter and 1.0% YTD. After stumbling 6.7% for June, silver settled at $15.58 on the COMEX June 30 yet was just -0.1% YTD. Platinum fell 5.6% in Q2 and palladium sank 8.5%; the end of Q2 found platinum at -10.8% YTD, palladium -15.8% YTD. A dip in demand from China influenced copper’s 4.5% Q2 loss.21,23


REAL ESTATE
What had been a lukewarm housing market transformed into a hot one. The National Association of Realtors provide ready evidence of that: after slipping 3.3% in April, existing home sales improved 5.1% in May to a seasonally adjusted annual rate of 5.35 million, the best pace in almost six years and up 9.2% year-over-year.  New home sales rose 8.1% in April and another 2.2% in June according to the Census Bureau; that put their annualized sales rate at 546,000 (the best in seven years) and their year-over-year increase at 19.5%.24,25


This happened even with mortgage rates on the way up. In the March 26 Freddie Mac Primary Mortgage Market Survey, interest rates on assorted mortgages were as follows: 30-year FRM, 3.69%; 15-year FRM, 2.97%; 5/1-year ARM, 2.92%; 1-year ARM, 2.46%. By June 25, those percentages had changed markedly: 30-year FRM, 4.02%; 15-year FRM, 3.21%; 5/1-year ARM, 2.98%; 1-year ARM, 2.50%.26


Now to the other key real estate indicators during the quarter. Housing starts climbed 22.1% in April, then faltered 11.1% during May; they were still up 5.1% annually after the May drop. With an 11.8% May boost, building permits hit their highest level in almost eight years and registered a 25.4% 12-month gain by Census Bureau calculations. The overall April S&P/Case-Shiller home price index displayed a yearly gain of 4.2% in housing values, ticking down from 4.3% in March. The NAR’s pending home sales index rose but 0.9% in May after an April advance of 2.7%.27,28


LOOKING BACK…LOOKING FORWARD
As the quarter ended, the four most important U.S. indices settled as follows: DJIA, 17,619.51; Nasdaq, 4,986.87; S&P, 2,063.11; RUT, 1,253.95. June was the worst month for both the Dow and the S&P since January, and that is reflected in the Q2 performance noted below. Like the Nasdaq, the Russell 2000 advanced for Q2, albeit just 0.09%. The quarter’s best-performing stateside index was the CBOE VIX: ending June at 18.23, it advanced 19.23% in three months. The Nasdaq Bank Index finished second with a gain of 7.57%, the Nasdaq Biotechnology Index third with a rise of 7.44%.2


% CHANGE Y-T-D Q2 CHG 1-YR CHG 10-YR AVG
DJIA -1.14 -0.88 +4.71 +7.15
NASDAQ +5.30 +1.75 +13.13 +14.24
S&P 500 +0.20 -0.23 +5.25 +7.32
REAL YIELD 6/30 RATE 1 YR AGO 5 YRS AGO 10 YRS AGO
10 YR TIPS 0.48% 0.27% 1.15% 1.67%

Sources: wsj.com, bigcharts.com, treasury.gov – 6/30/152,29,30

Indices are unmanaged, do not incur fees or expenses, and cannot be invested into directly.

These returns do not include dividends.


In July, we have some relative calm on Wall Street; at this writing, the selloff of June 29 has fortunately not been replicated. It looks as though Greece’s creditors may just have to take a haircut – since Greece cannot hope to function without access to credit, negotiations to either restructure its debt repayments or lessen the principal seem a given. So far, U.S. stocks have come through this crisis with far less damage than European shares – and hopefully that continues with eurozone finance ministers seeking an expedient solution and a new earnings season providing a diversion. Perhaps the third quarter will bring relative calm and renewed confidence for consumers and investors.31

Warren Street Wealth Advisors
190 S. Glassell St., Suite 209
Orange, CA 92866
714-876-6200 – office
714-876-6202 – fax
Investment Advisor Representative, Warren Street Wealth Advisor, LLC., a Registered Investment Advisor.


This material was prepared by MarketingPro, Inc., and does not necessarily represent the views of the presenting party, nor their affiliates. This information has been derived from sources believed to be accurate. MarketingPro, Inc. is not affiliated with any broker or brokerage firm that may be providing this information to you. This information should not be construed as investment, tax or legal advice and may not be relied on for the purpose of avoiding any Federal tax penalty. This is not a solicitation or recommendation to purchase or sell any investment or insurance product or service, and should not be relied upon as such. The Dow Jones Industrial Average is a price-weighted index of 30 actively traded blue-chip stocks. The NASDAQ Composite Index is an unmanaged, market-weighted index of all over-the-counter common stocks traded on the National Association of Securities Dealers Automated Quotation System. The Standard & Poor’s 500 (S&P 500) is an unmanaged group of securities considered to be representative of the stock market in general. It is not possible to invest directly in an index. NYSE Group, Inc. (NYSE:NYX) operates two securities exchanges: the New York Stock Exchange (the “NYSE”) and NYSE Arca (formerly known as the Archipelago Exchange, or ArcaEx®, and the Pacific Exchange). NYSE Group is a leading provider of securities listing, trading and market data products and services. The New York Mercantile Exchange, Inc. (NYMEX) is the world’s largest physical commodity futures exchange and the preeminent trading forum for energy and precious metals, with trading conducted through two divisions – the NYMEX Division, home to the energy, platinum, and palladium markets, and the COMEX Division, on which all other metals trade. The CAC-40 Index is a narrow-based, modified capitalization-weighted index of 40 companies listed on the Paris Bourse. The FTSE MIB (Milano Italia Borsa) is the benchmark stock market index for the Borsa Italiana, the Italian national stock exchange. The DAX 30 is a Blue Chip stock market index consisting of the 30 major German companies trading on the Frankfurt Stock Exchange. The IBEX 35 is the benchmark stock market index of the Bolsa de Madrid, Spain’s principal stock exchange. The FTSE 100 Index is a share index of the 100 most highly capitalized companies listed on the London Stock Exchange. The RTS Index (abbreviated: RTSI, Russian: Индекс РТС) is a free-float capitalization-weighted index of 50 Russian stocks traded on the Moscow Exchange. The ISEQ Overall Index is a capitalization-weighted index of all official list equities in the Irish Stock Exchange, excluding U.K.-registered companies. The SSE Composite Index is an index of all stocks (A and B shares) that are traded at the Shanghai Stock Exchange. Karachi Stock Exchange 100 Index (KSE-100 Index) is a stock index acting as a benchmark to compare prices on the Karachi Stock Exchange (KSE) over a period. BSE Sensex or Bombay Stock Exchange Sensitivity Index is a value-weighted index composed of 30 stocks that started January 1, 1986. Nikkei 225 (Ticker: ^N225) is a stock market index for the Tokyo Stock Exchange (TSE). The Nikkei average is the most watched index of Asian stocks. The Korea Composite Stock Price Index or KOSPI is the major stock market index of South Korea, representing all common stocks traded on the Korea Exchange. The S&P/ASX 200 is Australia’s “premier” share market index. The Hang Seng Index is a freefloat-adjusted market capitalization-weighted stock market index that is the main indicator of the overall market performance in Hong Kong. The IDX Composite or Jakarta Composite Index is an index of all stocks that are traded on the Indonesia Stock Exchange (IDX). The MERVAL Index (MERcado de VALores, literally Stock Exchange) is the most important index of the Buenos Aires Stock Exchange. The Mexican IPC index (Indice de Precios y Cotizaciones) is a capitalization-weighted index of the leading stocks traded on the Mexican Stock Exchange.  The Bovespa Index is a gross total return index weighted by traded volume & is comprised of the most liquid stocks traded on the Sao Paulo Stock Exchange. The S&P/TSX Composite Index is an index of the stock (equity) prices of the largest companies on the Toronto Stock Exchange (TSX) as measured by market capitalization. The Global Dow (GDOW) is a 150-stock index of corporations from around the world, created by Dow Jones & Company.  The Asia Dow measures the Asia equity markets by tracking 30 leading blue-chip companies in the region. The Europe Dow measures the European equity markets by tracking 30 leading blue-chip companies in the region. The Dow Jones Americas Index measures the Latin American equity markets by tracking 30 leading blue-chip companies in the region. The Dow Jones STOXX 600 Index captures more than 90% of the aggregate market cap of European-based companies. The MSCI World Index is a free-float weighted equity index that includes developed world markets, and does not include emerging markets. The MSCI Emerging Markets Index is a float-adjusted market capitalization index consisting of indices in more than 25 emerging economies. The US Dollar Index measures the performance of the U.S. dollar against a basket of six currencies. Additional risks are associated with international investing, such as currency fluctuations, political and economic instability and differences in accounting standards. This material represents an assessment of the market environment at a specific point in time and is not intended to be a forecast of future events, or a guarantee of future results. Past performance is no guarantee of future results.  Investments will fluctuate and when redeemed may be worth more or less than when originally invested. All information is believed to be from reliable sources; however we make no representation as to its completeness or accuracy. All economic and performance data is historical and not indicative of future results. Market indices discussed are unmanaged. Investors cannot invest in unmanaged indices. The publisher is not engaged in rendering legal, accounting or other professional services. If assistance is needed, the reader is advised to engage the services of a competent professional.


Citations.

1 – marketwatch.com/story/us-stocks-end-higher-sp-500-breaks-9-quarter-win-streak-2015-06-30 [6/30/15]

2 – online.wsj.com/mdc/public/page/2_3022-quarterly_gblstkidx.html [6/30/15]

3 – washingtonpost.com/blogs/wonkblog/wp/2015/06/17/federal-reserve-rate-hike-likely-before-year-end/ [6/17/15]

4 – forbes.com/sites/samanthasharf/2015/07/02/jobs-report-u-s-added-223000-jobs-in-june-as-unemployment-rate-moved-down-to-5-3/ [7/2/15]

5 – tinyurl.com/q587x8b [5/1/15]

6 – instituteforsupplymanagement.org/ISMReport/NonMfgROB.cfm [7/6/15]

7 – briefing.com/Investor/Calendars/Economic/Releases/mich.htm [7/2/15]

8 – briefing.com/Investor/Calendars/Economic/Releases/conf.htm [7/2/15]

9 – nytimes.com/2015/06/19/business/economy/us-consumer-prices-post-largest-gain-in-more-than-2-years.html [6/19/15]

10 – briefing.com/investor/calendars/economic/2015/06/22-26 [6/26/15]

11 – briefing.com/Investor/Calendars/Economic/Releases/retail.htm [6/11/15]

12 – fxstreet.com/news/forex-news/article.aspx?storyid=76e5529c-495c-41db-89b8-0b5f68acfe40 [7/6/15]

13 – fortune.com/2015/06/29/puerto-rico-economy-crisis/ [6/29/15]

14 – tinyurl.com/os2pwyh [7/5/15]

15 – theguardian.com/business/2015/jul/06/greek-referendum-what-happens-now-after-the-no-vote [7/6/15]

16 – theatlantic.com/international/archive/2015/07/chinas-nervewracking-stock-market-collapse/397724/ [7/4/15]

17 – fxstreet.com/analysis/flash-comment/2015/06/29/ [6/29/15]

18 – msci.com/end-of-day-data-search [6/30/15]

19 – investing.com/indices/thomson-reuters—jefferies-crb-historical-data [7/5/15]

20 – online.wsj.com/mdc/public/npage/2_3050.html?mod=mdc_curr_dtabnk&symb=DXY [7/5/15]

21 – tinyurl.com/nf463kq [7/1/15]

22 – money.cnn.com/data/commodities/ [6/30/15]

23 – coinnews.net/2015/06/30/gold-silver-dive-in-quarter-us-coin-sales-surge-in-june/ [6/30/15]

24 – housingwire.com/articles/34260-first-time-buyers-boost-existing-home-sales-51-in-may [6/22/15]

25 – nasdaq.com/article/us-new-home-sales-climb-to-sevenyear-high-in-may-20150623-00645 [6/23/15]

26 – freddiemac.com/pmms/archive.html [7/6/15]

27 – tradingeconomics.com/united-states/housing-starts [6/16/15]

28 – marketwatch.com/economy-politics/calendars/economic [6/30/15]

29 – bigcharts.marketwatch.com/historical/default.asp?symb=DJIA&closeDate=6%2F30%2F14&x=0&y=0 [6/30/15]

29 – bigcharts.marketwatch.com/historical/default.asp?symb=COMP&closeDate=6%2F30%2F14&x=0&y=0 [6/30/15]

29 – bigcharts.marketwatch.com/historical/default.asp?symb=SPX&closeDate=6%2F30%2F14&x=0&y=0 [6/30/15]

29 – bigcharts.marketwatch.com/historical/default.asp?symb=DJIA&closeDate=6%2F30%2F05&x=0&y=0 [6/30/15]

29 – bigcharts.marketwatch.com/historical/default.asp?symb=COMP&closeDate=6%2F30%2F05&x=0&y=0 [6/30/15]

29 – bigcharts.marketwatch.com/historical/default.asp?symb=SPX&closeDate=6%2F30%2F05&x=0&y=0 [6/30/15]

30 – treasury.gov/resource-center/data-chart-center/interest-rates/Pages/TextView.aspx?data=realyieldAll [7/6/15]

31 – tinyurl.com/qhe9pqc [7/6/15]