Decoding the AI Hype: How Today’s Market Compares to the Dot-Com Bubble
You’ve likely seen headlines comparing today’s AI-driven market to the late-1990s dot-com era. We take those comparisons seriously. This note outlines what’s different today, what still deserves caution, and, most importantly, how we’re positioning your strategy to hold up across a range of outcomes.1
Where Valuations Stand
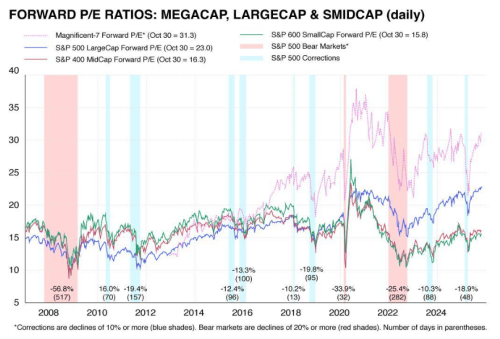
Stock prices have climbed, and by simple measures of “price versus earnings,” the market looks more expensive than its long-term average. That’s a reason for discipline. However, it’s also true that the broad market remains below the most extreme levels reached in the late 1990s. You can see this in the valuation charts that track the relationship between prices and earnings over time.2
What’s Different From Dot‑Com Era
Back then, Barron’s magazine cover story in March 2000, called “Burning Up,” reported that 74% of 207 publicly traded internet companies had “negative cash flows” and at least 51 of those companies were projected to run out of money in the next 12 months. In contrast, today the largest parts of the market are producing real earnings, and overall profit margins across the major U.S. index remain above their five-year average. That doesn’t remove risk, but it does mean prices are supported by business results that we didn’t see from some companies in the dot-com cycle. FactSet’s latest quarterly review provides a good snapshot.3
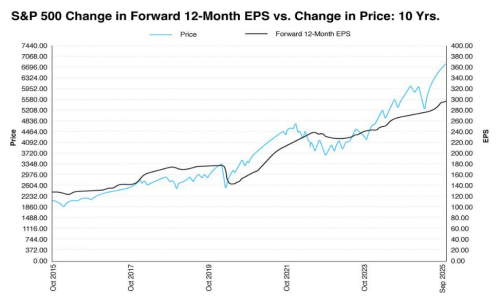
AI Isn’t Just a Story—There’s Heavy Investment Behind It
A big reason certain companies have led is the build-out of the “plumbing” for AI: data centers, chips, software, and power. You can see this in government data, which shows manufacturing construction near record highs, much of it related to chip facilities, and in rising business spending on information-processing equipment and software. Those are dollars going into real plants, servers, and tools that support future productivity.4,5
Real Fundamentals – But Are AI Profits a Distant Dream?
Today’s AI landscape, where players boast robust business models and real fundamentals stemming from their core businesses, still is not without questions. While fortress balance sheets, resilient revenue, and strong earnings growth remain in place, the central point becomes: does the uncertain return on investment for AI justify the existing valuation levels, even if they aren’t as extreme as the Dotcom era?
We have to remember that many of today’s leading AI companies still look expensive based on profits they made last year. Meanwhile, the forward looking bull-argument rests entirely on whether their earnings will grow to meet the evergrowing mountain of expectations.
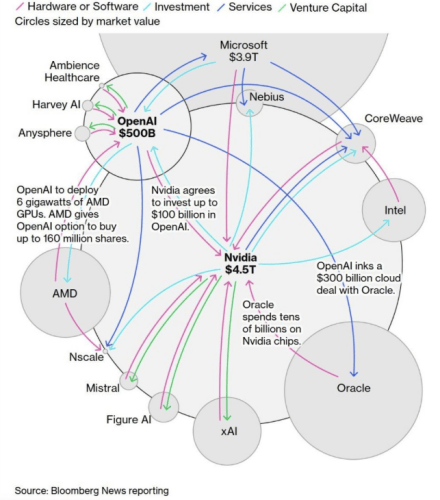
Intertwining Illusions of Growth
Beyond the frothy valuations, the AI hyperscaler ecosystem can feel like an Ouroboros (i.e., a snake that eats its own head). Okay, maybe that’s a bit extreme. However, it doesn’t take away from the increasingly circular dance of chipmakers, cloud providers, and foundational AI companies increasingly investing in one another.
Take for example, Microsoft’s $13billion investment in OpenAi in exchange for OpenAI agreeing to purchase $250 billion in Azure cloud services over the next decade. Microsoft is relying on OpenAI to find real, external customers to honor commitments in due time.
However, readers should ask – even if OpenAI succeeds in building an Artificial Generative Intelligence (AGI), will there be enough downstream demand for its products and services (especially if AI is displacing jobs)? Or will the primary customer base for AGI simply be the same tech giants who funded its creation? With more interdependence, one setback amongst one of these players could ripple across the entire industry.
Put simply, today’s “booming” AI revenue isn’t necessarily from new, organic customers with demand for AI services – it’s an internal recycling of investment capital that creates an illusion of growth where economic profit from external customers remains largely hypothetical. While long-term prospects for AI remain strong and we aren’t predicting a bubble, does being invested in an “expensive,” concentrated space predicated on nascent technologies warrant a closer look? We think it does.
How We’re Managing Your Strategy
That brings us to AI and concentration levels in US Markets. While we’re not sounding alarm bells or declaring an “AI Bubble,” we do recognize concentrated exposure in US Markets (and especially to AI) presents vulnerabilities. That’s why we continue to build adequately diversified portfolios that not only invest around the globe, but also across asset classes such as bonds, gold, and commodities. Recently, we’ve performed a partial rebalance of our market-cap weighted S&P 500 holdings (heavily concentrated to AI) towards US companies with stronger balance sheets and profitability (i.e., “quality” characteristics). Ultimately, we believe we’re in a state where diversifying our client’s sources of “risk” will be prudent for meeting their long-term goals.
If you’d like to meet and discuss how your portfolio is positioned for both stronger and more challenging environments, please give us a call to schedule a meeting.9,10
Bottom line, your portfolio is being actively managed with vigilance and care, and we’re always here if you’d like to discuss further.

Phillip Law, CFA
Senior Portfolio Manager, Warren Street Wealth Advisors
Investment Advisor Representative, Warren Street Wealth Advisors, LLC., a Registered Investment Advisor
The information presented here represents opinions and is not meant as personal or actionable advice to any individual, corporation, or other entity. Any investments discussed carry unique risks and should be carefully considered and reviewed by you and your financial professional. Nothing in this document is a solicitation to buy or sell any securities, or an attempt to furnish personal investment advice. Warren Street Wealth Advisors may own securities referenced in this document. Due to the static nature of content, securities held may change over time and current trades may be contrary to outdated publications. Form ADV available upon request 714-876-6200.
Sources:
1. Insights.com, October 08, 2025. “This Is How the AI Bubble Bursts” https://insights.som.yale.edu/insights/this-is-how-the-ai-bubble-bursts Yale Insights
2. Yardeni.com, 2025. “Stock Market P/E Ratios“ https://yardeni.com/charts/stock-market-p-e-ratios/ Yardeni Research
The S&P 500 Composite Index is an unmanaged index that is considered representative of the overall U.S. stock market. Index performance is not indicative of the past performance of a particular investment. Past performance does not guarantee future results. Individuals cannot invest directly in an index. The return and principal value of stock prices will fluctuate as market conditions change. And shares, when sold, may be worth more or less than their original cost.
The term “Magnificent 7” refers to a group of seven influential companies in the S&P 500, including Apple, Microsoft, Alphabet (Google), Amazon, Nvidia, Tesla, and Meta Platforms.
The S&P MidCap 400 is a benchmark for mid-sized companies. The index is designed to measure the performance of 400 mid-sized companies,
The S&P SmallCap 600 is a benchmark for small-cap companies. The index is designed to track companies that meet inclusion criteria, which include liquidity and financial viability.
3. FactSet.com, October 31, 2025. “Earnings Insight” https://www.factset.com/earningsinsight factset.com
4. Fred.StLouisFed.org, September 25, 2025. “Total Construction Spending: Manufacturing (TLMFGCONS) (manufacturing construction near record highs)” https://fred.stlouisfed.org/series/TLMFGCONS FRED
5. Fred.StLouisFed.org, September 25, 2025. “Private fixed investment in information processing equipment and software” https://fred.stlouisfed.org/series/A679RC1Q027SBEA FRED
6. FederalReserve.gov, October 29, 2025. “Statement” https://www.federalreserve.gov/newsevents/pressreleases/monetary20251029a.htm Federal Reserve
7. Reuters.com, October 29, 2025. “Fed to end balance-sheet reduction on Dec 1, 2025; cuts rates by 0.25%” https://www.reuters.com/business/finance/fed-end-balance-sheet-reduction-december-1-2025-10-29/ Reuters
8. Bloomberg.com, September 30, 2025. “What a US Government Shutdown Means for Markets” https://www.bloomberg.com/news/newsletters/2025-09-30/what-a-us-government-shutdown-means-for-markets Bloomberg
9. Corporate.Vanguard.com, 2025. “Vanguard’s Principles for Investing Success” https://corporate.vanguard.com/content/dam/corp/research/pdf/vanguards_principles_for_investing_success.pdf Vanguard
10. Morningstar.com, April 1, 2025. “Q1’s Biggest Lesson for Investors: Diversification Works” https://www.morningstar.com/markets/q1s-biggest-lesson-investors-diversification-works