WSWA Monthly Market Commentary for February 2019
Key Takeaways
-
- Commodities took the lead in February with a year-to-date return of 13.14% as oil prices recovered from the supply/demand imbalance during the second half of 2018
- The S&P 500 index is on pace for its biggest early-year advance in nearly 30 years, due in part to diminished investor fears about the impact of trade tensions and slowing pace of interest rate hikes
- Forward-looking economic data is mixed: S&P 500 companies expect earnings growth to slow, but the Conference Board’s Leading Economic Indicators remain strong
- Overseas tensions continue as the U.K. has yet to approve a ‘Brexit’ plan, trade tariffs put pressure on global economic growth, and high levels of public and private debt reduces central bank flexibility
- Conclusion: Global economies are slowing but unlikely to enter a recession in 2019, providing support for U.S. financial markets. Market performance around the world is likely to be positive though with mixed results across developed and emerging economies.
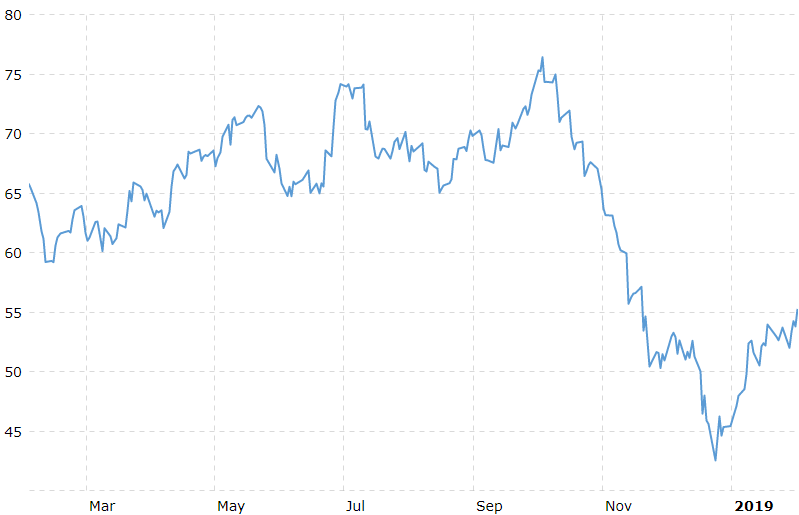
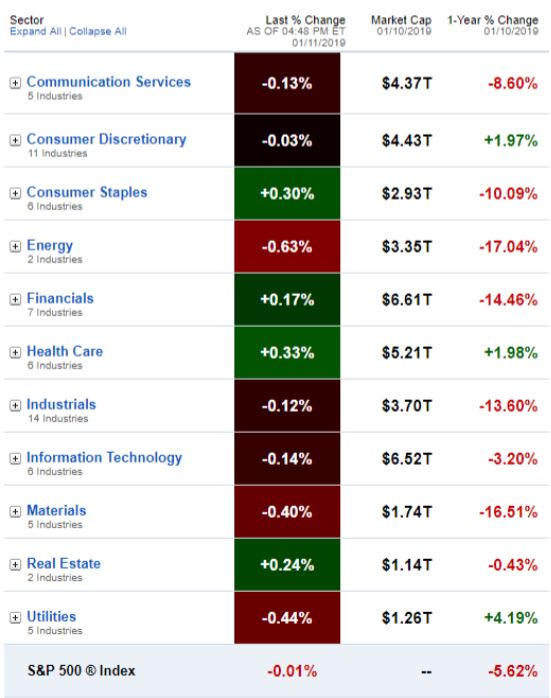
Energy takes the lead with an impressive year-to-date return over 23%.
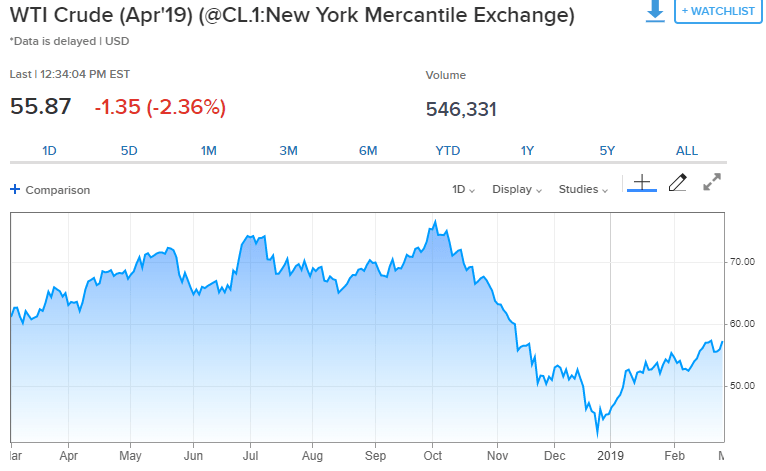
2019 started with a roar as commodities streaked off the starting line, gaining 13.14% in January and February (combined). The biggest winner was the Energy sector leaving everything else in the dust with an impressive 23.48% return. The rebound in oil prices was fueled in part by ongoing supply reductions by OPEC and diminishing trade tensions between the U.S. and China. Going forward, U.S. shale oil production capacity should keep a lid on oil prices despite efforts by OPEC countries to keep prices higher.
Source: www.cnbc.com
1. https://us.spindices.com/performance-overview/commodities/sp-gsci
2. Source: Morningstar Energy sector analyst report
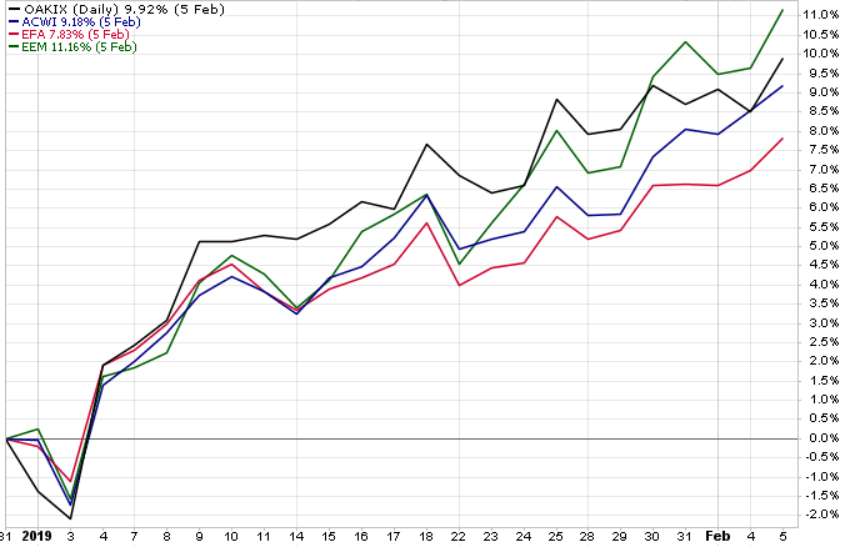
Global stocks were not left in the dust.
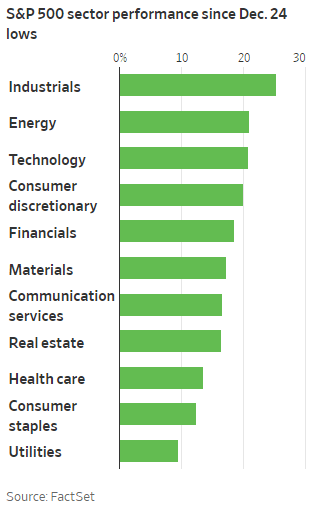
Despite the recent downturn, the S&P 500 is on pace for its strongest start in recent memory. This impressive performance was felt broadly across market sectors, led by Industrial companies and followed closely by Energy, Technology, and Consumer Discretionary firms.
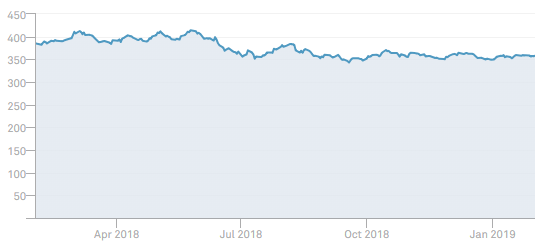
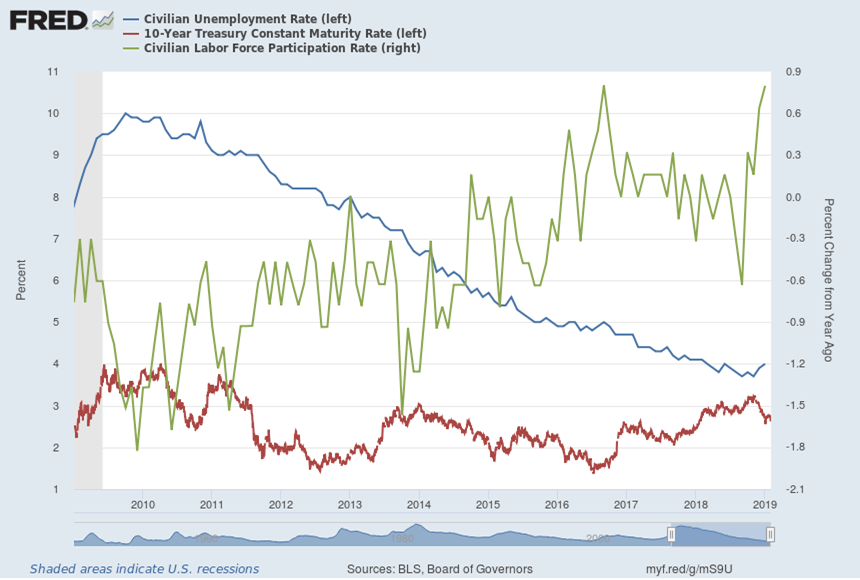
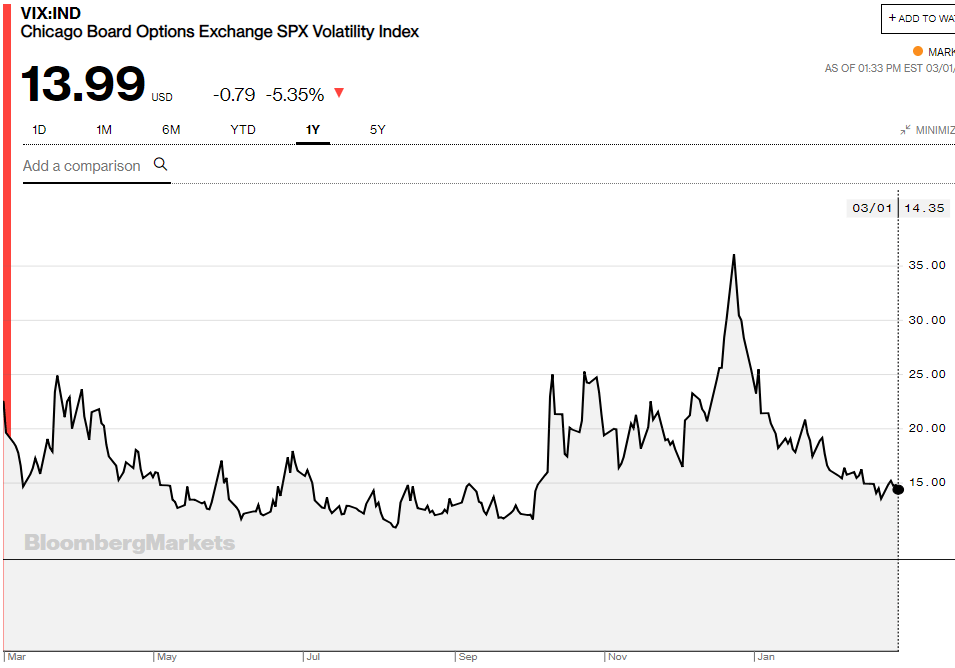
Thankfully, U.S. stock market volatility as measured by the Chicago Board Options Exchange Volatility Index (VIX) calmed down from the frantic pace of the 4th quarter, perhaps due to investor fatigue as much as anything else. In truth, news has indeed gotten better: the FOMC indicated it would remain patient with the pace of normalizing interest rates; trade negotiations with China are progressing toward a workable conclusion; and corporate earnings for the 4th quarter are coming in better than investors feared.
Source: www.bloomberg.com
3. https://www.wsj.com/articles/history-shows-stock-rally-could-have-more-legs-11550840401
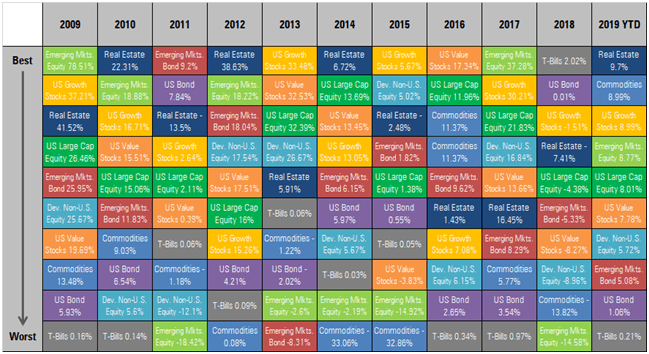
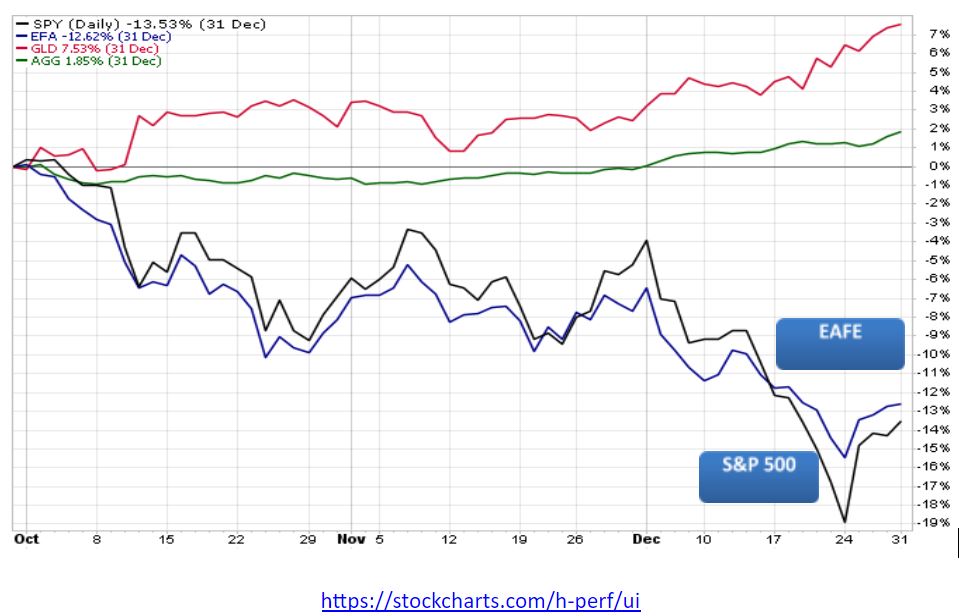
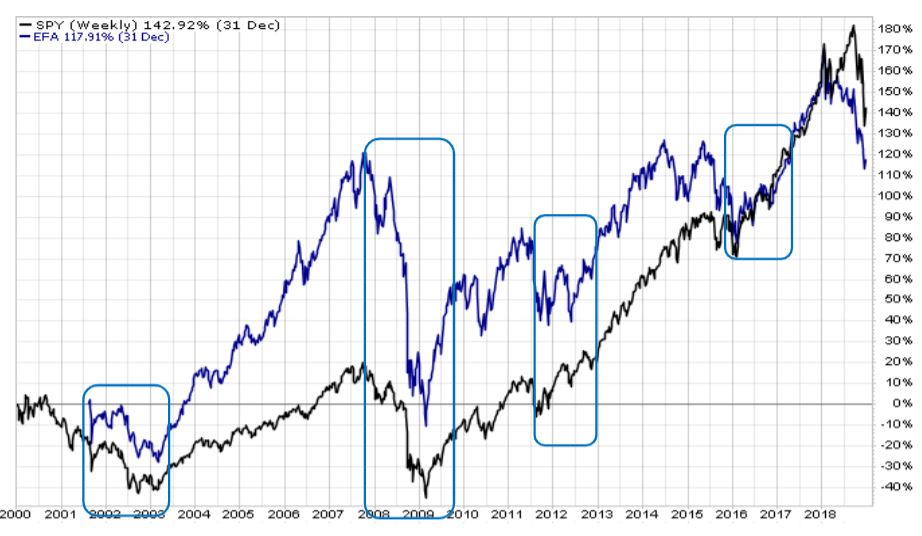
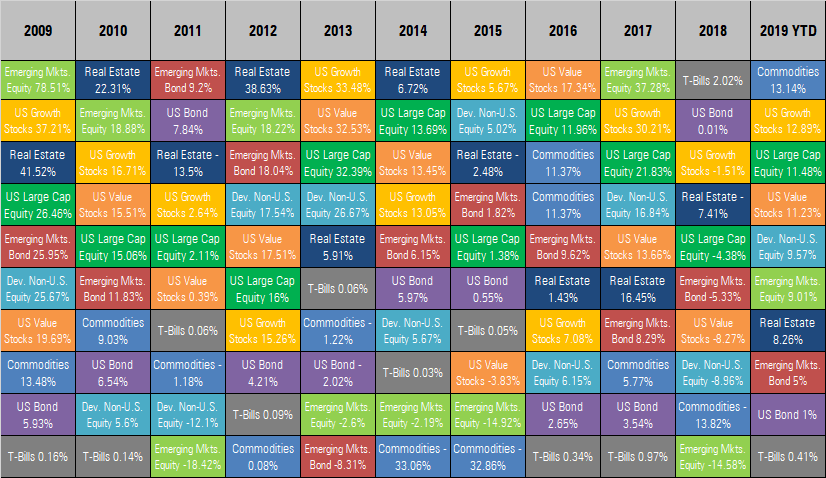
International stocks are also benefiting from economic and political tailwinds, pulling slightly ahead of the U.S. in February with a return of 3.58% versus 3.21% for the S&P 500. The U.S. remains in the lead year-to-date: +11.48% compared to +9.57% for the developed markets equity index (MSCI ACWI.) Emerging Markets stocks are solidly in the middle of the pack at 0.22% in February and 9.01% year-to-date. U.S. bonds lagged the field with a negative return of -0.06% in February and 1.0% year-to-date, despite over $25 billion of inflows from mutual fund investors fleeing the stock market volatility of the 4th quarter 2018.
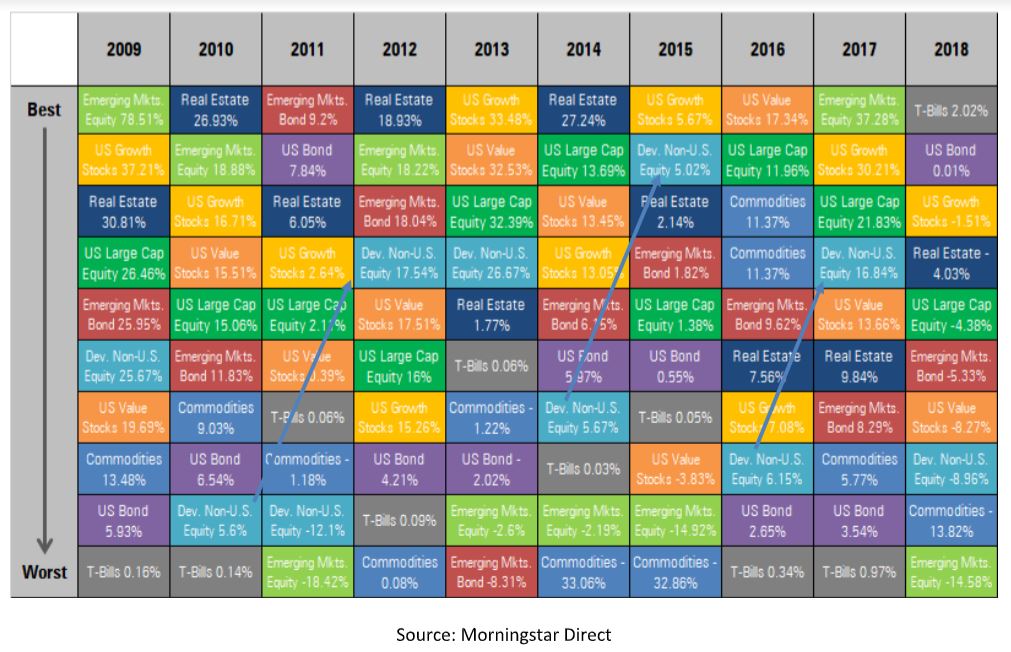
Asset Class Winners and Losers as of February 2019
Source: Morningstar Direct
4. Source: Morningstar Direct
5. https://ici.org/research/stats/flows
With such a great start to the year, you might be wondering “where do we go from here?”
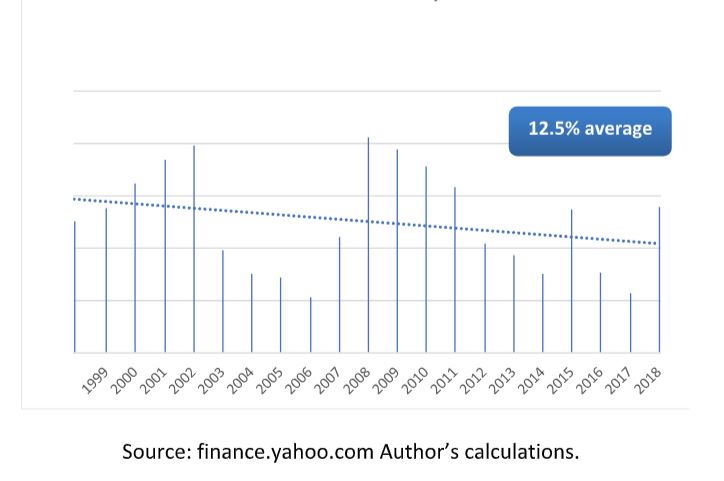
As reported in the Wall Street Journal and calculated by Dow Jones Market Data, the U.S. stock market continues in the same direction it started 64% of the time. Whether this relationship will apply in 2019 depends to some degree on the cause of the strong start. Given the sharp sell-off in the 4th quarter of 2018, some of the rally in early 2019 is likely attributed to stock prices finding a more rational foundation after being oversold, with the remainder based on fundamental factors outlined above. These aren’t powerful reasons for the rally to continue the rest of the year, but no reason to decline either.
It is encouraging to see Industrials leading the way rather than Technology, as the returns of industrial companies tend to be more closely tied to longer term economic trends. The breadth of the rally is also hopeful, as the number of stocks rising versus falling each day hit new highs in February.
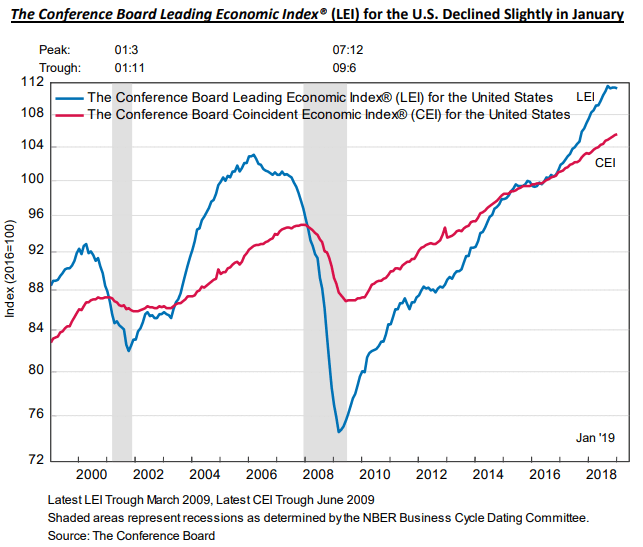
Another bright spot is the Conference Board’s ‘Leading Economic Indicators’ index which remains strong despite declining a bit in January.
6. Source: Dow Jones Market Data
What could go wrong?
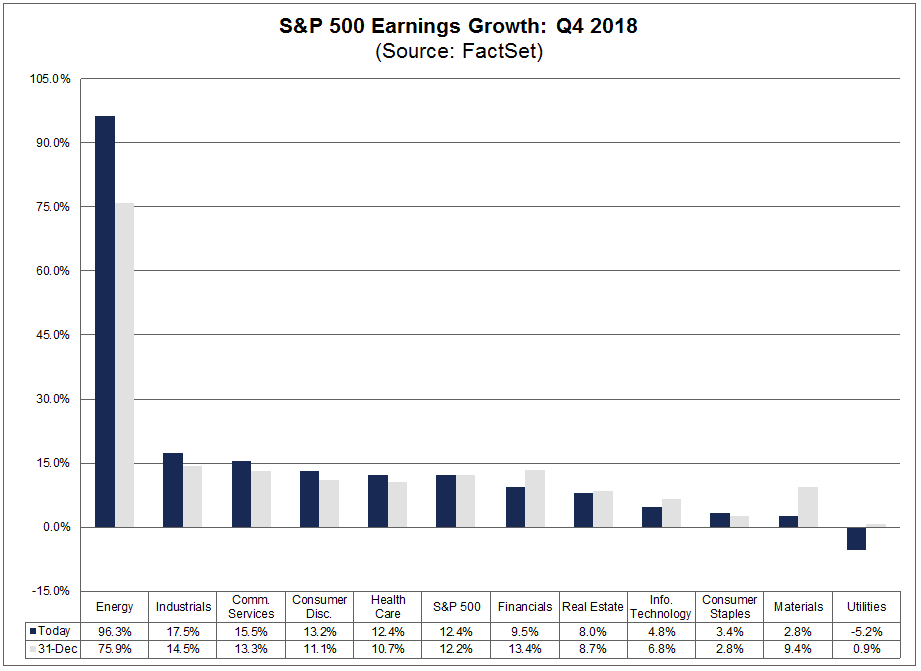
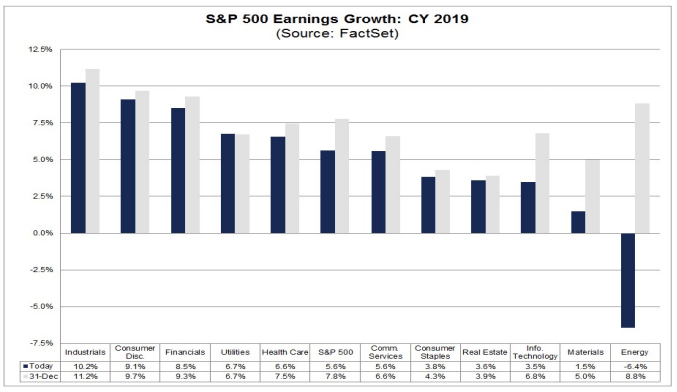
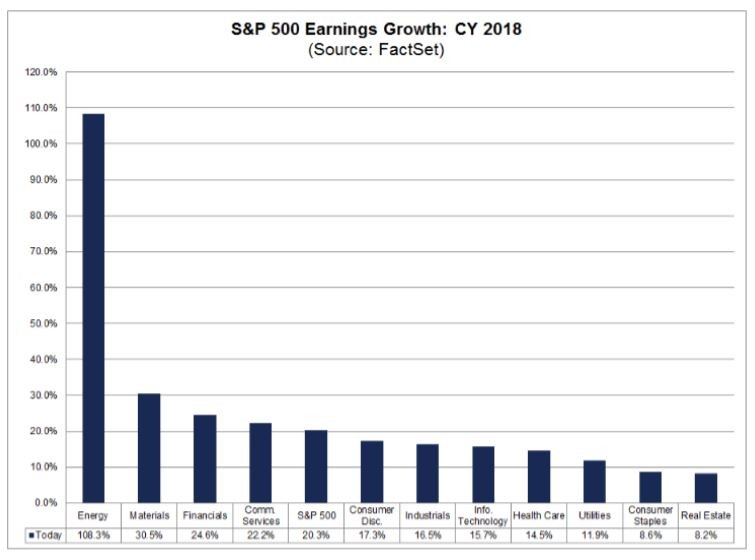
On the less optimistic side of the equation, most S&P 500 companies are forecasting earnings growth to slow in 2019. Overseas, economic tensions persist as the U.K. has yet to come up with a ‘Brexit’ deal acceptable to both the European Union and the British Parliament, and trade tariffs are hitting European automakers particularly hard. Add to this the worrisome growth of debt among many public and private entities worldwide, including the U.S. government, leaving central banks with less flexibility if the global economy stumbles.
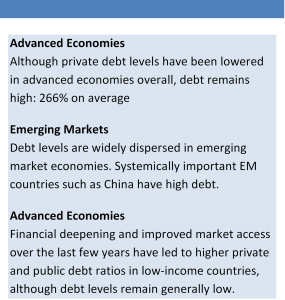
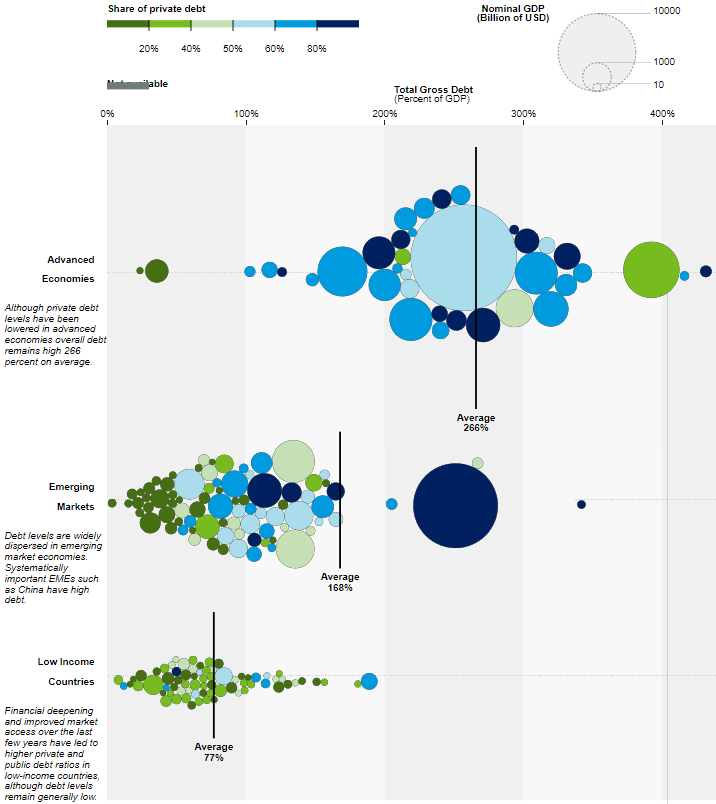
The International Monetary Fund recently published an eye-opening study about the amount of debt accumulated around the world. (see chart below) The large light blue circle in the ‘Advanced Economies’ section at the top of the chart represents U.S. public and private debt at 256% of GDP. Japan is the green circle at the top right with nearly 400% debt to GDP(!), and Germany is the medium blue circle at the top left with 171% debt.
The dark blue circle in the middle ‘Emerging Markets’ section represents the debt load of mainland China at 254%. The lower section reflects ‘Low Income’ countries including Bangladesh, the light blue circle in the middle with 76% debt, and Vietnam in dark blue at the far right of this group with 189% debt to GDP.
Global Public and Private Debt as a Percent of GDP
7. https://blogs.imf.org/2019/01/02/new-data-on-global-debt/
Is all this debt a problem, especially for the U.S. government with over $22 trillion debt outstanding?
You might be comforted to know that though the U.S. government debt load is growing ever higher – due in some part to the ever-expanding U.S. economy – the interest servicing cost is only 1 ½% of GDP, compared to about 3% of GDP in the much higher interest rate environment of the 1980s and 1990s.
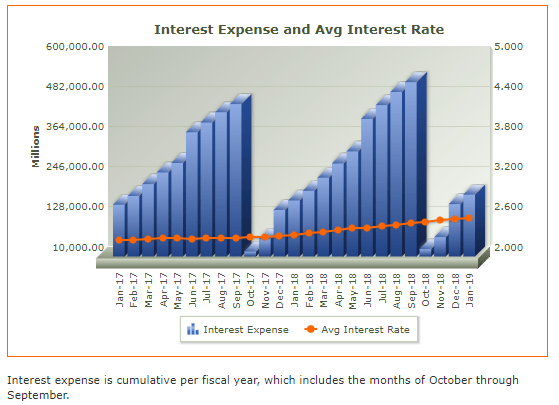
Source: www.treasurydirect.gov
As long as government borrowing and spending doesn’t ‘crowd out’ the private sector capacity to lend and spend, the debt shouldn’t be a problem. However, if government debt becomes so large that the government’s need to borrow pushes up interest rates for the rest of us, the economy could slow, kicking off a vicious cycle of unsustainable borrowing to keep the economy afloat. But there’s no need to panic just yet! Government debt is nowhere near the danger level and is unlikely to get there any time soon.
How do we weigh the positive and negative economic data?
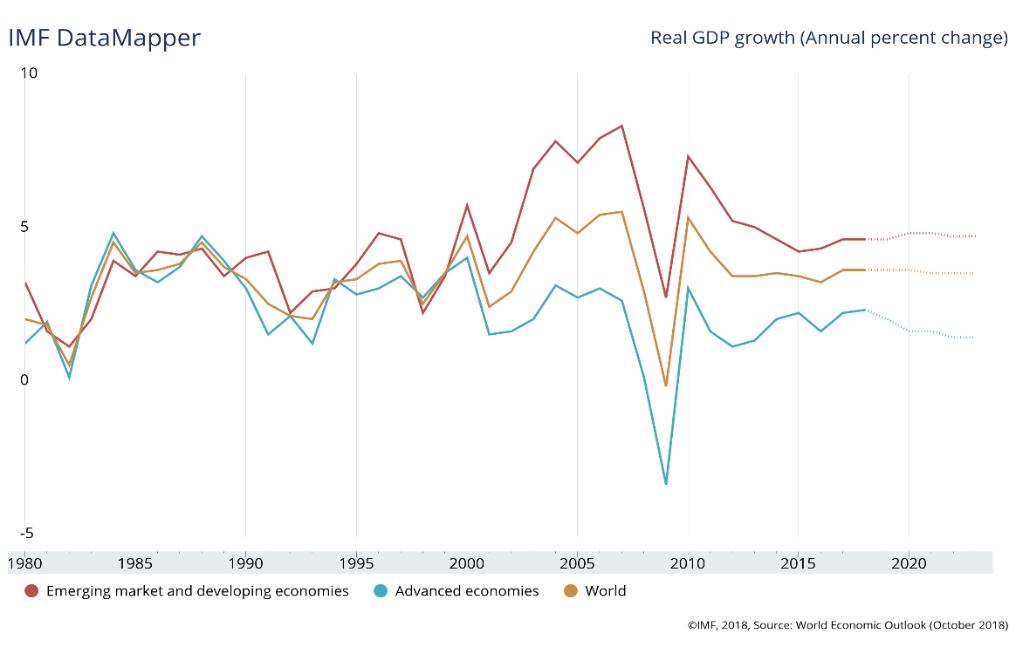
Based on the available information, it’s hard to say whether 2019 will be an outstanding year for financial assets, below average, or somewhere in between. The International Monetary Fund is forecasting an economic slowdown – not a recession – across most developed markets in 2019 and 2020 (including Europe and the U.S.)
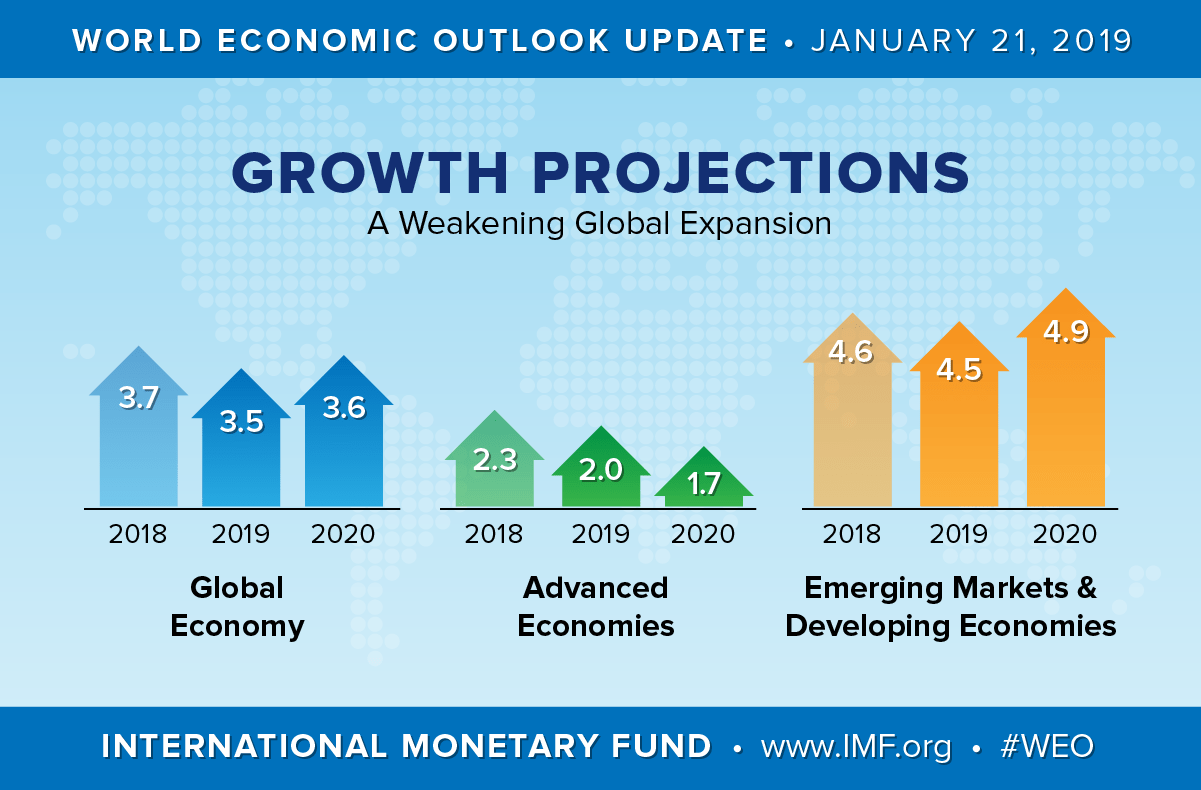
On balance, there is enough positive data to support the case that a recession is not on the horizon. This outlook is becoming more widely held, which should enable the financial markets to hold their position and cross the finish line in positive territory by the end of 2019.
As always, the investment team at Warren Street Wealth Advisors will keep a sharp lookout for confirming or contrary evidence as the year unfolds, and will base our investment decisions on the best information we can find. While the future remains unclear, we promise to keep you informed as we journey forward.
8. https://www.treasurydirect.gov/NP/debt/current
9.https://www.ftportfolios.com/Commentary/EconomicResearch/2019/2/22/debt,-the-economy-and-stocks
10. https://www.investopedia.com/terms/c/crowdingouteffect.asp
Quiz:
Referring to the IMF ‘Debt Around the World’ blog post at https://blogs.imf.org/2019/01/02/new-data-on-global-debt/, which of the following countries has the largest debt as a percent of GDP, including both government and private entities? (Hint: click on the link, then move your mouse over the circles to see the details for each country)
- United States
- China
- Japan
- Germany
If you’re the sort of person who likes to draw your own conclusions, we highly recommend the IMF website from which we source much of our global information. Click on this link to see global economic data: https://www.imf.org/external/datamapper/NGDP_RPCH@WEO/OEMDC/ADVEC/WEOWORLD
Answer below…

Marcia Clark, CFA, MBA
Senior Research Analyst
Warren Street Wealth Advisors
Warren Street Wealth Advisors, a Registered Investment Advisor. The information contained herein does not involve the rendering of personalized investment advice but is limited to the dissemination of general information. A professional advisor should be consulted before implementing any of the strategies or options presented. Any investments discussed carry unique risks and should be carefully considered and reviewed by you and your financial professional. Past performance may not be indicative of future results. All investment strategies have the potential for profit or loss.
DISCLOSURES
Investment Advisor Representative, Warren Street Wealth Advisors, LLC., a Registered Investment Advisor
The information presented here represents opinions and is not meant as personal or actionable advice to any individual, corporation, or other entity. Any investments discussed carry unique risks and should be carefully considered and reviewed by you and your financial professional. Nothing in this document is a solicitation to buy or sell any securities, or an attempt to furnish personal investment advice. Warren Street Wealth Advisors may own securities referenced in this document. Due to the static nature of content, securities held may change over time and current trades may be contrary to outdated publications.
Form ADV available upon request 714-876-6200
Quiz Answer: Japan