Posts

2023 Investment Update

Every January, it’s typical to reflect on market data from the year past. You’ll see the results in your own quarterly reports, as well as across the usual flurry of broad market analyses. 

Even when the numbers aren’t what we’d prefer—which has certainly been the case for 2022—we look at them anyway. It’s good to keep an eye on your annual investment returns, as they are one consideration among many that guide your financial plans. 

However, whether the numbers are up or down in any given year, we caution against letting them alter your mood, or as importantly, your portfolio mix. When it comes to future expected returns, a year’s performance is among the least significant determinants available.

To illustrate, consider what happened in 2022, and how global markets reacted. 

In the thumbs-down category, U.S. stock market indexes turned in annual lows not seen since 2008, with most of the heaviest big tech stocks taking a bath. Bonds fared no better, as the U.S. Federal Reserve raised rates to tamp down inflation. The U.K.’s economic policies resulted in Liz Truss becoming its shortest-tenured prime minister ever, while Russia’s invasion of Ukraine and China’s continued COVID woes kept the global economy in a tailspin. 

On the plus side, inflation has appeared to be easing slightly, and so far, a recession has yet to materialize. A globally diversified, value-tilted strategy has helped protect against some (certainly not all) of the worst returns. An 8.7% Cost-of-Living Adjustment (COLA) for Social Security recipients has helped ease some of the spending sting, as should some of the provisions within the newly enacted SECURE 2.0 Act of 2022 here. 

Now, how much of this did you see coming last January? Given the unique blend of social, political, and economic news that defined the year, it’s unlikely anything but blind luck could have led to accurate expectations at the outset. 

In fact, even if you believe you knew we were in for trouble back then, it’s entirely possible you are altering reality, thanks to recency and hindsight bias. The Wall Street Journal’s Jason Zweig ran an experiment to demonstrate how our memories can deceive us like that. Last January, he asked readers to send in their market predictions for 2022. Then, toward year-end, he asked them to recall their predictions (without peeking). The conclusion: “[Respondents] remembered being much less bullish than they had been in real time.” 

In other words, just after most markets had experienced a banner year of high returns in 2021, many people were predicting more of the same. Then, the reality of a demoralizing year rewrote their memories; they subconsciously overlaid their original optimism with today’s pessimism. 

Where does this leave us? Clearly, there are better ways to prepare for the future than being influenced by current market conditions, and how we’re feeling about them today. Instead, everything we cannot yet know will shape near-term market returns, while everything we’ve learned from decades of disciplined investing should shape our long-range investment plans. 

We wish you and yours a happy and healthy 2023, come what may in the markets. Please let us know of any new ways we can further your financial interests at this time. This, and every year, we remain grateful for your business.

Blake Street, CFA, CFP®

Founding Partner & Chief Investment Officer, Warren Street Wealth Advisors

Investment Advisor Representative, Warren Street Wealth Advisors, LLC., a Registered Investment Advisor

The information presented here represents opinions and is not meant as personal or actionable advice to any individual, corporation, or other entity. Any investments discussed carry unique risks and should be carefully considered and reviewed by you and your financial professional. Nothing in this document is a solicitation to buy or sell any securities, or an attempt to furnish personal investment advice. Warren Street Wealth Advisors may own securities referenced in this document. Due to the static nature of content, securities held may change over time and current trades may be contrary to outdated publications. Form ADV available upon request 714-876-6200.

Part 3: A Lookback at Q1 and Portfolio Impact

If you’re talking with friends about market volatility, pessimists may say “downward is the only way forward,” but optimists like us will continue to share the sentiment that “We Will Prevail,” which is based on our assessment of history, data, and our go-forward market outlook.

For those of you who caught that subtle reference from the movie Inception, maybe you’re getting a taste for how big of a cinephile I am. For those who didn’t – no sweat; let’s wrap up this series of blog releases by assessing the first quarter’s market performance. 

Before diving in, it’s important to note the macroeconomic trends that are primarily driving market risk: 1) the tightening of financial conditions and 2) the war in Eastern Europe. The Federal Reserve and other Central Banks are raising interest rates to calm inflation. Meanwhile, Russia’s invasion of Ukraine has had knock-on effects economically, particularly in Europe. With that in mind, see below for how markets are ending the first quarter.

Exhibit A – Asset Class Performance in 2022

Source: YCharts

The Laggards

Looking at Exhibit A, bonds, followed by US Large Growth names (i.e., AMZN, AAPL), and international stocks (i.e., emerging markets and Europe stocks) are lagging. 

  • Bonds Begrudgingly Behind: recent bond volatility can be attributed to inflation and rising interest rates. Inflation diminishes the purchasing power of a bond’s interest payments, while interest rate hikes apply downward price pressure on the value of a bond (you can now find a similar bond in the market yielding a higher rate). 
  • Growth Names Falter: This asset class includes larger companies that are typically more expensive (e.g., Amazon, Apple), with stock prices that are highly dependent on future earnings growth. However, rising interest rates are raising the cost of borrowing, which depletes the value of a company’s future cash flows and are skewing growth names to the downside.

Exhibit B – How Are Big Tech Stocks Doing?

  • International Stocks Give Up Ground: At the start of the year, international stocks including European, Australian, and Far East (EAFE) and Emerging Markets (e.g., China, Brazil) equities outperformed domestic markets. US markets were being punished for an overweight to growthier names amid interest rate hikes. Most recently, the Russian invasion of Ukraine has dampened investor appetite for the international scene, overturning the region’s initial outperformance. 

Exhibit C – The Race Between International and the US

Source: YCharts

Leaders

  • Gold Shines Bright: After a lackluster 2021, gold regained its shine this past quarter. Geopolitical uncertainty, coupled with a distrust of central banks to tame inflation, has resulted in sizable outperformance from the precious metal.
  • Value Names Triumph: While US Large Growth suffers from tighter financial conditions, investors are paying more attention to company profitability. US Large Value typically consists of companies that are larger, have a long-standing business model, and proven profitability. Examples include Target, Walmart, and Disney. 
  • S&P 500 Recovers: After a weak start to the year (at one point being down 12% year-to-date), the S&P 500 has largely regained lost ground. Although the expectation of rate hikes remains a risk to the broader index, domestic markets have been favorable given a relatively unthreatening economic impact from the Eastern European war.

Takeaways, Portfolio Impact and Our Game Plan

Takeaways – Is the 60/40 Portfolio Dead? A 60/40 portfolio has long been coveted as the standard for a “moderate” risk investor, with a 60% allocation to stocks and a 40% allocation to bonds. The bond allocation is meant to mitigate volatility during downturns, but with today’s largely challenged bond environment, the asset class has not cushioned investors during this recent equity sell-off. 

Source: YCharts

Exhibit C includes the annual returns of a 60/40 portfolio, the global stock index (Ticker: ACWI), and the passive bond index (Ticker: AGG). Over the years, bonds have served as a protector against equity volatility, capturing a fraction of an equity market drawdown. However, thus far in 2022, bonds are selling off more than equities. Therefore, investors should not expect to receive similar risk-adjusted returns they did in the past for a traditional 60/40 portfolio – at least in the near term.  

Portfolio Impact – Thinking Outside the Box: With the 60/40 structure in jeopardy and bonds to endure some short-term pain, a different approach should be considered. Enter Warren Street’s Real Assets sleeve – or what we like to call “Diversifiers” – which consist of real assets that typically benefit from inflation (i.e., gold, natural resources, and real estate).

Last summer, after acknowledging the adverse circumstances of the bond realm, Warren Street proceeded to underweight bonds and overweight diversifiers within blended models on top of initiating a position in a commodities fund. This trade has rewarded our portfolios and cushioned the bond and equity sleeves amid the most recent 2022 sell-off.

Our Game Plan – An International Resurgence: With Diversifiers outpacing stocks, our team rebalanced real assets into equity weakness, effectively selling high and buying low. We will continue to monitor momentum within Diversifiers and the bond landscape before returning to our neutral weights. 

The looming question remains on our equity strategy, which incurred relative underperformance attributed to our overseas exposures. Although Russia’s military invasion overturned initial outperformance against domestic markets (see Exhibit C), we believe there is significant headroom for an international equity resurgence should the war abate. 

Albeit still unpredictable, Ukrainian resistance is increasing the probability for a ceasefire. Couple that with the pandemic transitioning to an endemic, a US market that is more sensitive to central bank reserve tightening and attractive valuations overseas, we continue to remain optimistic about our clients being rewarded for their patience and for avoiding home-country bias. 

Conclusion

You’ll hear us say it time and time again: control what you can control. Throughout this quarter, our team has tax-loss harvested in accounts amid sell-offs, rebalanced diversifiers into equity weakness, and thoroughly assessed the impact of conditions #1 and #2 mentioned above in our portfolios.

Outside of portfolio strategy, we’ve made strides in uploading more content on socials, blogs, and video formats to upkeep communications beyond our client meetings. We encourage you to read recent blog releases pertaining to the war in Ukraine and to give us a follow on social media. 

Ultimately, the movie inception is about planting an idea and allowing it to grow. I’m no extractor or architect of dreams, but let me attempt to fortify my parting idea once more: “We Will Prevail.”

Phillip Law, Portfolio Analyst

Wealth Advisor, Warren Street Wealth Advisors

Investment Advisor Representative, Warren Street Wealth Advisors, LLC., a Registered Investment Advisor

The information presented here represents opinions and is not meant as personal or actionable advice to any individual, corporation, or other entity. Any investments discussed carry unique risks and should be carefully considered and reviewed by you and your financial professional. Nothing in this document is a solicitation to buy or sell any securities, or an attempt to furnish personal investment advice. Warren Street Wealth Advisors may own securities referenced in this document. Due to the static nature of content, securities held may change over time and current trades may be contrary to outdated publications. Form ADV available upon request 714-876-6200.
Part 2: Assessing War and the State of the Global Economy

Don’t Miss the Big Picture 

With news outlets centered on Eastern Europe, it is easy to miss the bigger economic picture both globally and domestically. For a broader assessment, it helps to understand how Russia fits into the global economy. Prior to the invasion, the Kremlin represented just 3.11% of global GDP.  

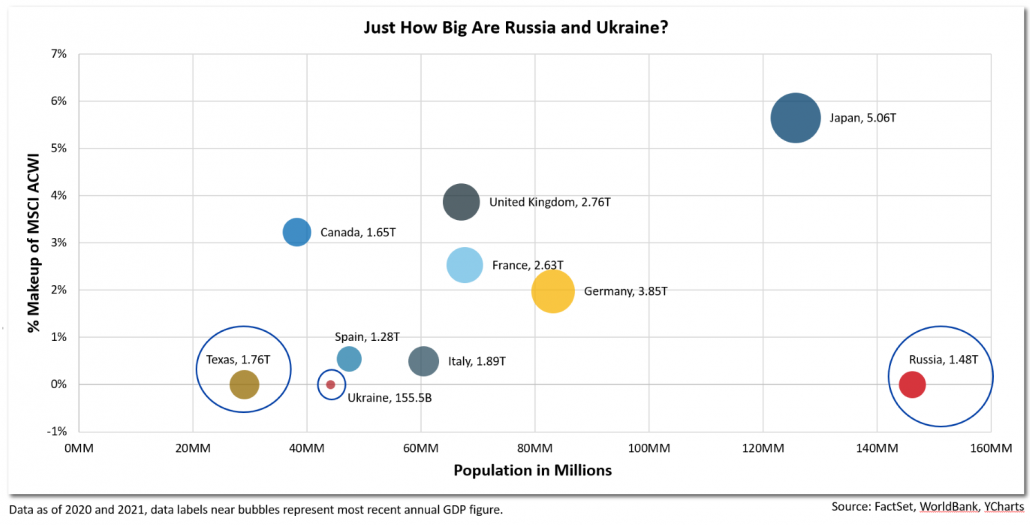
To further illustrate, Exhibit A and Exhibit B portray the size of Russia’s economy, population, and percent makeup of the global stock market compared to other countries. Looking at Exhibit A, Russia has the largest population of this subset, yet its economy (the size of the bubble) is smaller than Texas. Thus, the war’s direct effect on global growth was already limited even before indices deemed Russia as “uninvestable” or before western parties imposed sanctions.  

Exhibit A – Russia’s Economy is Smaller Than Texas 
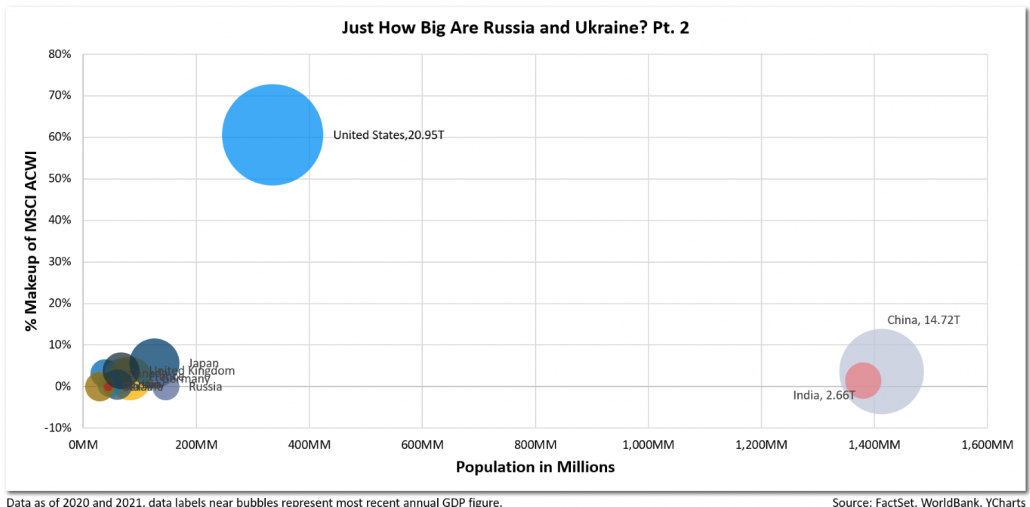
Exhibit B – Russia is Miniscule compared to the US, China, and India  

Zooming out in Exhibit B, you can assess just how small Russia is relative to the United States and its Asian neighbors China and India.  

The State of the West 

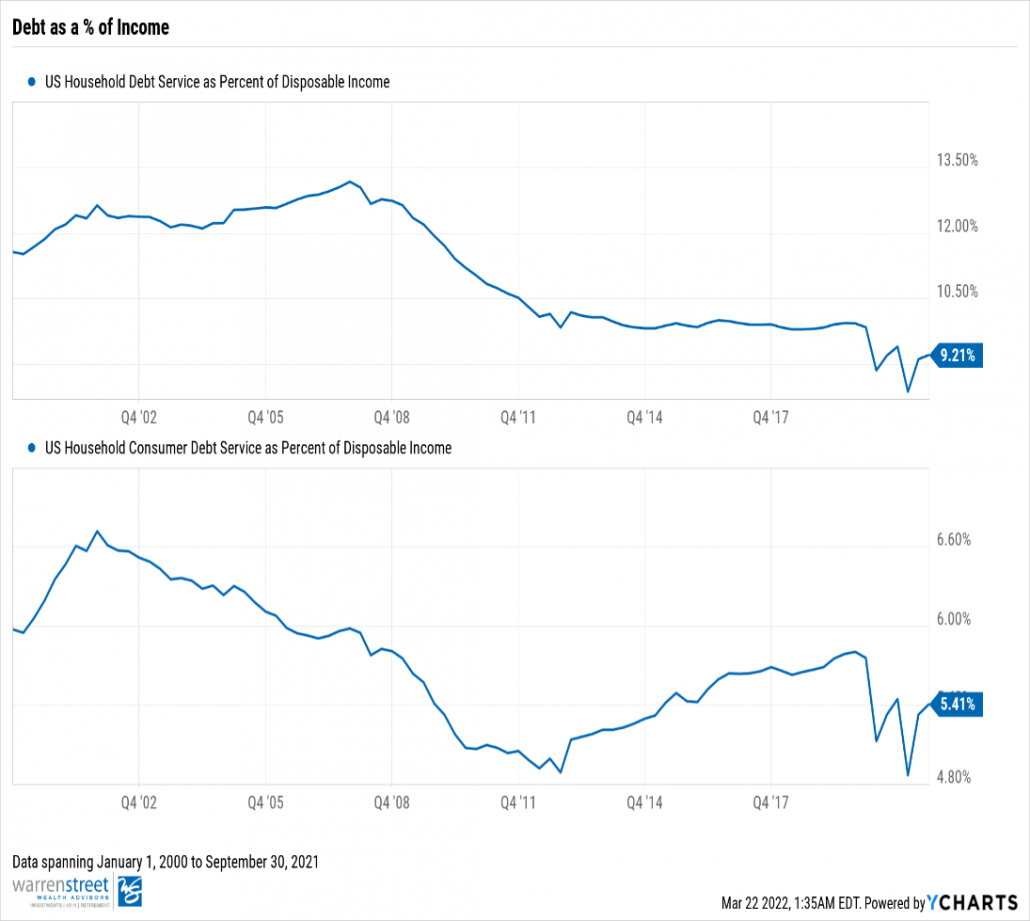
Before discussing other nations, let’s cover our home turf. Within the United States, we have successfully fended off the Omicron wave. COVID-19 data is trending in the right direction, pandemic related pressures (i.e., labor market, car prices) are slowly easing (Exhibit C), and consumer balance sheets are rock-solid (Exhibit D).  

Exhibit C: The Labor Market is Loosening, and Inventories are Building 
Exhibit D.1: Debt as a % of Consumer Incomes

Exhibit D.2: Consumers Have a Record $2.4T in “Excess Savings”

Although the threats of additional COVID-19 variants and prolonged inflation linger, our economy is expected to produce above-trend economic growth (see Exhibit E). In fact, economists remain optimistic about the US economy, with the median 2022 real gross domestic product forecast only revised 0.10% downwards after the invasion of Ukraine.  

Other major economies (particularly in Europe) are more at risk for an economic slowdown attributed to higher energy prices (i.e., over $120/barrel for Brent Crude driven), or what we call “pain at the pump.”  

Although Europe derives 40%+ of its natural gas from Russia and Ukraine, we expect that new measures targeting energy independence and militaristic efforts will have positive long-standing effects on European growth despite interim road bumps. For some near-term perspective, European nations are still expected to grow GDP above their long-term forecasts in 2022 (see Exhibit E).

Exhibit E: How Much Are Our Economies Expected to Grow in 2022?

Commodity Chaos – Not to be Overlooked 

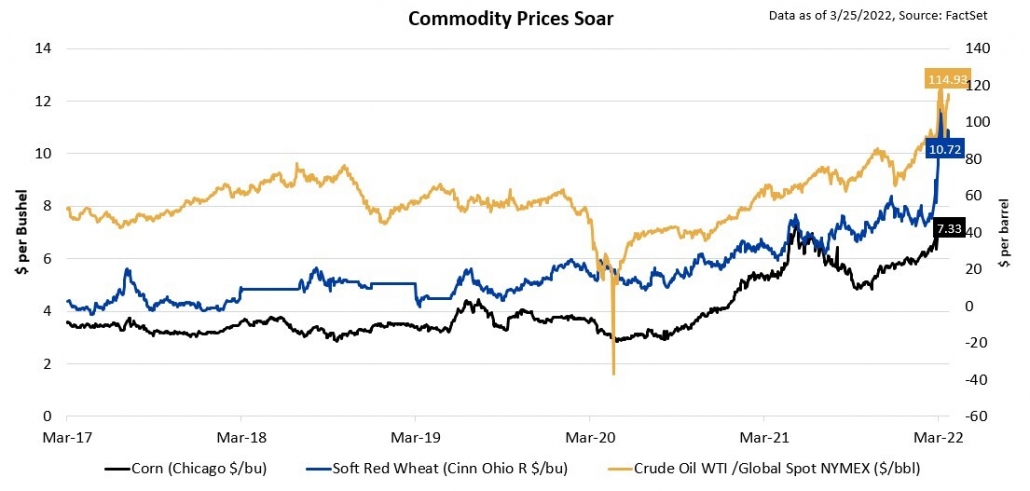
Although the war’s direct effect on global growth is likely to be meager, indirect pressures on commodity prices are a larger concern, as they may diminish the purchasing power of disposable incomes. Russia is the world’s second largest oil producer behind the US, and accounts for 12% of global production. Also, Russia and Ukraine make up 25% of global wheat exports, 33% of global corn trade, and 80% of sunflower oil production.  

What happens if sanctions are imposed, or if nations surrender agricultural practices to fight on the battlefield? The price of electricity in your factories will rise. Middle eastern nations reliant on wheat imports (i.e., Egypt and Lebanon) must ration appropriately. Chinese-grown hogs – which feed on corn – are more expensive to raise. Lastly, the price of that bag of Ruffles (made from sunflower oil) is expected to increase. 

Exhibit F: Commodity Prices Are Rising

Where Do We Go from Here? 

Could this lead to inflation? Yes – we have already seen commodity prices surge exponentially. Does this mean that the US economy will fall to its knees? The probability of that is very low.  

After all, two-thirds of our nation’s economy is consumption-driven, and with consumers looking healthy and a central bank easing the economy into a higher rate environment, it is hard to envision a full-scale economic disaster unfolding. Even if we run into a recession, perhaps it will be much smaller than our recent lived experiences of the Great Recession and the Great Lockdown (2020 COVID-19 Pandemic).  

Our European neighbors will be more vulnerable over the next three months, especially with an energy embargo on Russia still on the table. However, between German Chancellor Olaf Scholz mobilizing its military (for the first time in 20 years), renewed sentiment on energy independence, and a newfound unity amongst the entire West, the European economy is exuberating a different luster and willingness to grow than it did in previous years. Should this war abate, we believe Europe could resume course towards full recovery and investors with allocations will be rewarded. 

A Stronger West, Once the War is Put to Rest 

Ultimately, our sentiment from part 1 of this series that “We Will Prevail” has not changed. We have endured many instances of short-term pain and come out victorious. This time is no different. I am confident that our economies – particularly the West — will emerge stronger and more united after this war is put to rest.  

Stay tuned in part 3 where we discuss asset class performance and portfolio impact! 

Phillip Law, Portfolio Analyst

Wealth Advisor, Warren Street Wealth Advisors

Investment Advisor Representative, Warren Street Wealth Advisors, LLC., a Registered Investment Advisor

The information presented here represents opinions and is not meant as personal or actionable advice to any individual, corporation, or other entity. Any investments discussed carry unique risks and should be carefully considered and reviewed by you and your financial professional. Nothing in this document is a solicitation to buy or sell any securities, or an attempt to furnish personal investment advice. Warren Street Wealth Advisors may own securities referenced in this document. Due to the static nature of content, securities held may change over time and current trades may be contrary to outdated publications. Form ADV available upon request 714-876-6200.
Part 1: We Will Prevail

“There are decades where nothing happens; and there are weeks where decades happen.”

– Vladimir Lenin

The words of Lenin, who led the Russian Revolution in 1917, are ringing true in his own country over 100 years later. Russian Prime Minister Vladimir Putin’s decision to invade Ukraine took the world, and financial markets, by storm. For investors, initial instincts may prompt feelings of worry, and rightfully so.

After all, homes are collapsing, buildings are burning, and civilians are being displaced in what publications are calling the biggest war in Europe since 1945. First and foremost, we empathize with the human concerns and humanitarian disaster resulting from Russia’s full-scale invasion of Ukraine. We believe that a broad understanding of the market’s relationship with geopolitical crises, the state of the global economy, and the war’s impact on broad asset classes will help investors navigate this turbulent time.

This series will aim to address the concerns that arise for investors and global markets during such times.

Weathering the Storm

In an era where G20 nations are accustomed to diplomacy, the impact of war on markets may seem foreign. However, we can turn to history to help distinguish relationships between capital returns and warfare. Below is a chart showing the growth of $10,000 invested in the S&P 500 since 1950, overlayed with a myriad of events.

Exhibit A1

Looking back, the S&P 500 grappled with numerous instances of geopolitical turmoil, nationwide systemic meltdowns, and a global pandemic. Despite these vulnerabilities, notice the trend and direction of that initial $10k: it consistently recovers and grows over time Furthermore, Exhibit B features returns 12, 24, and 36 months after the market bottomed in each war.

Exhibit B 

These charts convey two things:

  1.  Despite volatile periods, investors have generally been rewarded for putting their capital at risk.
  2.  Human beings are incredibly resilient. We’ve lived through arduous events, gritted our teeth, and made it to the other side.

Some people are comparing this conflict to World War II, but we disagree given that the battle is regionally contained and the US is unlikely to become directly involved. The conflict can, and likely will, get worse. But the probability of another world war is low.  

The outcome of Russia’s invasion is difficult to predict. Whether Putin succeeds in establishing a puppet government in Kyiv or a ceasefire is negotiated, we have faith that humankind will persevere and that capital will continue to seek the most efficient allocators, leading to long-term positive returns. In other words, we will prevail.

Phillip Law, Portfolio Analyst

Wealth Advisor, Warren Street Wealth Advisors

Investment Advisor Representative, Warren Street Wealth Advisors, LLC., a Registered Investment Advisor

The information presented here represents opinions and is not meant as personal or actionable advice to any individual, corporation, or other entity. Any investments discussed carry unique risks and should be carefully considered and reviewed by you and your financial professional. Nothing in this document is a solicitation to buy or sell any securities, or an attempt to furnish personal investment advice. Warren Street Wealth Advisors may own securities referenced in this document. Due to the static nature of content, securities held may change over time and current trades may be contrary to outdated publications. Form ADV available upon request 714-876-6200.

Footnotes & Sources:

  1. Chart is not log-scaled and thus understates market return volatility.

Fighter Planes and Market Turmoil

Have you been reading the daily headlines—watching markets stall, recover, and dip once again? If so, you may be wondering whether there’s anything you can do to avoid the motion sickness. 

If you already have a well-structured, globally diversified portfolio tailored for your goals and risk tolerances, our answer remains the same as ever: Your best course is to stay the course. Remember, our investment advice is aimed at helping you successfully complete your long-term financial journey. As “The Psychology of Money” author Morgan Housel has observed:  

“Bubbles do their damage when long-term investors playing one game start taking their cues from those short-term traders playing another.”

The Case of the Missing Bullet Holes

Have we ever told you the tale of the World War II fighter jets and their “missing” bullet holes? Today’s bumpy market ride seems like a good time to revisit this interesting anecdote about survivorship bias. 

The story stems from studies conducted during World War II on how to best fortify U.S. bomber planes against enemy fire. Initially, analysts focused on where the returning bombers’ hulls had sustained the most damage, assuming these were the areas requiring extra protection. Fortunately, before the planes were overhauled accordingly, statistician Abraham Wald improved on the evidence. He suggested, because the meticulously examined planes were the survivors, the extra fortification should be applied where they had fewer, not more bullet holes. 

How so? Wald explained, the surviving planes’ bullet-free zones were not somehow impervious to attack. Rather, when those zones were getting hit, those planes weren’t making it back at all. Survivorship bias had blinded earlier analyses to the defenses that mattered the most. 

Surviving Market Turbulence

You can think about the markets in similar fashion. For example, consider these recent predictions from a well-known market forecaster (emphasis ours): 

“Jeremy Grantham, the famed investor who for decades has been calling market bubbles, said the historic collapse in stocks he predicted a year ago is underway and even intervention by the Federal Reserve can’t prevent an eventual plunge of almost 50%.” 

ThinkAdvisor, January 20, 2022

At a glance, that sounds pretty grim. But read between the lines for a hidden insight: He was also predicting the same collapse a year ago??? Yes, he was: 

“Renowned investor Jeremy Grantham, who correctly predicted the Japanese asset price bubble in 1989, the dot-com bubble in 2000 and the housing crisis in 2008, is ‘doubling down’ on his latest market bubble call.” 

ThinkAdvisor, January 5, 2021

What if you had heeded Grantham’s forecasts a year ago, and left the market in January 2021? Time has informed us, you would have missed out on some of the strongest annual returns the U.S. stock market has delivered in some time. 

Now What?

If market volatility continues or worsens, brace yourself. You’re going to be bombarded with similar predictions. Few will be bold enough to foretell the exact timing, but the implications will be: (1) it’s going to happen soon, and (2) you should try to get out before it’s too late. 

Some of these forecasts may even end up being correct. Bear markets happen, so anyone who regularly forecasts their imminent arrival will occasionally get it right. Like a stopped clock. Or those continually looping infomercials on how “now” is the best time to load up on silver or gold. (Incidentally, many of these same precious metal purveyors are among those routinely predicting the end is near for efficient markets.)  

Bouts of market volatility are like the bullet holes we can see. They’re not pretty or fun. But interim volatility isn’t usually your biggest threat … attempting to avoid it is. The preparations we’ve already made may be less obvious, but they’re there—including tilting a portion of your portfolio into riskier sources of expected return for long-term growth, fortifying these positions with stabilizing fixed income, and shoring up the entire structure with global diversification. 

This brings us to the real question: What should you do about today’s news? Unless your personal financial goals have changed, your best course is probably the one you’re already on. That said, we remain available, as always, to speak with you directly. Don’t hesitate to be in touch with any questions or comments you may have. 

Phillip Law, Portfolio Analyst

Wealth Advisor, Warren Street Wealth Advisors

Investment Advisor Representative, Warren Street Wealth Advisors, LLC., a Registered Investment Advisor

The information presented here represents opinions and is not meant as personal or actionable advice to any individual, corporation, or other entity. Any investments discussed carry unique risks and should be carefully considered and reviewed by you and your financial professional. Nothing in this document is a solicitation to buy or sell any securities, or an attempt to furnish personal investment advice. Warren Street Wealth Advisors may own securities referenced in this document. Due to the static nature of content, securities held may change over time and current trades may be contrary to outdated publications. Form ADV available upon request 714-876-6200.
Is Tesla Flying Too Close to the Sun?

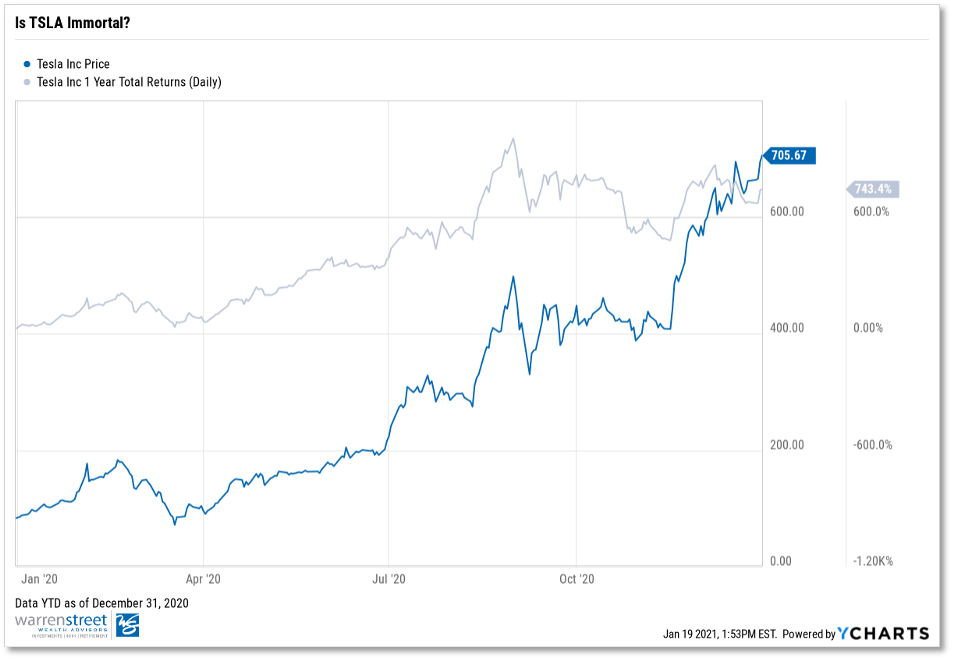
743%. That’s how much Tesla stock (Ticker: TSLA) returned in 20201. Most of us are aware of the bifurcation between the market’s seemingly invisible ceiling and the economy’s continued disarray, but nobody could have foreseen that Elon Musk and his army of “musketeers” would be amongst those most rewarded for owning increased allocations of TSLA stock.

In fact, 2020 was an eventful year for the electric vehicle company. Among a series of roller coaster weeks, a stock split announcement, and raging debate over analyst price targets, perhaps TSLA’s most noteworthy 2020 phenomenon was its inclusion in the S&P 500 Index – a profound move that has us concerned over the stock’s perceived immortality at the forefront.

On December 21, 2020, the S&P 500 Index committee formally added the “profitable” carmaker to the index after denying TSLA index entry earlier in the year. The circumstances around this inclusion eerily resembles something we’ve seen before. Does “You’ve Got Mail” ring a bell? That’s right – we see multiple uncanny parallels between the TSLA and former net stock giant: American Online (AOL).

Echoes of The Past

On December 23, 1998, Standard & Poor’s announced it would make American Online the first “net” stock featured in the S&P 500 Index. Leading up to the announcement, AOL rallied 510% year-to-date2, before ending the year with a return of 585%. Compare this to TSLA, which had run-up 388%3 by the time the committee made its announcement on November 16, 2020. As mentioned previously, TSLA’s 2020 return was 743%. Notice here that a large proportion of TSLA’s 2020 return came in the last month and a half in the year…talk about upward volatility.

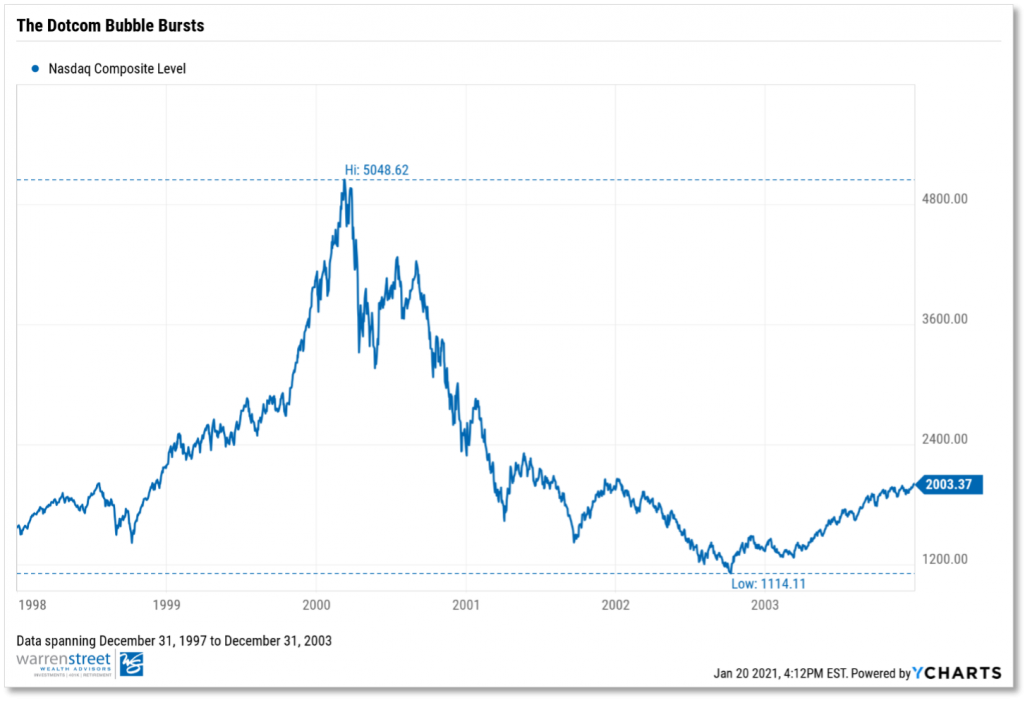
Arguably, the most intriguing similarity between these two stocks is the amount of price action driven by momentum and fear of missing out (FOMO). Investors overlooked red flags related to both AOL’s fundamentals and underlying profitability of tech stocks. AOL eventually lost 91%4 of its market value after a failed merger with Time-Warner cable. Meanwhile, valuations of tech stocks (represented by the Nasdaq Index) peaked in early 2000 before seeing 78%5 of its value disintegrate. Fast forward to the end of 2020, you have Tesla, a company whose “profitability” is primarily tied to energy credits, octupling (8x) its stock price to levels many investors deem uncomfortable.

Will TSLA suffer the same fate as AOL and other dotcom counterparts? Obviously 2021 is a different year. The carmaker makes electric-powered cars, not an instant messaging platform. We do acknowledge that historical performance is not indicative of future performance; and that correlation does not equal causation. However, it’s important to remember that those who don’t learn from history are doomed to repeat it.

How Much TSLA Do You REALLY Own?

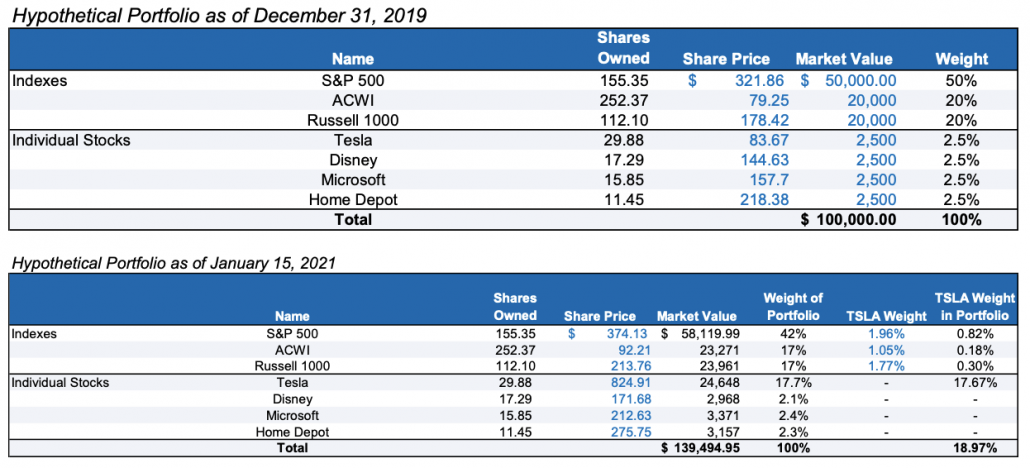
TSLA’s inclusion in the S&P 500 Index raises a new challenge for investors: hidden concentration risk. With TSLA now a part of the NASDAQ, Russell 1000, and widely regarded S&P 500, owning index funds inherently carries TSLA exposure. Borrowing from our friends over at WisdomTree, imagine a scenario where Portfolio A holds broad index funds in addition to a few well-known names.

What investors thought was a 2.50% allocation to TSLA is at 4.00%6. I know, I know. 4% doesn’t seem like a big deal. Besides, what investor puts 90% of their equity allocation into only broad U.S. ETFs? (You’d be surprised). The more important point though, is that volatile price action with TSLA can hide how much of the stock you really own.

At the end of 2019, TSLA shares were at $83.67. As of Friday, January 15, 2021 – the stock sits at $824.91 – almost ten times over its stock price just a year ago. Let’s say you owned Portfolio A on December 31, 2019. As of January 15 this year, TSLA would comprise 19% of Portfolio A’s exposure (see Appendix A). Obviously, price appreciation and concentration risk create their own problems (e.g., skewed returns, tax consequences), but when the underlying rationale for that price appreciation is in question by the investment community at large, you could have an even bigger problem on your hands.

 Will TSLA Fall Back Down to Earth?

Today, it seems as if TSLA has really shot over the moon, multiplying its stock price ten times in a little over a year. Will the carmaker continue to defy odds throughout 2021? Or, is Tesla a ticking-time bomb waiting to explode?

We at Warren Street Wealth Advisors aren’t equity research moguls here to publish a Buy, Sell, or Hold on this highly debated stock. However, we do acknowledge that no company is immune from idiosyncratic risk. Whether Tesla can stay above the influx of foreign competition (e.g., NIO, Volkswagen), or whether or not valuations are outstretched represent just a few of many risks to the company’s stock price.

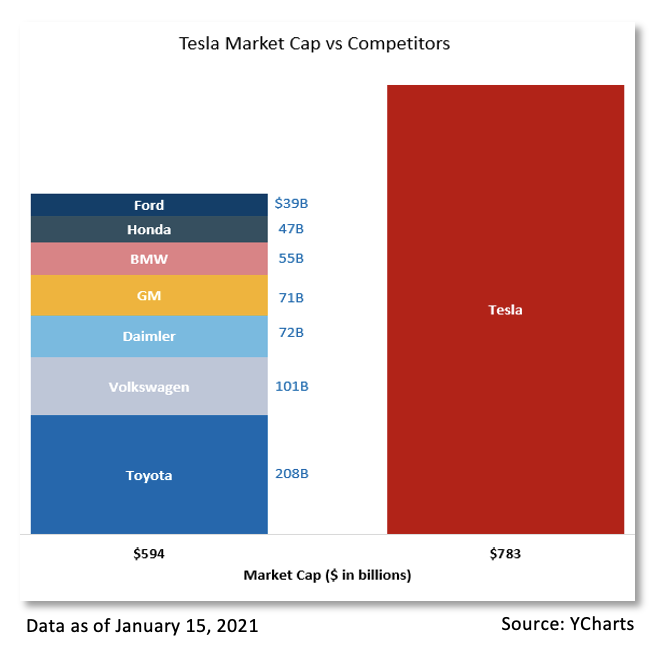
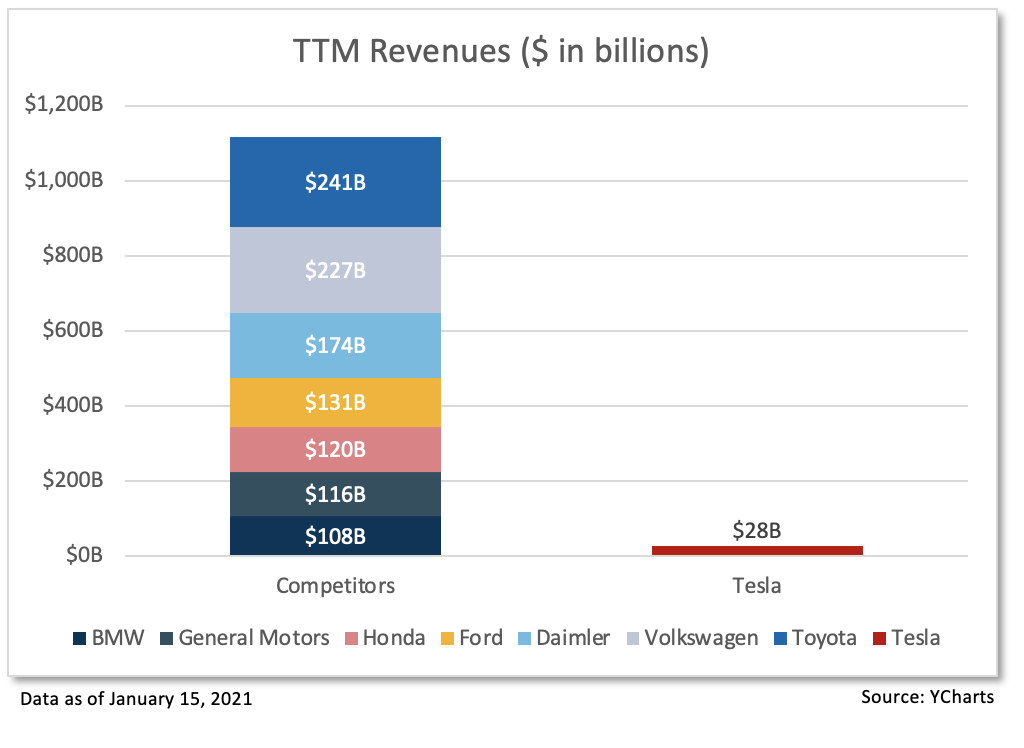
One observation fueling TSLA’s controversy is that despite having a much larger market cap relative to other established vehicle manufacturers (see above), the company only generated $28.2 billion in sales7. Compare this to a combined $1.1 trillion in sales7 for all its auto competitors listed above. How can a company, which does a fraction of its competitors’ sales, be worth more than all of them combined? Again, TSLA isn’t just a car company – it’s thought to be a generational leader driving the next revolution in clean energy; but nevertheless, some food for thought while you’re on the road.

Tesla’s ride sure was wild in 2020, and nobody can guarantee what will happen in 2021. However, as prudent investors, it’s important to not overlook the implications that a high-flying stock can have on client portfolios. We’re not here to argue whether Tesla’s run has just begun or if the stock’s price is dangerously inflated. But if the latter of those two ideas rings true, the world could be shocked when it sees electricity and a bubble come together.

Footnotes:

  1. YTD total return as of 12/31/2020 sourced to YCharts.
  2. YTD total return for 12/23/1998 and 12/31/1998 sourced to historicalstockprice.com.
  3. YTD total return as of 11/16/2020.
  4. AOL’s market cap plummeted from $226 billion to roughly $20 billion in 2003, sourced to Bezinga.
  5. NASDAQ percent off high spanning 12/31/1997 to 12/31/2003.
  6. 4.04% is the summation of multiplying TSLA weight in index by index weight in portfolio.
  7. Trailing twelve-month figures.

Appendix A

For any questions regarding international investments, emerging markets, or wealth management, please call 714-876-6200 or email phillip@warrenstreetwealth.com

Phillip Law, Portfolio Analyst

Wealth Advisor, Warren Street Wealth Advisors

Investment Advisor Representative, Warren Street Wealth Advisors, LLC., a Registered Investment Advisor

The information presented here represents opinions and is not meant as personal or actionable advice to any individual, corporation, or other entity. Any investments discussed carry unique risks and should be carefully considered and reviewed by you and your financial professional. Nothing in this document is a solicitation to buy or sell any securities, or an attempt to furnish personal investment advice. Warren Street Wealth Advisors may own securities referenced in this document. Due to the static nature of content, securities held may change over time and current trades may be contrary to outdated publications. Form ADV available upon request 714-876-6200.

Will Your Vote Move the Market?

Election seasons are highly polarized and leave investors from both sides of the political aisle paralyzed by what-ifs and fear of the other. This seems more true now than ever. Given COVID-19, supreme court implications, and an incredibly divided nation in terms of policy wishes, we expect a volatile finish to 2020. Due to an expected record number of mail-in ballots due to the election, it’s even possible the results aren’t known for days or even weeks. It’s normal to be concerned, but does the data support it? Does taking investment action make sense?

Believe it or not, I wrote the above days before President Trump and the First Lady contracted COVID-19. Can 2020 have any more twists and turns? Our team at Warren Street sends our thoughts and well wishes to them both, their families, and their staff. We hope a speedy and full recovery ensues. The diagnosis for President Trump is undoubtedly troubling given his age and possible pre-existing conditions, it’s sure to inject additional doubt into investors’ minds. CDC data however is still dramatically in his favor and it’s safe to assume he’ll receive best-in-class care. Historically, election seasons have in-fact provided for increased volatility in the markets. In addition, the dispersion in results and returns has been all over the map especially in the short term. You should find comfort however in the fact that long term returns have generally been positive regardless of who’s been at the Presidential helm or a split vs. unified congress. More details to come.

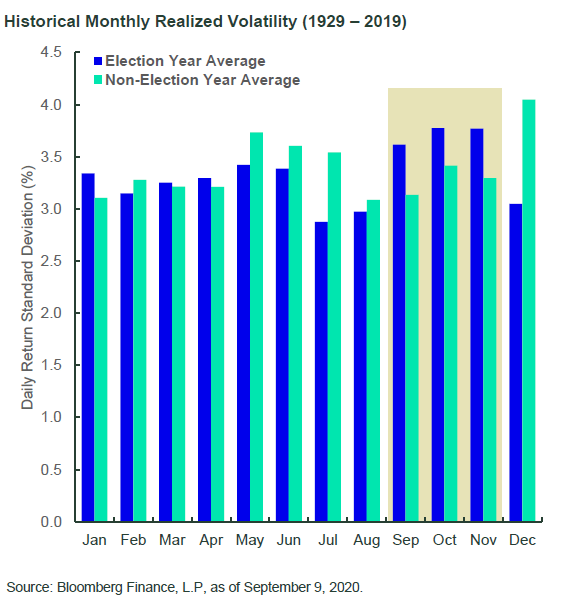
Let’s start with volatility (chart below). Taking a look back to 1929 you’ll see that the election year realized volatility exceeds non-election year volatility in September-November by a rather dramatic amount as measured by daily standard deviation in returns. I can’t say whether the current September 2020  volatility is caused or simply correlated to this phenomena. With U.S. stocks down over 7% 9/1-9/23 there’s plenty going on in the world to not simply chalk this up to election hysteria.

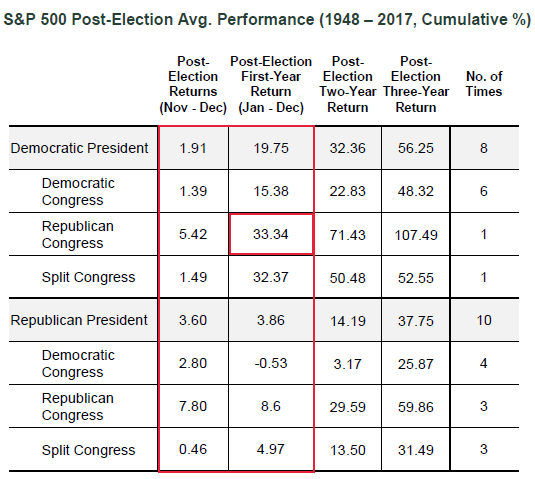
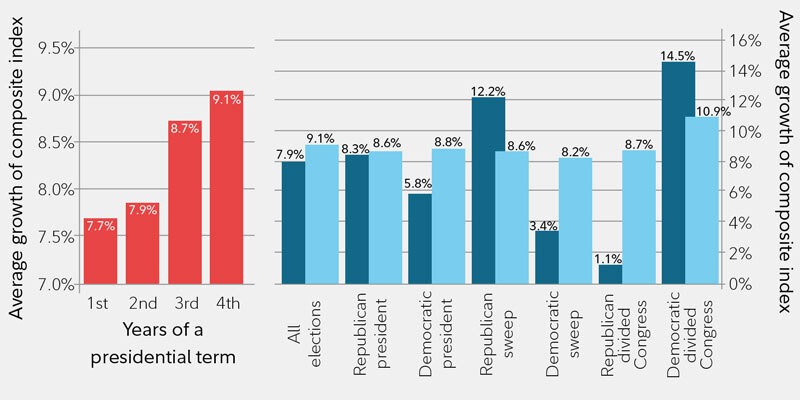
Now that volatility is out of the way, let’s talk returns, starting with short term returns. It is abundantly clear what investors prefer, and it isn’t what you’d think. The President is less significant than the balance of power. Returns tend to be best with a split congress, or in the best performing case a Democrat for President with a Republican congress. Why might that be? Gridlock. Investors love the status quo, but more so corporations love the predictability that comes with it. The ability to invest, forecast, and produce without the prospects of a changing playing field often lends itself to unimpeded growth.

We all learned in 2016 that polling is VERY fallible. Here we find ourselves again with a rapidly changing landscape of polling results, and most of which seem to be consolidating into the margin for error. Meaning both the Presidential and the Congressional races can go any which way. If we were betting, we’d likely expect a blue wave (Biden win and Democrats take over the Senate). Most of this is because incumbents just simply don’t win while in a recession, it’s only happened once in the last 100 years. The bad news, a Democratic sweep is actually one of the worst outcomes for investment markets historically over the corresponding 2 years (blue below) post election. The good news, you can barely tell a difference after 4 years (light blue below) regardless of who is in office, Presidential or Congressional.

Source: FMRCo

So what do we do now? Proceed with caution. Obviously this election is unparalleled in so many ways, and because of that we can’t solely rely on historical data to give us permission to proceed with blinders on. Having said that, you can make a bullish case for U.S. and Global securities regardless of who wins. What types of companies and which geographies you favor might look very different however. Each party has a different impact on tax code, currency stability, trade relations, etc. It’s important to construct your portfolio with these varied outcomes in mind and not be married to one outcome to succeed.

If you want to review your current investment posture as we head toward the stretch of election season 2020, please don’t hesitate to reach out to our team.

Blake Street, CFA, CFP®

Wealth Advisor, Warren Street Wealth Advisors

Investment Advisor Representative, Warren Street Wealth Advisors, LLC., a Registered Investment Advisor

The information presented here represents opinions and is not meant as personal or actionable advice to any individual, corporation, or other entity. Any investments discussed carry unique risks and should be carefully considered and reviewed by you and your financial professional. Nothing in this document is a solicitation to buy or sell any securities, or an attempt to furnish personal investment advice. Warren Street Wealth Advisors may own securities referenced in this document. Due to the static nature of content, securities held may change over time and current trades may be contrary to outdated publications. Form ADV available upon request 714-876-6200.