• Who We Serve
    • Business Owners
    • Individuals & Families
    • Fortune 500 and Large Company Employees
    • New Media
    • Oil & Gas Industry
    • SoCal Edison
  • Services
    • Financial Planning & Retirement
    • Investment Management
    • Tax Planning & Preparation
    • Estate Planning
  • About Us
  • Resources
    • Blog
    • Events
      • Health & Wealth
    • Frequently Asked Questions
  • Partnerships
    • Next Street Tax
    • TownSquare Capital
  • Contact Us
  • Schedule
    • New Clients
    • Current Clients
  • Login
  • Menu Menu

Tag Archive for: Investment

Navigating Health Insurance Enrollment Season

September 24, 2026/in Education, Financial Planning, General, Retirement/by Emily Balmages, CFP®

As summer winds down and autumn kicks into gear, financial decision-making is probably not top of mind. You may be more accustomed to planning around deadlines such as Dec. 31 or April 15. But fall is an important time to take a fresh look at your health insurance. 

For Affordable Care Act (ACA) Marketplace plans, open enrollment runs from Nov. 1 through Dec. 15 for coverage beginning Jan. 1. Miss that window and you can still choose a plan until Jan. 15, but your coverage won’t start until Feb. 1. Meanwhile, employer plans have their own enrollment periods, which may occur at different times, but frequently in the fall as well. 

Faced with a long list of plans and prices, it can be tempting to stick with the devil you know and re-enroll in your current plan—done! But plan details change every year, and so do your needs. Consider taking a few minutes to review the options available. Here are some things to keep in mind.

Considering Total Annual Costs

A common mistake when choosing a health insurance plan is basing the decision solely on the monthly premium. That’s understandable: The premium is a bill—or a deduction from your paycheck—you need to pay every month, even if you only see a doctor once a year for a checkup. But your actual costs may depend on several factors. Consider also:

  • The deductible. What you generally pay for covered healthcare services before your insurance begins to pay. Some services may be covered before you meet the deductible. A higher deductible often comes with a lower monthly premium.
  • Copays. A fixed amount you pay for a covered healthcare service, such as a doctor’s visit or prescription. Specialist visits can cost more than visits to your primary care physician. 
  • Coinsurance. The percentage of the cost of a covered service that you pay after meeting your deductible.
  • Doctor and hospital networks. Insurers contract with providers in their networks to negotiate prices. Out-of-network visits can cost more—or may not be covered at all. Make sure your preferred doctors are in the plan’s network.
  • Out-of-pocket maximum. The most you’ll pay during a plan year for covered, in-network healthcare services. Your out-of-pocket maximum is frequently higher than your deductible. Once you reach the limit, your plan generally pays 100% of the cost of covered, in-network services for the rest of the plan year. Premiums, out-of-network care and services the plan doesn’t cover generally don’t count toward the limit. 
  • Prescription-drug coverage. Plans have lists of covered drugs, known as formularies. Prescription costs usually have their own copays and coinsurance, depending on the drug’s “tier” or price level. If you take regular medications, make sure they’re covered by the plan.
  • HSA eligibility. Health Savings Accounts are tax-advantaged accounts that let you save, grow and spend money tax-free for qualified medical expenses. However, they generally must be paired with a high-deductible health plan. That said, certain Bronze and Catastrophic Marketplace plans are now considered as HSA-compatible under IRS rules.

Ultimately, choosing a plan is a balancing act: weighing the up-front premium against potential medical expenses down the road. If you’re young and in good health, a high-deductible plan with a lower premium might make sense, given the statistical likelihood that you won’t need major medical care in a given year.

But someone with ongoing healthcare needs might be better off paying a higher monthly premium in exchange for a lower deductible and out-of-pocket maximum. A plan with a $500 monthly premium is cheaper than one costing $750 until you have a medical emergency—and find yourself facing a daunting pile of healthcare bills.

Changing Plans Midstream: Special Considerations

America’s employer-based health insurance system can leave people uncovered during job transitions, prompting special exceptions to the open enrollment period. Under COBRA, you can continue coverage on your previous employer’s plan for a limited time—but you’ll pay the full monthly premium plus a 2% administrative fee because your former employer no longer contributes its share.

For many people, another option is buying a plan through the ACA Marketplace. Losing employer-based health coverage generally triggers a special enrollment period, giving you 60 days after losing coverage to enroll. In many cases, you can also enroll during the 60 days before your coverage ends. When your new employer-sponsored insurance begins, you can cancel the Marketplace plan—or you may decide it’s better than the plan offered at work, especially if you qualify for a subsidy. 

If you’re applying for a subsidy, be sure to factor in your total income from both jobs when estimating your eligibility. If your actual income is higher than estimated, you could receive more financial assistance than you’re ultimately eligible for, so you may have to repay the full difference when you file your federal tax return. 

Also, speaking of owing the government money: If you’re joining a new employer’s plan that automatically contributes to a health savings account (HSA), make sure those contributions, plus any previous HSA contributions you made this year, won’t push you over the annual contribution limit. In 2026, the annual contribution limit for HSAs for an individual with self-only coverage is $4,400 and $8,750 for family coverage. These limits apply to total contributions across all your HSA accounts. If you’re married, family HSA limits apply to spouses’ combined accounts. 

A Yearly Checkup for Your Health Coverage

Open enrollment gives you a chance to make sure your health insurance still fits your needs. Take time to compare premiums, deductibles, provider networks, prescription coverage and potential out-of-pocket costs before making a decision. This can be a lot of work. But we’re here to help. Reach out if you need help evaluating how your options fit into your budget or broader financial plan.

Emily Balmages, CFP®

Director of Financial Planning, Warren Street Wealth Advisors

Investment Advisor Representative, Warren Street Wealth Advisors, LLC., a Registered Investment Advisor

The information presented here represents opinions and is not meant as personal or actionable advice to any individual, corporation, or other entity. Any investments discussed carry unique risks and should be carefully considered and reviewed by you and your financial professional. Nothing in this document is a solicitation to buy or sell any securities, or an attempt to furnish personal investment advice. Warren Street Wealth Advisors may own securities referenced in this document. Due to the static nature of content, securities held may change over time and current trades may be contrary to outdated publications. Form ADV available upon request 714-876-6200.
https://warrenstreetwealth.com/wp-content/uploads/2026/09/Navigating-Health-Insurance-Enrollment-Season-Banner.png 941 1672 Emily Balmages, CFP® https://warrenstreetwealth.com/wp-content/uploads/2014/11/Warren_Street_logo-01.svg Emily Balmages, CFP®2026-09-24 15:20:502026-09-24 15:20:56Navigating Health Insurance Enrollment Season

5% and Counting: Is the US Treasury Back?

September 15, 2026/in Investing/by Phillip Law, CFA

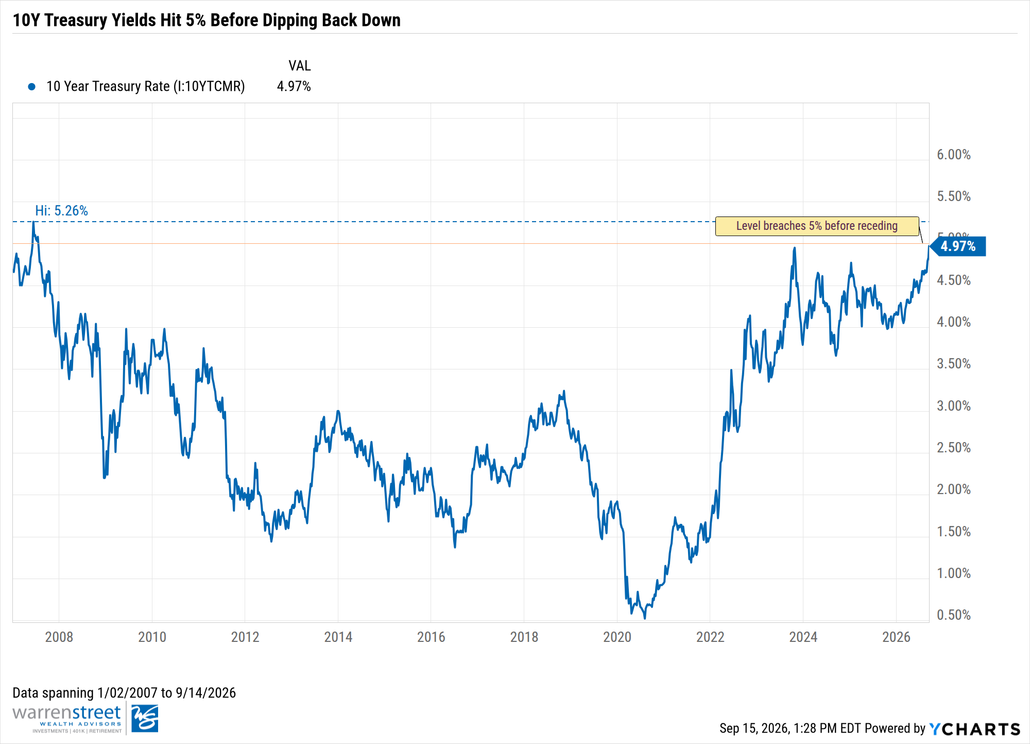
One of the most prominent headlines in financial media today surrounds a less sexy asset class: US government bonds (a.k.a. Treasuries). Think about a Treasury as an IOU where you’re loaning money to the US government, with the goal of collecting interest and principal. More recently, yields on the 10-Year US Treasury have breached 5% – a key threshold that influencers and journalists are touting as “critical level” for risk assets. So what’s genuinely pushing these yields higher, and what do we make of it?

While the 5% level is the highest we’ve seen in nearly 20 years, rates only become truly restrictive when an economy isn’t growing, the private sector is already overleveraged, and resources sit underutilized. None of that describes the US’ position today, but the timing of this surge does feel eerie (alongside conversations around AI doom), linked to a myriad of factors:

  • Fed credibility → Central bank credibility has been a lingering concern since President Trump’s public feud with former Fed Chair Jerome Powell, and newly appointed Chair Kevin Warsh’s shaky press conferences didn’t help. Fortunately, Warsh was able to calm market nerves recently by committing more durably to the Fed’s inflation mandate, even if it means raising short-term interest rates.
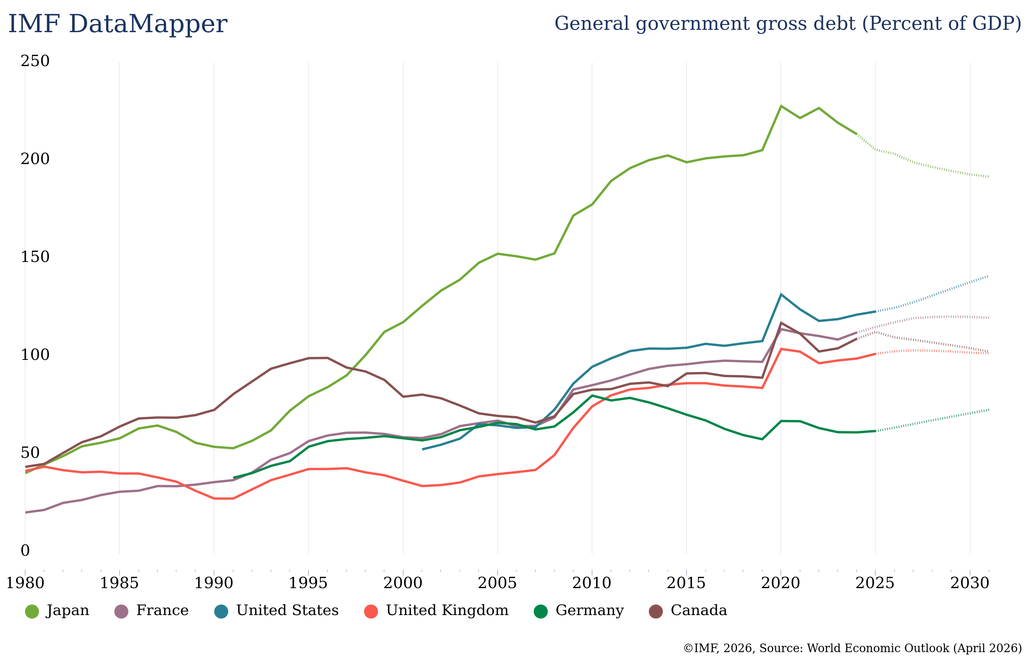
  • Fiscal Debt Sustainability → US Debt levels are high, something we share with other developed nations. While we believe that Treasuries remain the cleanest dirty shirt in the hamper (amongst the debt of other nations), persistent deficits and associated interest expense do raise concerns around long-term fiscal sustainability.
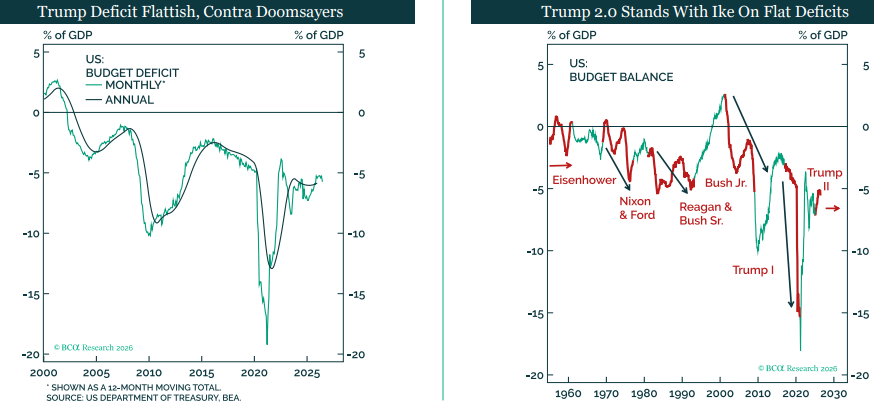
    • What’s overlooked is that the rate of deficit growth is surprising to the downside. Higher bond yields and political pushback have capped government spending to an extent. Yes, absolute debt levels are high, but given that markets are about rate of change and surprises, could investors be overindexing on absolute debt levels as a cause?
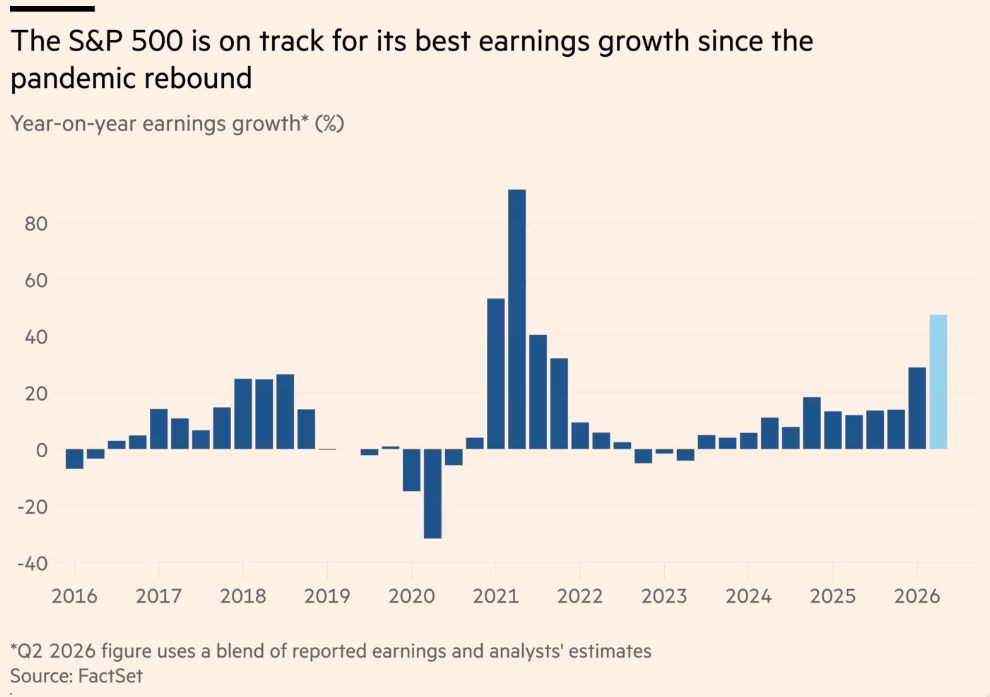
  • Real (Strong) Growth → Strong economic growth naturally commands higher yields since investors have more attractive places to put their capital. Nominal GDP is outpacing cost of borrowing per BCA Research, manufacturing and services activity are in expansionary territory, and corporate profits are on a tear (the S&P 500 reported a whopping ~50% year-over-year (YoY) earnings growth last quarter).
  • Foreigners (not) Fleeing Treasuries– while there’s been some rebalancing across international balance sheets (to fund national security interests or to rotate into other US bond instruments), we have yet to observe a widespread pullback from Treasuries on international balance sheets or an increase in the pace of selling.
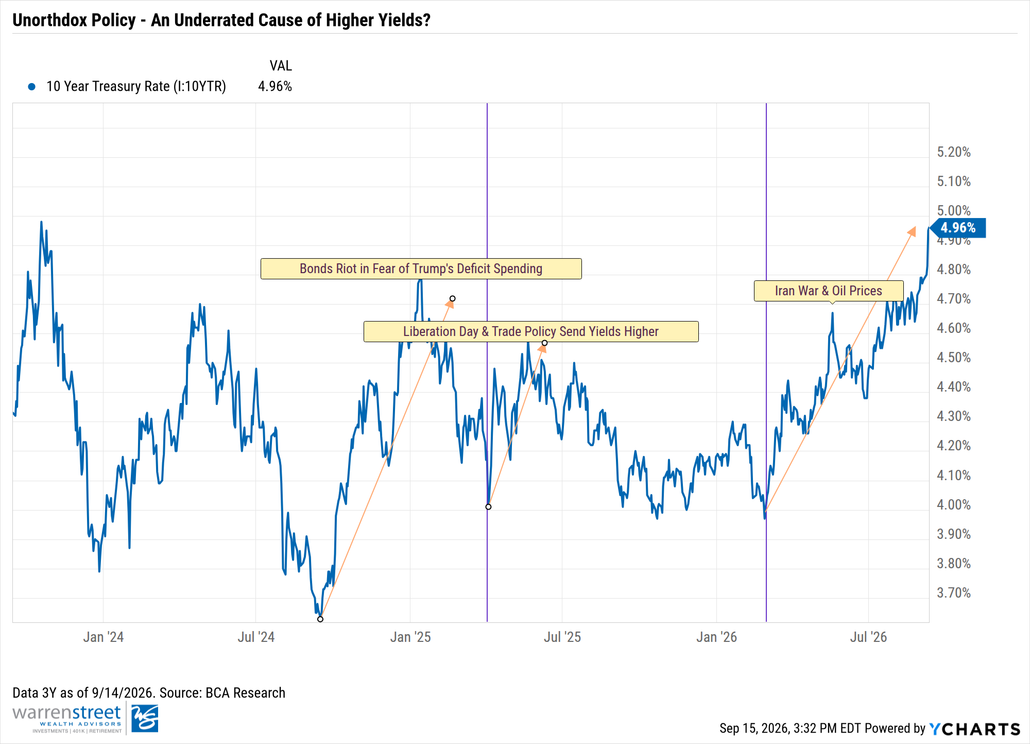
  • Unorthodox Fiscal Policy→ you’ll notice we didn’t list inflation as a primary contributor. While inflation is definitely a driver, we believe unorthodox fiscal policy with idiosyncratic impacts on global supply chains is a more relevant culprit. Be it trade wars and forced reshorting of supply chains or waging war against our largest enemy in the middle east (next to a critical resource chokepoint), these instances have resulted in higher prices and driven yields upwards. A more stable policy path could ease both.
  • New Competition for Capital→ AI Hyperscalers like Google are issuing debt to fund AI buildouts – forcing Treasuries to face real competition for investor dollars. 

Investment Implications:

What About for Stocks?

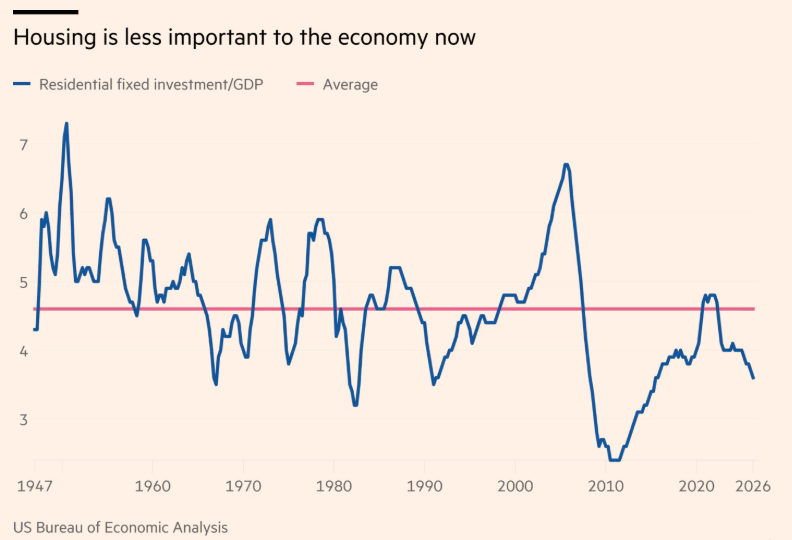
The classic worry is that higher yields suppress stock returns by making borrowing more expensive for home ownership and corporations, while also creating a more attractive entry point for bonds and thus pulling money out of equities. We’ve yet to see that happen. Housing was already soft to begin with, and AI-debt has been rate-insensitive throughout the AI buildout (which also supports the economy through hiring of roofers, electricians, and HVAC teams). Real economic growth estimates for 2026 remain around 2.0% across major institutions.

Meanwhile, the relative value trade-off between stocks and bonds have yet to force a rotation, especially if profit growth across corporate America continues to hold strong (expected to be 28.8% YoY for Q3 2026). The catalyst could be lying in wait, but as of this publication, strong fundamentals have yet to fully curve equity appetites.

What About Treasuries in a Portfolio?

Personally, I believe there’s reasons to be excited to be a bond investor today. Bonds have always played a core role in a portfolio: capital preservation and income generation. Now, longer term bonds can deliver income above inflation, cushion against downside, and diversify against equity risk.


There may be more volatility ahead – especially if the Iran war escalates or if Washington sends confusing signals ($5,000 GOP Checks?), but the US government is finally paying you to hold its debt. Yes, Washington’s balance sheet has its flaws, but global sovereign debt is a relative game. If the world gets messy, I’d feel more at home (no pun intended) owning income-producing US treasuries – backed by the taxing authority of the world’s strongest superpower and the world’s most liquid market – compared to other sovereign debt.

Phillip Law, CFA

Phillip Law, CFA

Senior Portfolio Manager

Warren Street Wealth Advisors, LLC., a Registered Investment Advisor

The information presented here represents opinions and is not meant as personal or actionable advice to any individual, corporation, or other entity. Any investments discussed carry unique risks and should be carefully considered and reviewed by you and your financial professional. Nothing in this document is a solicitation to buy or sell any securities, or an attempt to furnish personal investment advice. Warren Street Wealth Advisors and/or its clients may hold positions in the securities mentioned. Holdings may change at any time without notice. Due to the static nature of content, securities held may change over time and current trades may be contrary to outdated publications. Form ADV available upon request 714-876-6200.
https://warrenstreetwealth.com/wp-content/uploads/2026/09/Blog-Thumbnail.png 1080 1080 Phillip Law, CFA https://warrenstreetwealth.com/wp-content/uploads/2014/11/Warren_Street_logo-01.svg Phillip Law, CFA2026-09-15 15:30:042026-09-15 16:29:365% and Counting: Is the US Treasury Back?

Beyond the Magnificent Seven: A 2026 Midyear Check-In

July 29, 2026/in Investing/by Phillip Law, CFA

Back in January, we published our 2026 Outlook under the title “Beyond AI & Mega-Cap Tech.” Our argument was simple: real diversification was working and could add value beyond the AI trade which was concentrated to a handful of household names (namely the Magnificent Seven, which includes Microsoft, Amazon, and other big tech names). Six months later, we observe that the AI trade has indeed packed its bag, picked up a passport, and traveled to other asset categories including small caps and emerging markets.

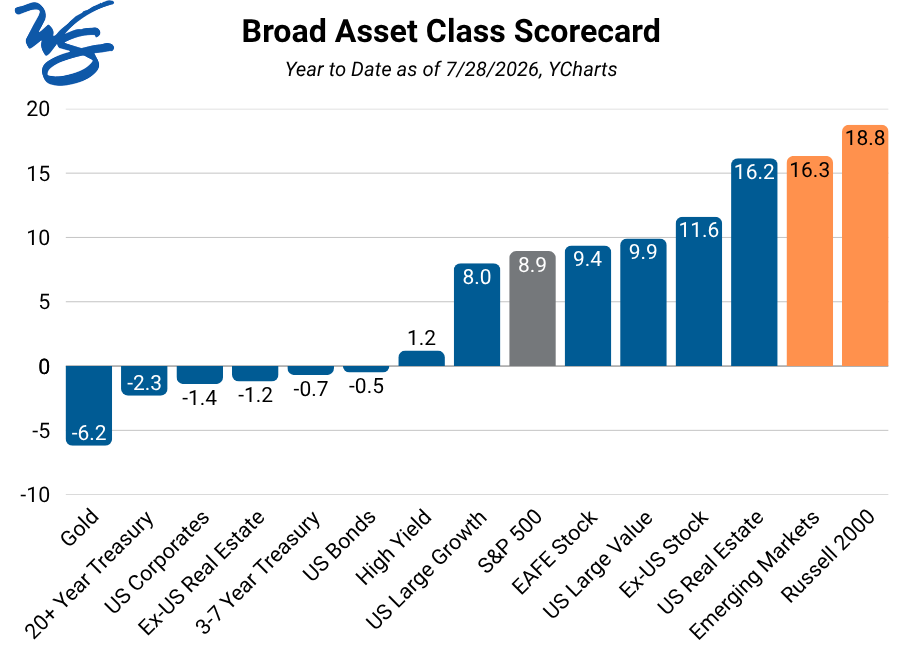
As of late July, small caps and emerging markets are leading the pack. The Russell 2000 (small cap index) is up 18.8% year-to-date while emerging markets 16.3% — all outpacing the S&P 500’s respectable 8.9%. Investors rotated into other corners of the same AI story, with small caps and EM carrying their own AI-adjacent demand related to chips, data centers, and power. 

The AI Trade, Domestically: Rotated, But With More Vulnerability

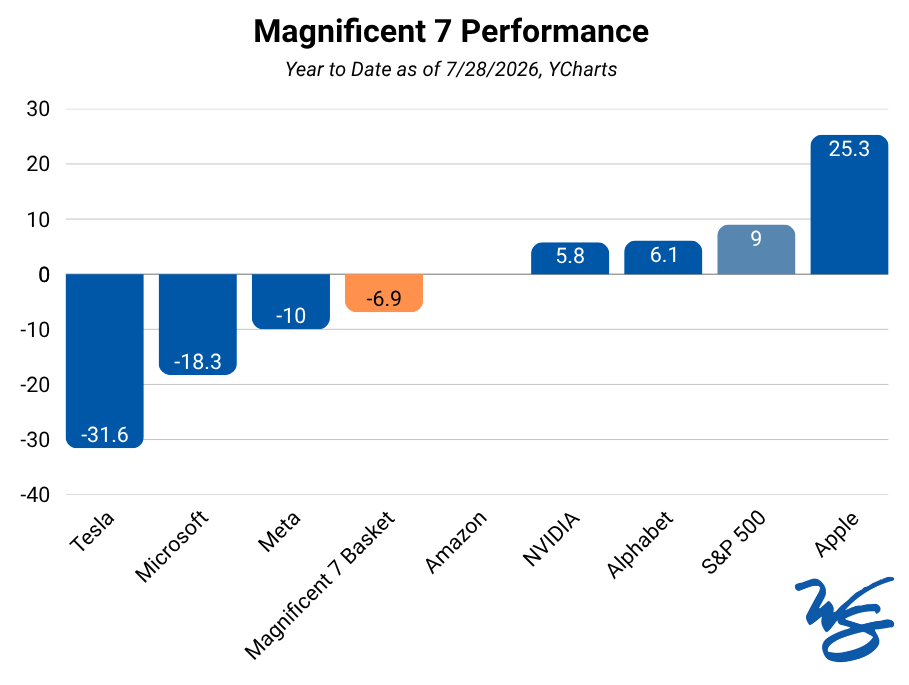
The Magnificent Seven, as a basket, is down 6.9% year-to-date. Hyperscalers (i.e., the biggest spenders on AI infrastructure) including Microsoft (-18.3%), Meta (-10%), and Amazon have struggled in 2026. Only Apple (+25.3%), Alphabet (+6.1%), and Nvidia (+5.8%) are green — and none are this year’s real winners in tech.

That title belongs to the memory and storage names behind the AI buildout: Micron and other chip manufacturers (i.e., CPUs, Memory, etc) are leading the trade, even after “taking a breath” off early-summer highs. Data center demand for memory has minted bigger winners than the household names that started the AI story.

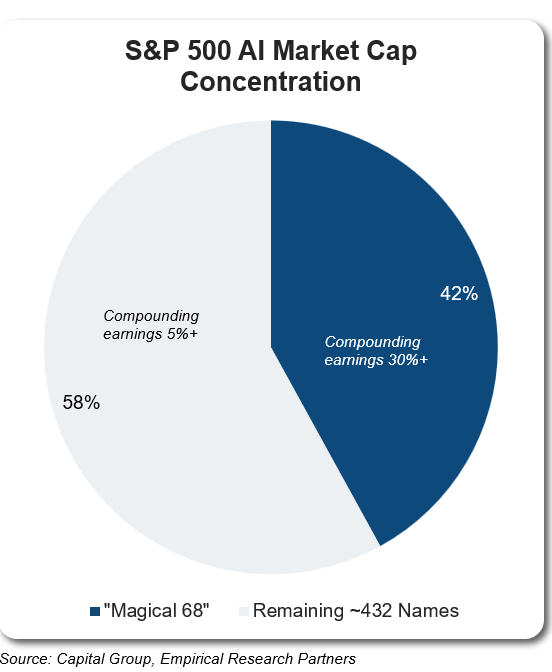
Research cited by Capital Group and Empirical Research Partners shows 68 AI-linked stocks (a.k.a. “Magical 68”) now make up 42% of the S&P 500’s market cap and are compounding earnings north of 30% vs. roughly 5%+ for non-AI stocks – evidence that backlogs are being structurally rewritten to meet supply-constrained demand. In fact, the semiconductors industry alone has also grown from roughly 6–7% of the index three years ago to nearly 20% today.

The bigger question remains whether that demand holds up. Chips are being sold into datacenters built for AI service demands assumed to keep compounding for years – a slowdown, or is absorbed faster than expected – today’s earnings – and the valuations riding on them – could reprice just as fast as they arrived. 

The AI Trade, Internationally: Same Movie, Different Language

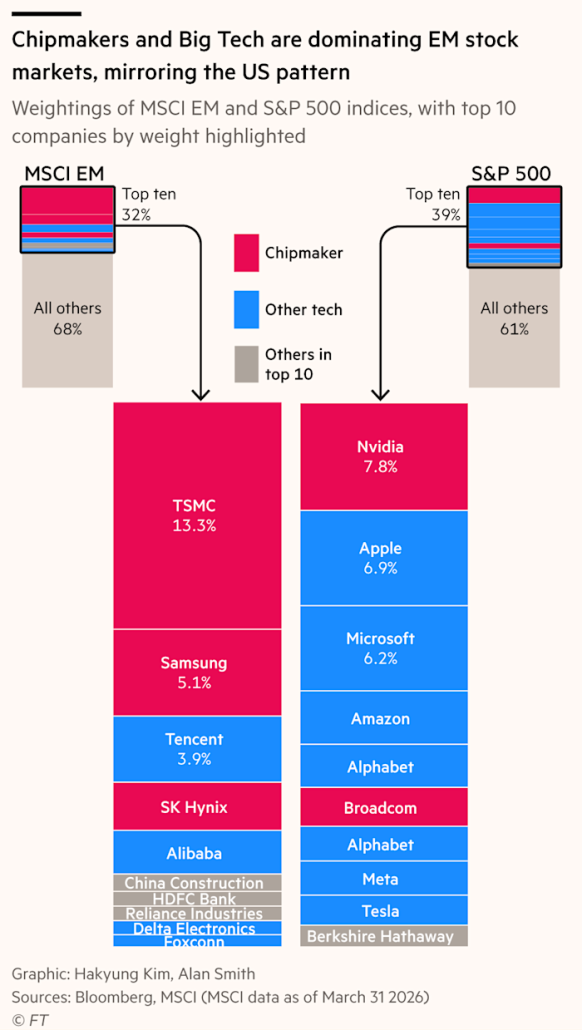
Emerging markets caught the same bug. The MSCI EM Index — up 16% YTD — now carries a heavier tech weighting than the S&P 500, essentially making EM an AI trade. Investors adding EM for diversification may just be buying semiconductors or memory chips in a different currency.

It’s worth noting that EM’s recent outperformance traces back to a handful of AI-linked chip names. Taiwan and South Korea now make up roughly 45% of the benchmark — nearly double their weight a year ago, and above the dot-com peak. Taiwan’s market cap alone exceeds China’s, despite an economy a fraction of the size, with forward earnings (i.e., market cap to cash earnings) running several standard deviations above trend. Put plainly, the diversification benefit of market-cap weighted EM is thinner than it once was and is linked to the fragility of the AI supply chain.

Kevin Warsh and the Inflation Watch

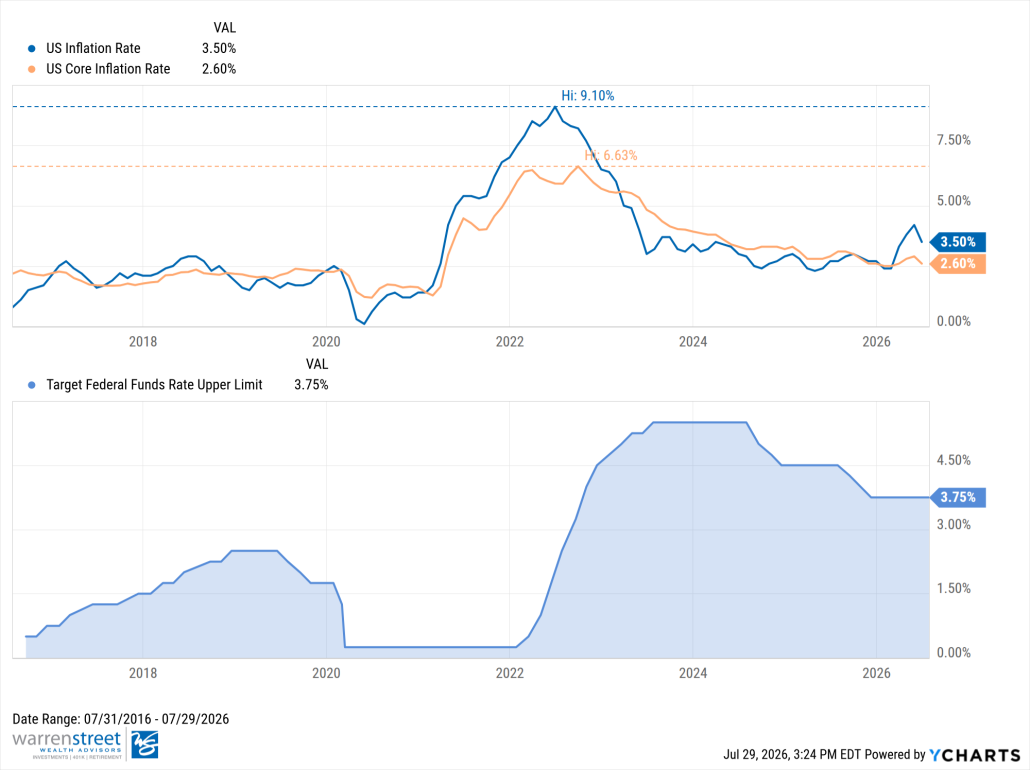
Inflation is sending mixed signals, with core prices (excluding food and energy) running near 2.5%, but the headline number — what you actually feel at the pump and grocery store — is up 3.5% year-over-year due to tensions in the Middle East (the Federal Reserve’s target is ~2%). Consumer spending remains resilient and AI-related business investment is creeping into higher prices. Despite these pressures, cooling wage growth and anchored long-term inflation expectations make it less likely that this turns into a longer-lasting, demand-driven problem.

Kevin Warsh, the Fed’s new chair, wasted no time setting a firmer tone. At his first meeting, he scrapped the Fed’s usual forward guidance and signaled a tougher stance, holding rates steady while making clear that further rate hikes — not cuts — could be on the table. That represents a sizable shift from earlier this year, where markets expected two rate cuts; year; now they’re pricing in the possibility of an interest rate hike. 

There’s a less obvious ripple effect worth knowing about: the AI boom is increasingly funded by borrowed money, not just cash on hand. Big tech companies have issued roughly $130 billion in bonds so far this year to fund AI infrastructure, already surpassing all of last year’s total, with the broader AI debt market on track to exceed $500 billion in 2026. If interest rates rise, that borrowing gets more expensive — which could eventually squeeze the profits and stock valuations behind the AI trade that’s driven so much of the market’s gains.

Investment Implications

We recognize the risks building in the AI ecosystem, but the technology remains genuinely transformative, with substantial earnings potential and runway left in the build-out. Rather than timing an exit from one of the market’s most powerful themes, we’ve repositioned equity exposure to manage these imbalances more deliberately.

On the U.S. side, we’ve paired core market-cap-weighted exposure with a Quality tilt (JQUA), favoring companies with stronger balance sheets, durable free cash flow, and healthy returns on equity. This is a more disciplined way to own the AI trade — capturing upside while screening out the accounting and accrual adjustments that can inflate earnings tied to the theme.

On the EM side, we’ve balanced our pure-growth exposure (XSOE) with a value- and income-oriented fund (EYLD), tilting toward cash-generative businesses focused on dividends, buybacks, and debt paydown. This preserves our exposure to developing-market growth while reducing sensitivity to EM’s biggest AI-related vulnerabilities over a multi-year horizon.

The AI story likely has room to run, but we expect turbulence as investors scrutinize return on investment, large language model providers limit token usage, and frontier-model competitors emerge (e.g., Kimi K3). We view these positioning shifts as a thoughtful way to stay invested in AI while diversifying risk and return within an increasingly concentrated market.

Phillip Law, CFA

Phillip Law, CFA

Senior Portfolio Manager

Warren Street Wealth Advisors, LLC., a Registered Investment Advisor

The information presented here represents opinions and is not meant as personal or actionable advice to any individual, corporation, or other entity. Any investments discussed carry unique risks and should be carefully considered and reviewed by you and your financial professional. Nothing in this document is a solicitation to buy or sell any securities, or an attempt to furnish personal investment advice. Warren Street Wealth Advisors and/or its clients may hold positions in the securities mentioned. Holdings may change at any time without notice. Due to the static nature of content, securities held may change over time and current trades may be contrary to outdated publications. Form ADV available upon request 714-876-6200.
https://warrenstreetwealth.com/wp-content/uploads/2026/07/Beyond-the-Magnificent-Seven-A-2026-Midyear-Check-In.png 1080 1080 Phillip Law, CFA https://warrenstreetwealth.com/wp-content/uploads/2014/11/Warren_Street_logo-01.svg Phillip Law, CFA2026-07-29 15:40:252026-07-30 10:30:31Beyond the Magnificent Seven: A 2026 Midyear Check-In

IPO Mania: What the Rocket Ships, Chatbots, and Rule Changes Mean for Your Portfolio

June 10, 2026/in Investing/by Phillip Law, CFA

The headlines are hard to miss. SpaceX. Anthropic. OpenAI. Three of the most talked-about private companies in history are preparing to go public — and together, they could raise more money in a matter of months than the entire U.S. IPO market raised all of last year. Today on the blog, we explore what to expect from the hottest Wall Street darlings and what these shiny objects mean for markets.


Let’s Set the Table

In 2025, the entire U.S. IPO market raised $77 billion. SpaceX alone is targeting a $75 billion raise — add Anthropic ($60–65 billion) and OpenAI ($60 billion), and you’re looking at a combined raise close to $200 billion.

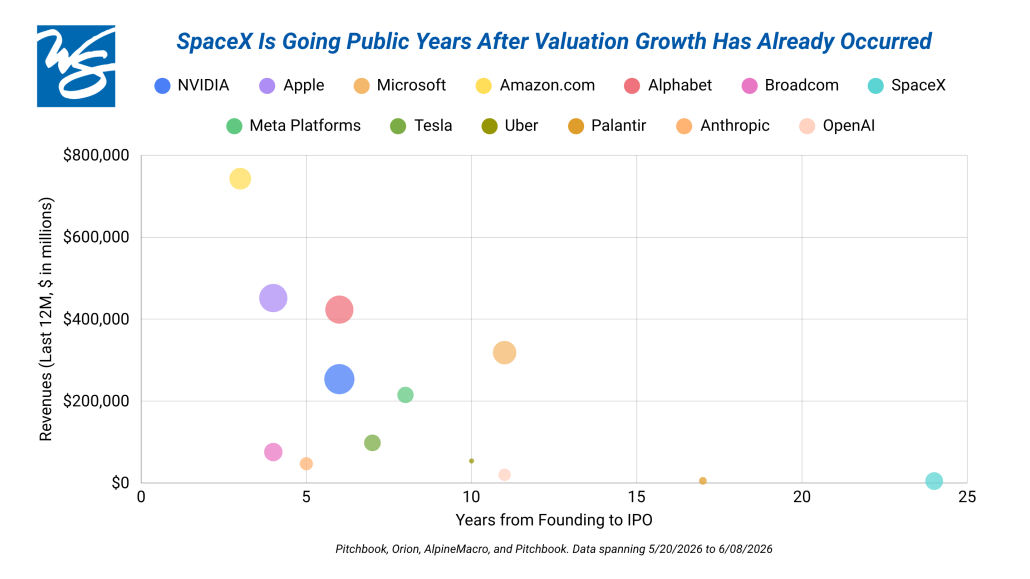
These are no longer the scrappy startups where early public investors get in on the ground floor. Much of the value has already been captured by venture capitalists and private investors. Before going public, SpaceX was reportedly valued at ~$1.25 trillion, Anthropic at ~$900 billion, and OpenAI at ~$825 billion — nearly $3 trillion in private market value accumulated behind the scenes. SpaceX here is the outlier, going public 24 years after inception as indicated by the turquoise bubble in the chart above.


Don’t Forget to Ask — Why Now?

I usually view IPOs with a skeptical eye – not because success stories can’t be made, but because an information asymmetry will permanently exist. Insiders can tell when the public is overpaying for their company and use it as an opportunity to cash out. So why go public now?

  1. These companies need cash. Building cutting-edge AI and sending rockets to space is extraordinarily expensive. Going public gives them a massive influx of capital to fund that growth.
  2. Early investors need an exit. Founders, employees, and early-stage investors have been waiting years to convert paper gains into real dollars. It’s also worth noting: history has eerie examples of companies timing public offerings around industry peaks — Blackstone before the 2008 real estate crisis, Glencore before the 2011 commodity cycle pop. Worth pausing a moment for.
  3. The market is excited. The AI investment environment has been exceptionally strong, recovering from the skepticism that characterized earlier this year.

What Comes After the Honeymoon?

IPOs are often explosive in the short-term — a honeymoon period followed by selling pressures where the relationship starts to go south. Here’s what to expect:

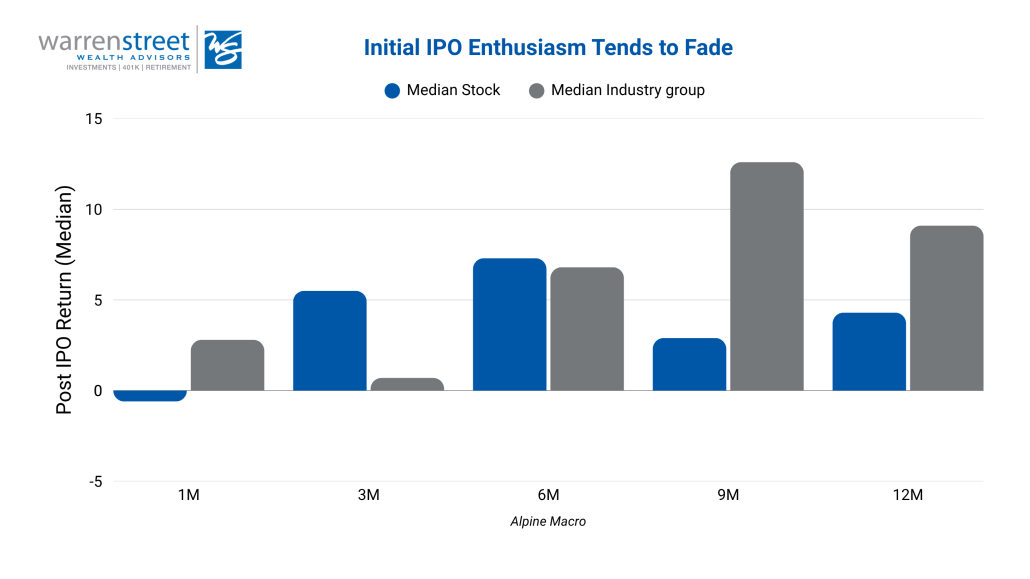
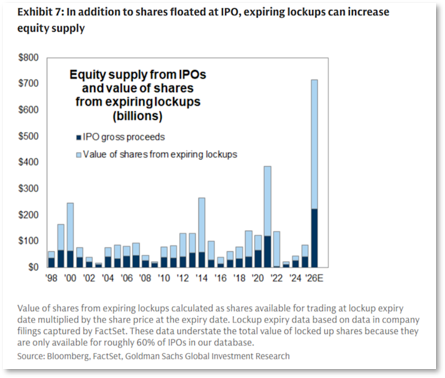
Short-term: Prices get a boost from engineered scarcity (companies deliberately underprice and limit tradable shares), retail enthusiasm and FOMO, and index fund buying — which could account for approximately 17–24% of tradable shares within the first 15 trading days, based on estimates from AlpineMacro.

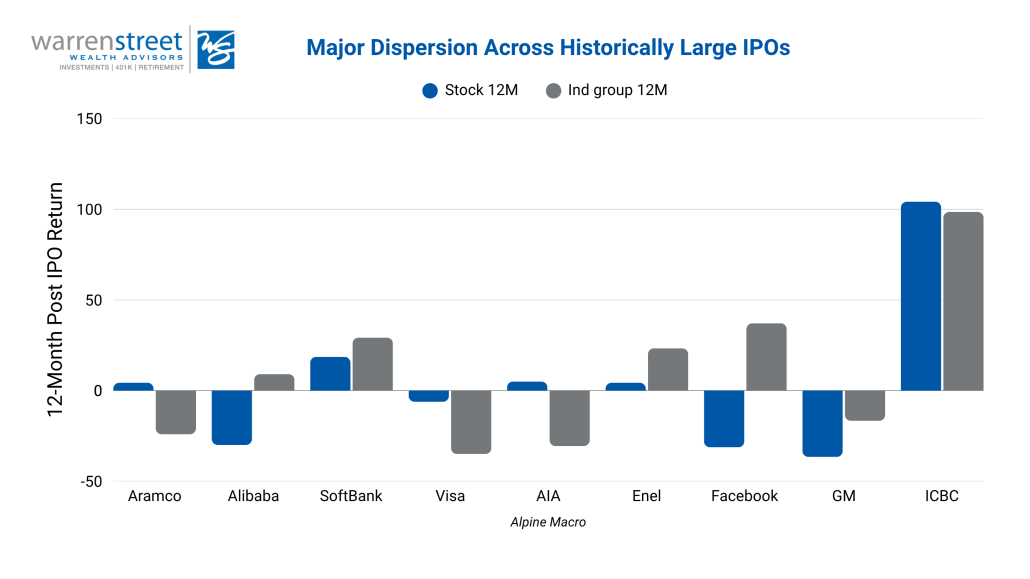
Medium-term: Here comes the reality-check. Lock-up expirations release insider shares onto the market, applying downward pressure on prices. This year, those lock-ups are unusually concentrated in adjacent AI and tech companies, introducing more fragility than prior cycles. It’s also worth noting that most IPO’s have underperformed their broader industry in the 12 months following launch, with gains often concentrating in only a small number of big winners while the rest disappoint. Past performance and historical trends are not indicative of future results.

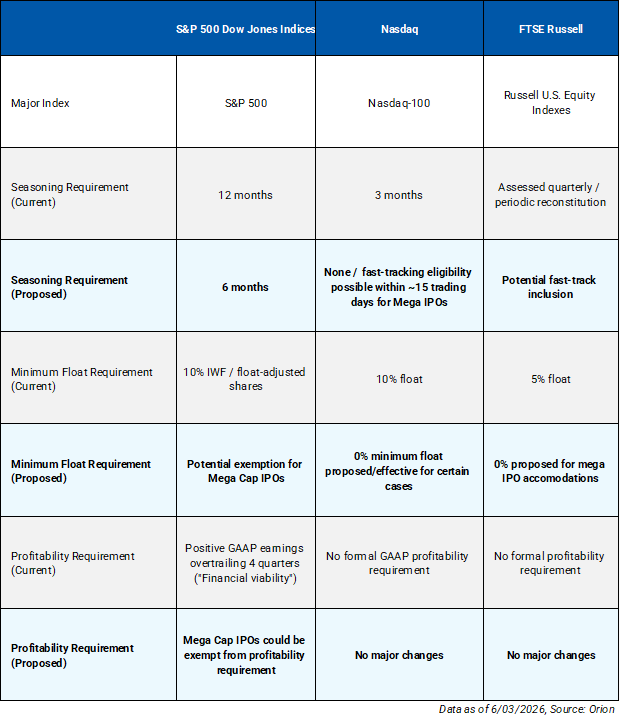
Longer-term — the Index Dilemma: Major index providers like S&P and Nasdaq are reportedly bending their own rules to fast-track these mega-IPOs into their benchmarks. Most consequentially, S&P is considering relaxing its profitability requirement. As these stocks join indexes and lock-ups expire, automated buying algorithms will be forced to fund those purchases by selling something else — most likely the largest, most liquid names: Apple, Microsoft, Nvidia.


Investment Implications

If these IPOs execute well, it’s a green light for the AI trade and would lift companies across the ecosystem. If they stumble, it’s a meaningful warning signal for anyone spending heavily without yet turning a profit.

We believe the index risk is the more underrated story. When index rules are bent to accommodate unprofitable companies, the passive investor is quietly exposed to degraded quality screens, less certain cash flow trajectories, and deeper AI concentration. It blurs the line between passive and active investing — and you have to ask yourself: what am I really owning?

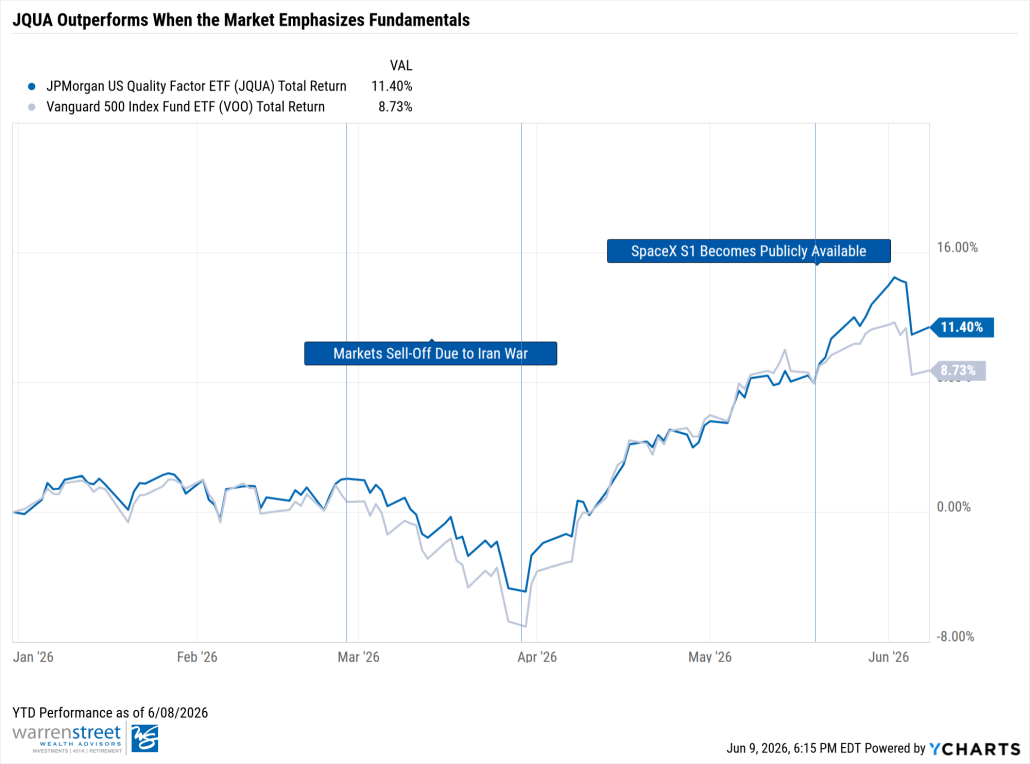
In this environment, we continue to rely on our pairing of market-Cap weighted S&P 500 exposure alongside quality-focused ETFs (for example, JQUA, the JPMorgan U.S. Quality Factor ETF), depending on client objectives and risk tolerance. JQUA generally focuses on companies with strong earnings, healthy balance sheets, high returns on equity, and manageable debt – qualities (no pun intended) meant to ground investments in fundamentals when narratives run ahead of numbers. We believe this approach may allow portfolios to participate broadly in market enthusiasm, depending on client objectives and risk tolerance.


Our Take

We recognize the excitement surrounding this IPO wave, but our role is to navigate these waves with discipline. While these are compelling names and future portfolio candidates across our fund managers, we believe the more prudent approach is to allow valuations to normalize, narratives to mature, and market expectations to recalibrate before committing capital. In other words, we are letting quality discipline and our understanding of IPO markets – not enthusiasm – guide your portfolio’s trajectory.

Phillip Law, CFA

Phillip Law, CFA

Senior Portfolio Manager

Warren Street Wealth Advisors, LLC., a Registered Investment Advisor

The information presented here represents opinions and is not meant as personal or actionable advice to any individual, corporation, or other entity. Any investments discussed carry unique risks and should be carefully considered and reviewed by you and your financial professional. Nothing in this document is a solicitation to buy or sell any securities, or an attempt to furnish personal investment advice. Warren Street Wealth Advisors and/or its clients may hold positions in the securities mentioned. Holdings may change at any time without notice. Due to the static nature of content, securities held may change over time and current trades may be contrary to outdated publications. Form ADV available upon request 714-876-6200.
https://warrenstreetwealth.com/wp-content/uploads/2026/06/IPO-Mania.png 1080 1080 Phillip Law, CFA https://warrenstreetwealth.com/wp-content/uploads/2014/11/Warren_Street_logo-01.svg Phillip Law, CFA2026-06-10 15:01:402026-07-29 15:50:00IPO Mania: What the Rocket Ships, Chatbots, and Rule Changes Mean for Your Portfolio

On the War in Iran: Do Markets Not Care, and What’s Next?

April 24, 2026/in Investing/by Phillip Law, CFA

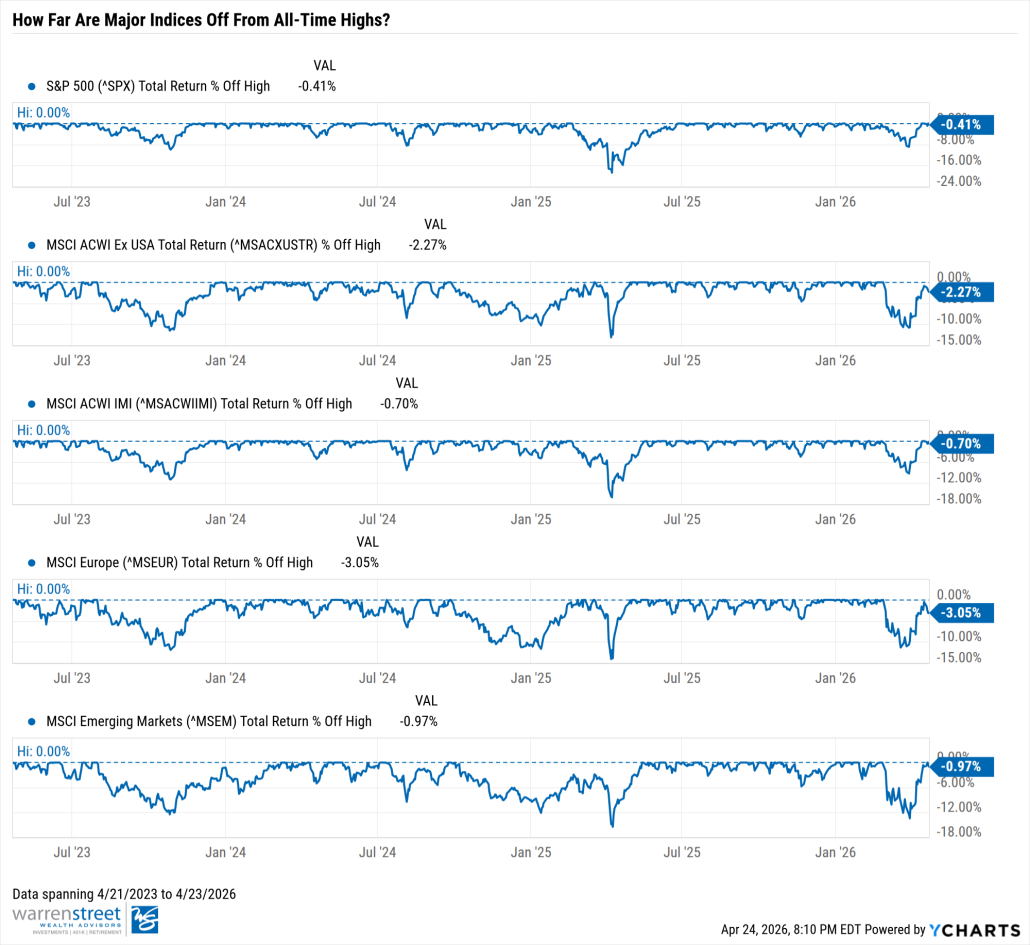
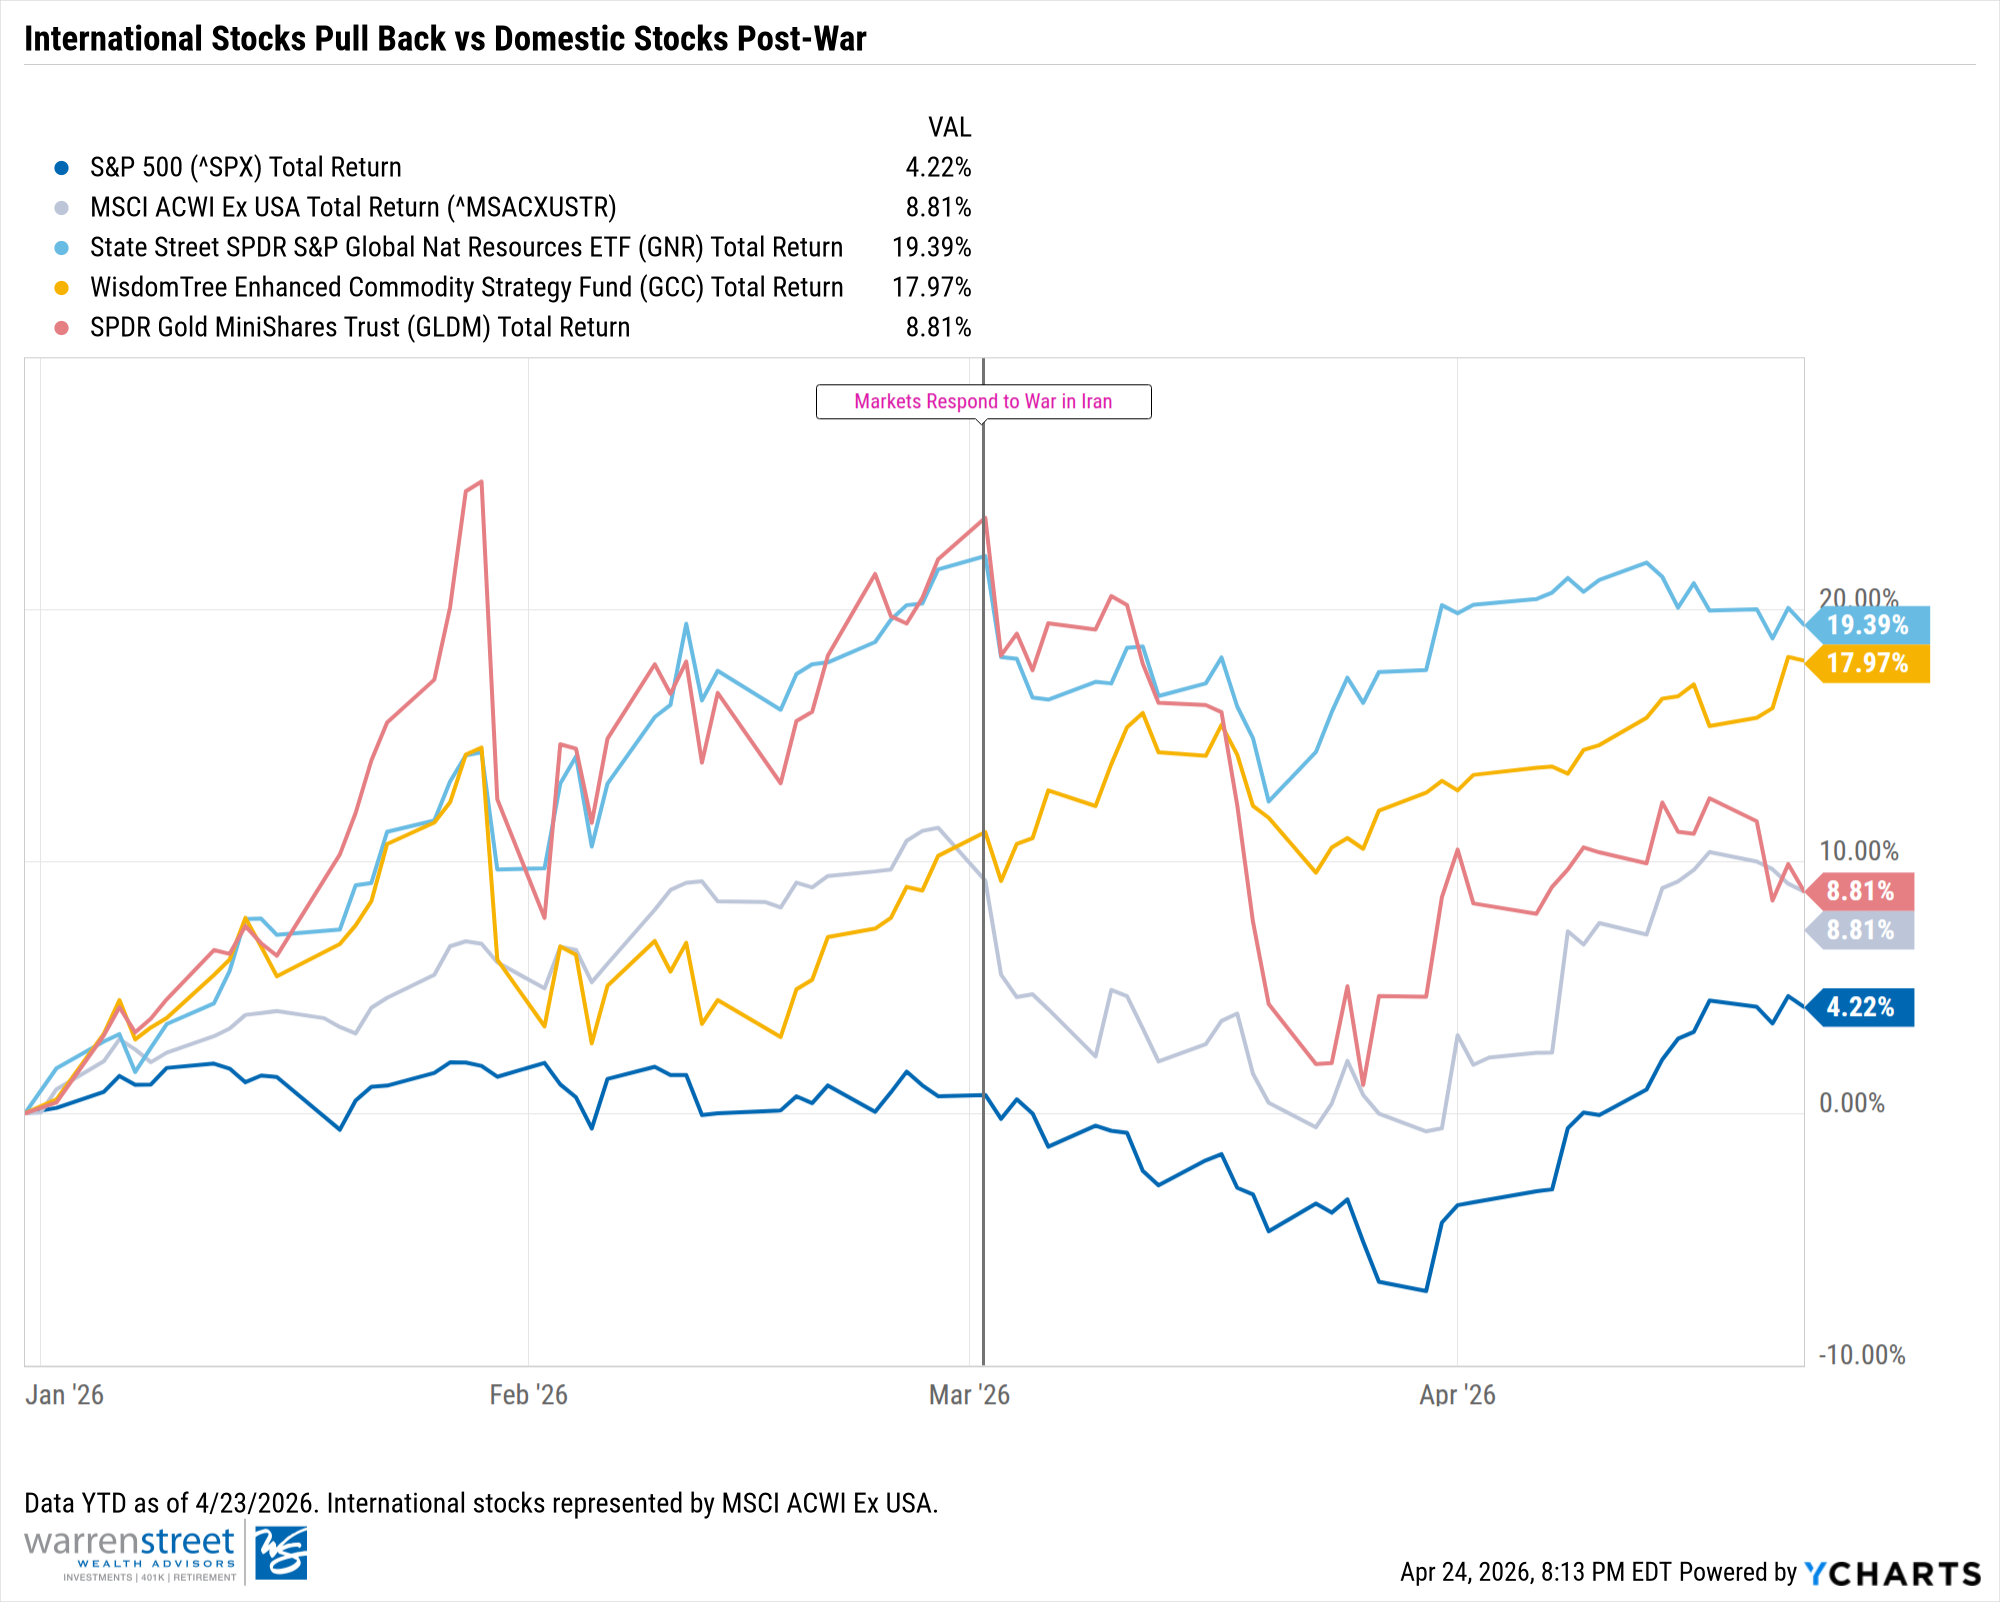
Last month, we emphasized the unpredictability of geopolitical risk and acknowledged its limited ability to depress longer-term returns. Today, we observe roughly 80 oil tankers stranded at sea, a supply shortfall of 9 million barrels per day, and a ceasefire so fragile that ships are still being bombarded. Yet, markets are hovering near all-time highs.

It seems as if markets have already asked, “Will this war matter in a year?” and answered “Probably not.” Are they correct to think that the worst is behind us, or are we seeing an irrational optimism? More importantly, how are we thinking and what are we doing about it?

Both Sides Are Boxed In

At first glance, it would seem that markets are celebrating the ceasefire. Instead, we believe they’re celebrating the constraints on both sides. Despite the current administration’s bravado on social media, the US is operating within real limits:

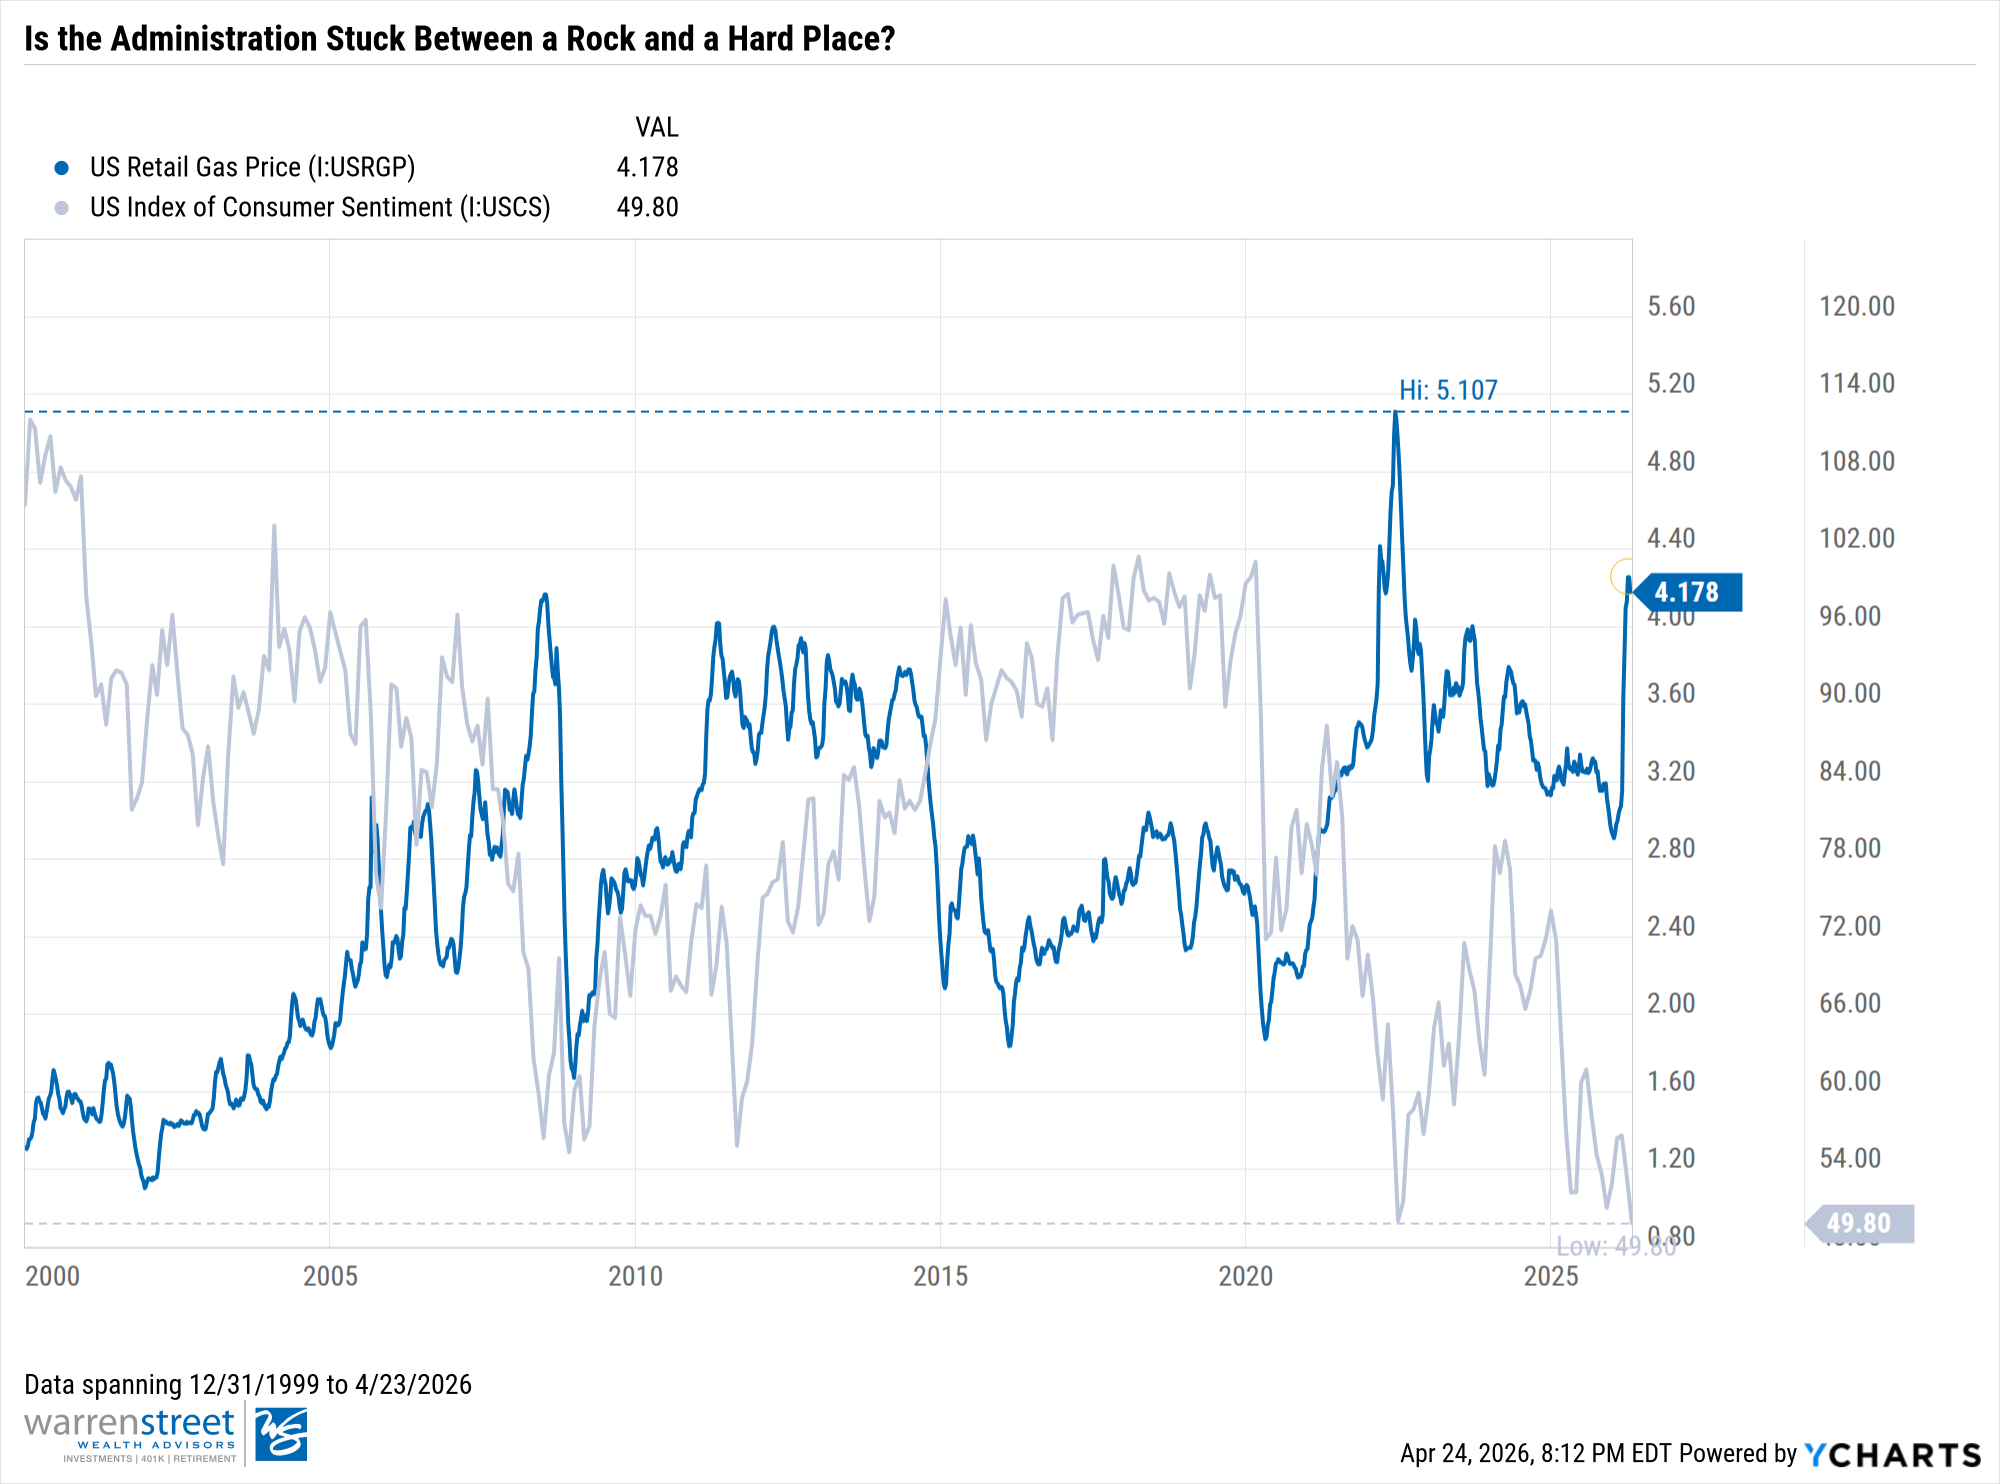
  • Gas prices are climbing into politically damaging territory.
  • We’ve burned through years of munitions stockpiles and missile interceptors — replenishing them adds to an already strained debt picture.
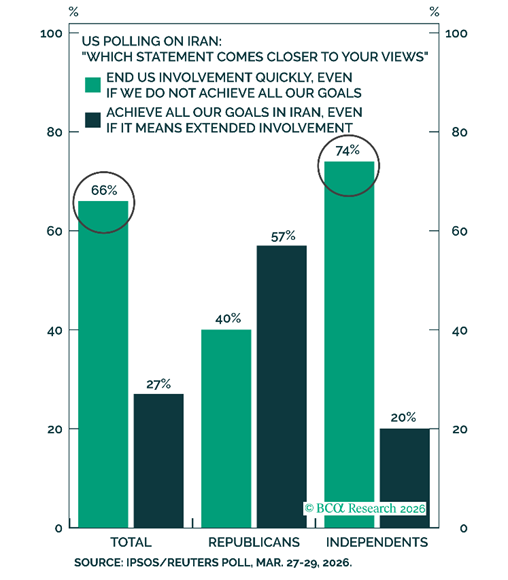
  • At the start of the war, only 53% of the public supported it, and support has only eroded from there. With the midterms approaching, this war is becoming a liability.

Iran’s position is also complicated:

  • Its arsenal is materially depleted, forcing more selective targeting.
  • Headline inflation is near 50%, causing social unrest that has spilled into the streets and warranted radical response.

Yes, the regime is exhibiting an unexpected tolerance for pain despite being under genuine strain. It has come to realize how powerful its leverage over the Strait of Hormuz is, but that leverage has a ceiling. If Iran pushes hard enough to tip the world into recession, the world could coalesce to force the Strait open.

At that point, nobody is negotiating with Tehran and will not care about its capitulation. Iran’s smarter play is subtler — agitate just enough to keep oil prices elevated, respect the ceasefire to the bare minimum, and let the pressure build on Trump’s midterm prospects.

Where Are We in the Playbook?

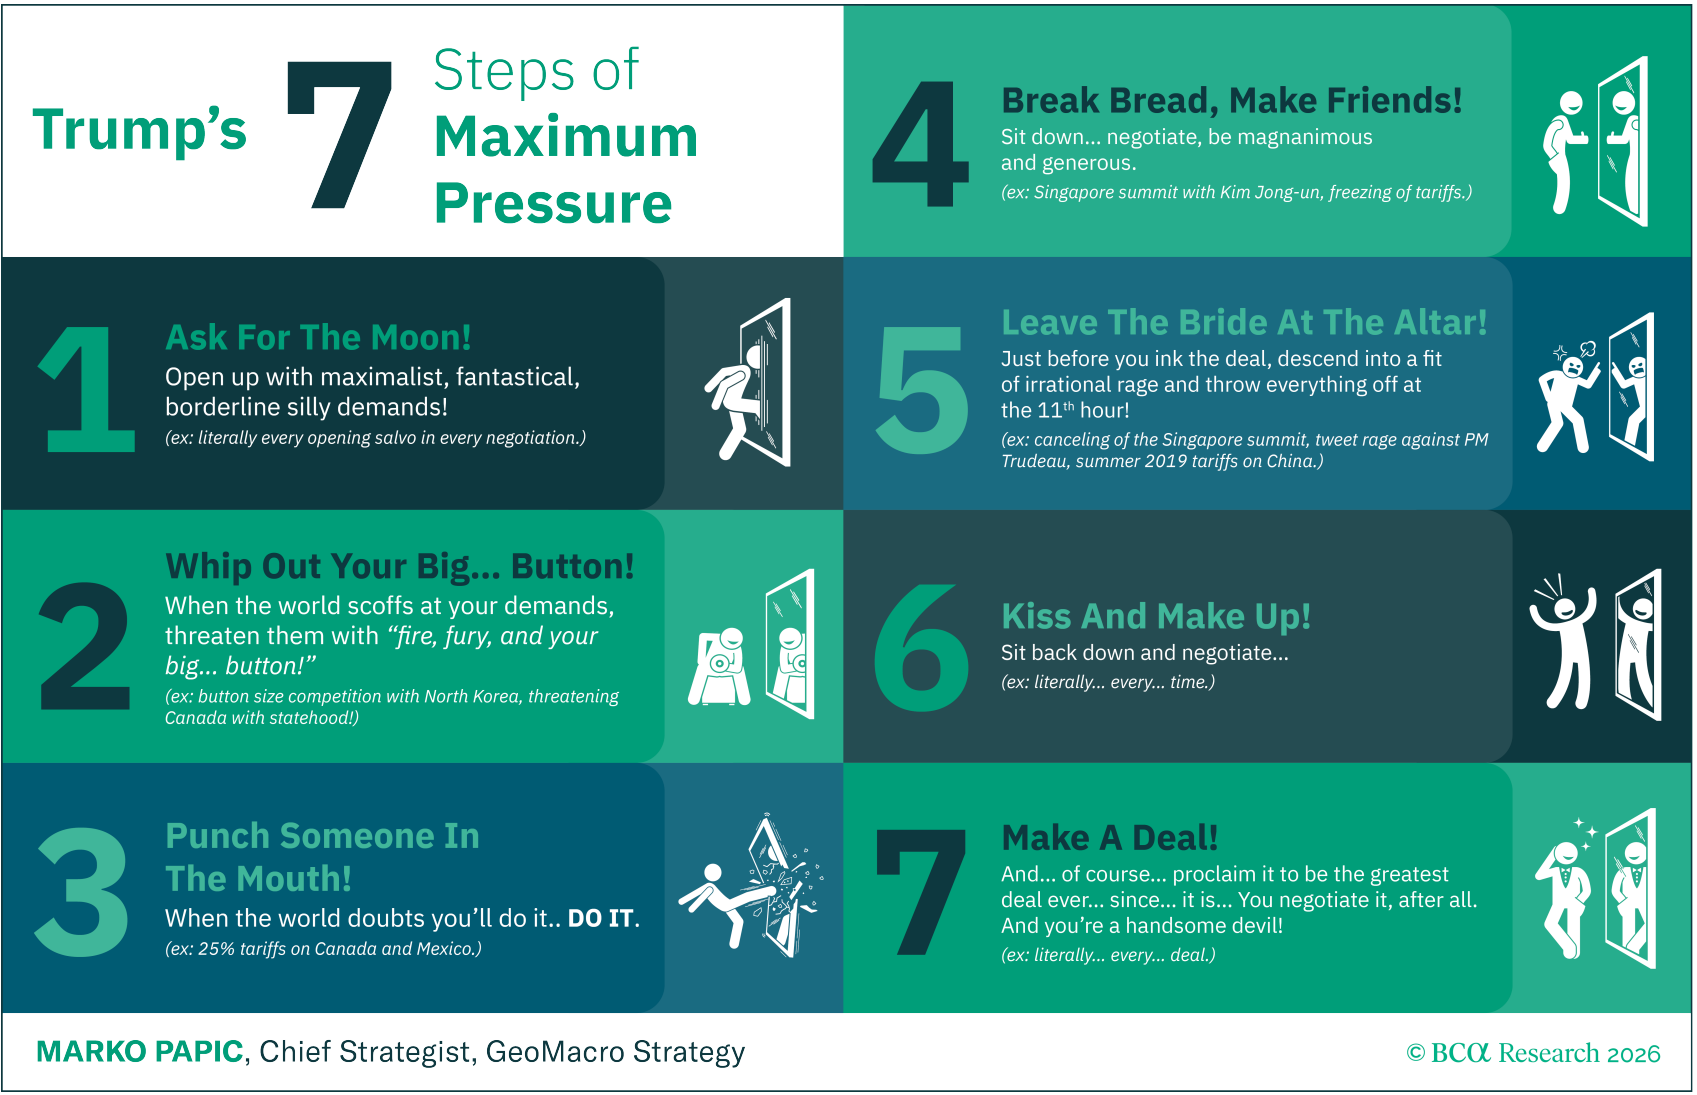
Some people might describe President Trump’s tactic using the TACO — Trump Always Chickens Out — acronym. Instead, BCA Research’s Marko Papic put together a seven-step framework for Trump’s maximum pressure negotiating style that we find more instructive.

Steps 1 through 3 — maximalist demands, threats, and following through — are in the rearview. We appear to be entering Step 4: fragile ceasefire, back-channel signals, and political jockeying from both sides to frame their position as a win. If the framework holds, we could be in for one more dramatic detour before a deal gets done.

A breakdown in negotiations or a miscalculation on either side could push oil prices meaningfully higher with downstream impacts on earnings and global growth. This is more of a tail-risk scenario, but Trump has left the altar before. The question is – will Iran still be there when he returns?

We imagine the likely base case resembles a uranium moratorium — perhaps similar to the Obama-era Joint Comprehensive Plan of Action, but sold very differently. Trump’s version will lean on the military degradation of Iranian capabilities. For Iran, the goal was always a shift in US policy posture. Both sides will aim to find a version of that story to tell their constituents.

Where We Stand

Before the conflict, our strategies had real momentum. Our tilt towards international equities was outperforming the US, and the Diversifiers strategy (i.e., gold, natural resources, commodities) boosted returns. Some of that outperformance has pulled back as international markets are more vulnerable to gulf energy. However, we believe that the bigger picture is unchanged.

Prior to the war, deglobalization was already underway, only to be accelerated by this conflict. Nations that spent decades outsourcing their energy and security needs are now building for self-sufficiency with more urgency. New trade arrangements, energy partnerships, and military alliances are forming in rooms the US is not in. The map is being redrawn, and we want exposure to that.

And What We Did

Our take? Rather than dramatic strategy shifts, we acknowledge the market’s ability to look past geopolitical noise and instead rebalanced firmwide back to target. This trimmed what held up — gold, commodities — and rotated into areas that sold off, including US equities. Should markets sell off further in a tail-risk event, we are actively watching for opportunities to tactically pivot strength into weakness. 

To clients, the right posture might seem boring — and boring is probably correct. Sometimes, boring means hedging against the risks you can see, and diversifying against the ones you cannot.

WSWA

Warren Street Wealth Advisors

Warren Street Wealth Advisors, LLC., a Registered Investment Advisor

The information presented here represents opinions and is not meant as personal or actionable advice to any individual, corporation, or other entity. Any investments discussed carry unique risks and should be carefully considered and reviewed by you and your financial professional. Nothing in this document is a solicitation to buy or sell any securities, or an attempt to furnish personal investment advice. Warren Street Wealth Advisors may own securities referenced in this document. Due to the static nature of content, securities held may change over time and current trades may be contrary to outdated publications. Form ADV available upon request 714-876-6200.
Sources:

  • BCA Research

https://warrenstreetwealth.com/wp-content/uploads/2026/04/On-the-War-in-Iran-Do-Markets-Not-Care-and-Whats-Next.png 1080 1080 Phillip Law, CFA https://warrenstreetwealth.com/wp-content/uploads/2014/11/Warren_Street_logo-01.svg Phillip Law, CFA2026-04-24 16:48:312026-04-27 14:44:45On the War in Iran: Do Markets Not Care, and What’s Next?

Oil, Conflict, and Your Portfolio: What We’re Watching

March 10, 2026/in Investing/by Warren Street Team

Before we dive into the facts, we want to take a moment to recognize that before we are advisors or investment analysts, we are human. Our hearts go out to the families and individuals affected. We hold that reality close as we do our job of helping you navigate what it means for your financial future.

Part of that job is cutting through the noise, so let’s talk about what’s happening, what it means, and what we’re doing about it.

What’s Happening

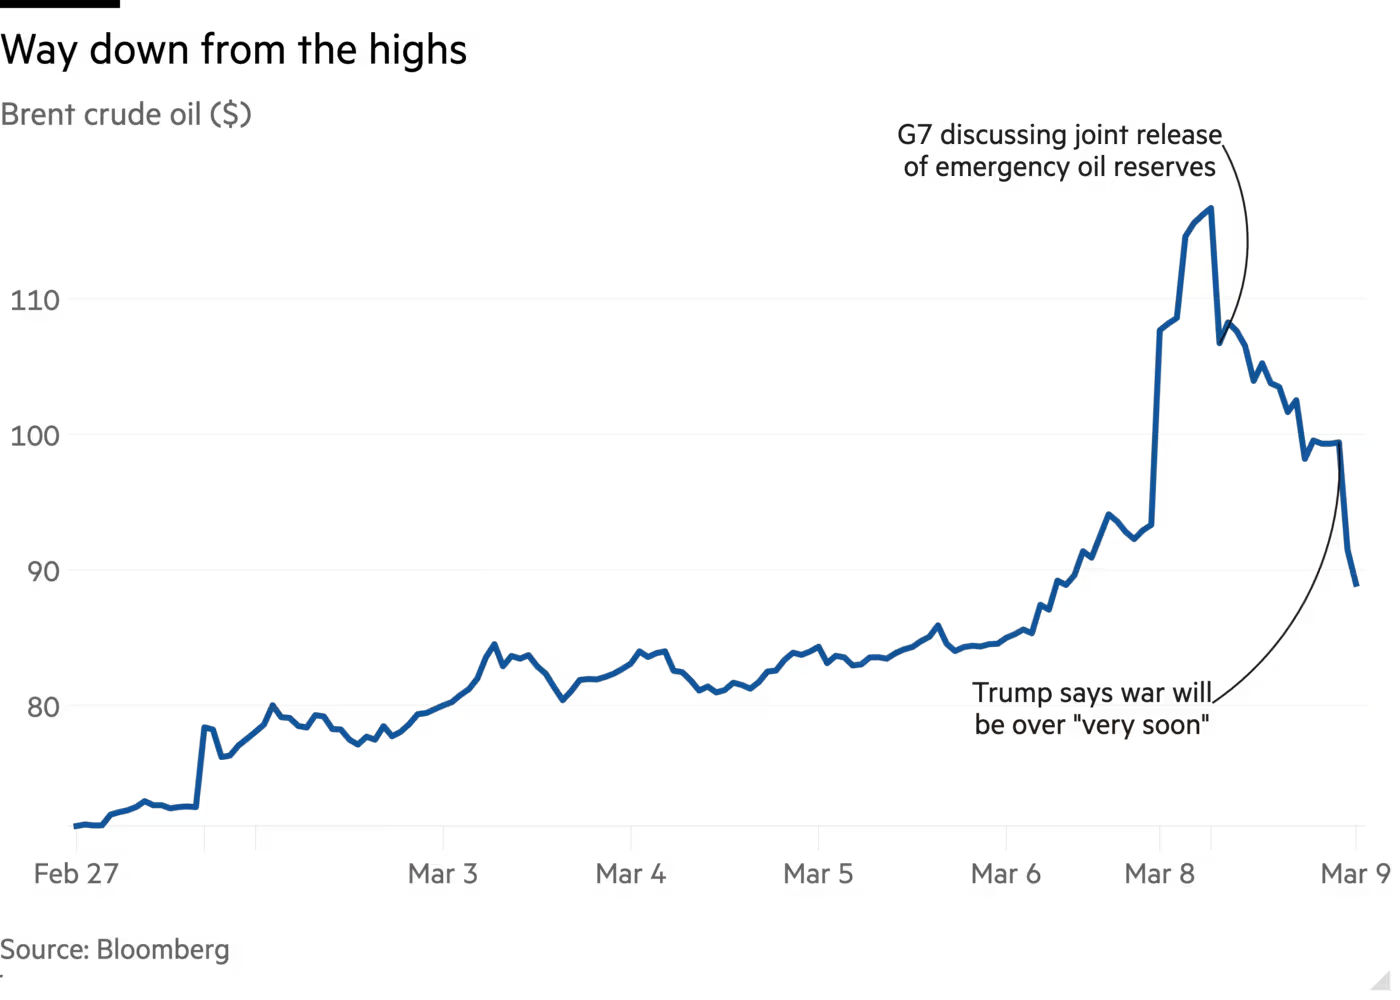
The conflict entered its second week with crude oil briefly crossing $110 per barrel. Energy infrastructure in the region sustained damage, and the world turned its attention to the Strait of Hormuz — the narrow waterway through which roughly 20% of global oil supply flows — and whether it would remain open for business.

The View from fire-detecting satellites:
Fire anomalies detected by infrared sensors on 7-8 March. Circles are sized by fire radiative power, darker circles mean several fires in close proximity

Sources: FT Analysis, Nasa Firms. Fires reported are either in locations with no history of regular burns or are unusually bright.

We don’t have a crystal ball for what will happen next, but there are three questions we’re watching closely:

  1. Will there be more lasting damage to energy infrastructure?
  2. What does the endgame look like in terms of leadership and capabilities on both sides?
  3. Can a compromise be reached that keeps oil flowing through the gulf?

And Then Oil Dropped $20

Here’s the thing about geopolitical risk: it tends to be loud and unpredictable.

As I’m writing this, oil has pulled back from $110+ per barrel to below $90 — after President Donald Trump suggested the potential for a swift conclusion to the conflict. Meanwhile, the Strait of Hormuz is seeing vessel traffic increase, recovering from post-attack lows with inbound and outbound ship movements gradually rising. 

While it’s too soon to declare a resolution, the swift oil price drop following comments from President Trump shows the market was pricing in a major supply shock that hasn’t materialized. This underscores why we avoid trading headlines, which often lead to emotional decisions mistaken for analysis. Our consistent advice for geopolitical headlines remains: stay diversified, stay disciplined, and trust your portfolio strategy.

History Has Seen This Before

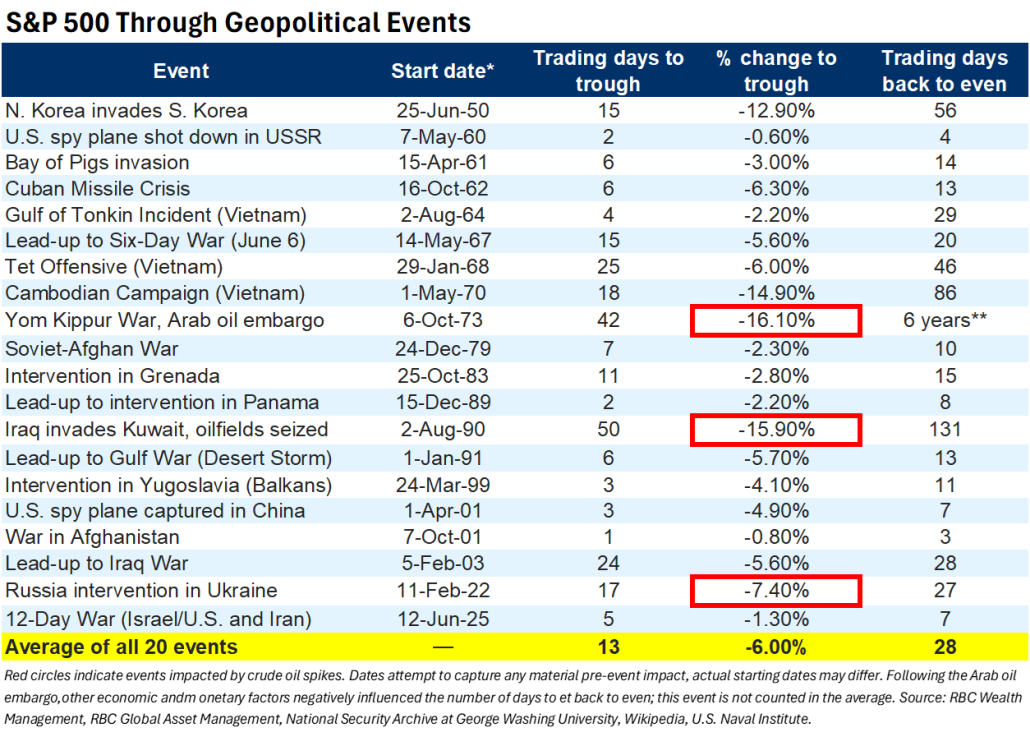
Here’s something worth sitting with. Looking at the past 20 major military conflicts and their impact on the S&P 500 over the last 75 years, the average decline from the initial shock to the market bottom was around 6%, and in 19 out of 20 cases, markets returned to pre-event levels in an average of just 28 days.

The two biggest exceptions — the 1973 Yom Kippur War and Iraq’s 1990 invasion of Kuwait — both involved sustained oil supply disruptions that pushed stocks down 15–16%. The 1973 episode scarred a generation of investors who sold out of equities and missed the enormous bull run of the 1980s.

The lesson isn’t that conflicts don’t matter. It’s that panicking out of a well-structured portfolio tends to hurt more than the conflict itself does.

This Isn’t 1973

Clients who lived through the Yom Kippur War might flinch from the prospect of re-living around-the-block gas lines, federally imposed speed reductions, or darkened cities to conserve energy. We understand the instinct, but there are major differences today.

In 1973, the U.S. was heavily dependent on imported oil. Every extra dollar at the pump was more money in the pockets of Middle Eastern countries. Today, the U.S. is a net energy exporter. Higher oil prices are painful for consumers, yes — but every extra dollar is more cash in the pockets of domestic energy producers. It’s a redistribution within the economy, not a pure drain out of it.

As for inflation, Energy makes up only about 6% of today’s U.S. inflation basket.  There also headwinds blowing against the case for a 1970’s stagflation landscape, including:

  1. Shelter Lags: Shelter costs (33% of the basket) are declining as lagging rent data catches up to reality, which will apply downward pressure on inflation prints.
  2. Technological Progress: AI and technology-driven productivity is quietly acting as a deflationary force as consumers and businesses increase adoption.
  3. Calming Tariff Tantrums: After the recent IEEPA tariff ruling, the effective tariff rate has also come down meaningfully to 9.1%.
  4. Fundamental economic strength: We acknowledge the recent jobs report’s weakness, but also recognize other areas in the economy remain healthy. Corporate profits are expected to grow at high single to double digits in 2026. Tax refunds from last year’s One Big Beautiful Bill (OBBB) haven’t fully hit consumer accounts yet.

The Fed will likely pause at upcoming meetings, but that’s very different from the kind of policy circumstances that defined the stagflation era.

Weeks, Not Months?

Both sides have strong incentives to reach a compromise quickly. Iran can’t export oil under prolonged conditions and is subject to existential economic pressure. In the U.S., $4+ gas heading into a midterm summer is its own political tax. December oil futures were already trading in the low $70s before today’s pullback, suggesting the market never fully bought the doomsday scenario. Inflation breakeven rates have stayed surprisingly calm throughout.

Even after hostilities quiet down, there’s likely a period of elevated shipping costs and more cautious tanker behavior through the region. Think of it as a persistent risk premium rather than a single clean resolution — but a manageable one, not an economy-altering one.

What We’re Doing

We’re not making dramatic moves based on headlines and that’s by design. We are however, sticking to our operating procedure of:

  1. Rebalancing – different parts of our clients’ portfolios have generally weathered the volatility well, but some may have drifted off target. Rebalancing is a disciplined move back toward those levels, not a market call, but a long-term wealth strategy of selling strength and buying weakness.
  2. We built the “Diversifiers” strategy in client’s retirement portfolios for moments like this. It’s doing its job and reminding us that traditional stock-bond portfolios don’t always move in opposite directions when inflation is in the picture.
  3. If markets sell off further in an extreme scenario, we have the flexibility to tilt asset classes within our portfolios.

We’ll continue monitoring the conflict while staying with our standard operating procedure, but what we won’t do is trade headlines. The oil price chart of the last two weeks makes that case better than we ever could.

WSWA

Warren Street Wealth Advisors

Warren Street Wealth Advisors, LLC., a Registered Investment Advisor

The information presented here represents opinions and is not meant as personal or actionable advice to any individual, corporation, or other entity. Any investments discussed carry unique risks and should be carefully considered and reviewed by you and your financial professional. Nothing in this document is a solicitation to buy or sell any securities, or an attempt to furnish personal investment advice. Warren Street Wealth Advisors may own securities referenced in this document. Due to the static nature of content, securities held may change over time and current trades may be contrary to outdated publications. Form ADV available upon request 714-876-6200.

Sources:

  • https://www.ft.com/content/56dd339c-51ea-41b0-983a-fe13c0d5ab54#post-2777139a-5545-4ece-8753-34d1868ddd08
  • https://www.reuters.com/graphics/IRAN-CRISIS/MAPS/znpnmelervl/#tanker-traffic-in-the-strait-of-hormuz-comes-to-a-standstill
  • https://privatebank.jpmorgan.com/nam/en/insights/audio-and-webcasts/webcasts/the-evolving-conflict-with-iran-and-investment-implications

https://warrenstreetwealth.com/wp-content/uploads/2026/03/image-3.png 802 709 Warren Street Team https://warrenstreetwealth.com/wp-content/uploads/2014/11/Warren_Street_logo-01.svg Warren Street Team2026-03-10 04:03:002026-03-10 10:00:34Oil, Conflict, and Your Portfolio: What We’re Watching

2026 Outlook: Beyond AI & Mega-Cap Tech

January 28, 2026/in General, Investing/by Phillip Law, CFA

“Is AI a bubble?” my uncle asked as I put my fork down mid-bite on New Year’s Eve. I’d wager that this question dominated dinner tables and family gatherings across the country this holiday season. Even my sister, whose focus lies entirely within the arts and creative pursuits, managed to put the two words “AI” and “Bubble” together.

This tells me two things: 1) Concern around AI and “bubble-ness” is virtually inescapable and 2) this question is dominating the audience’s perception of markets, perhaps even more so than the meteoric rise of silver and gold as we enter 2026.

Why Does AI Deserve So Much Attention?

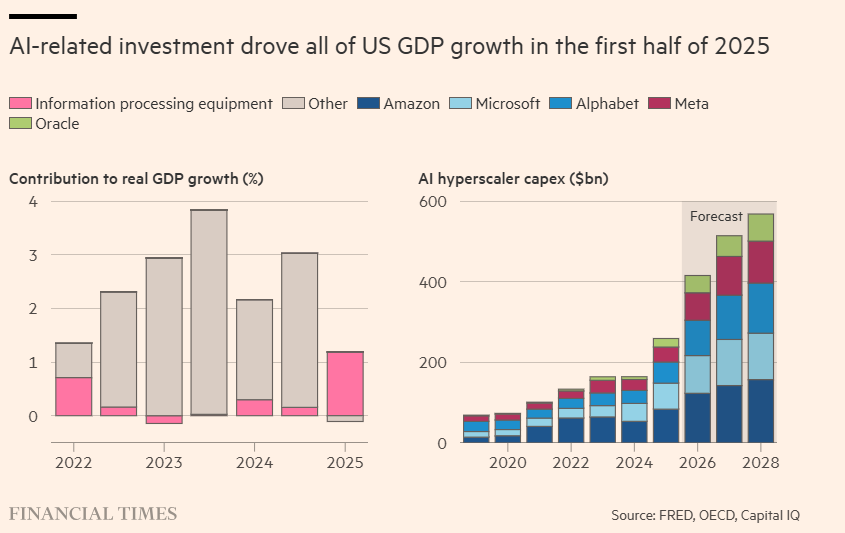
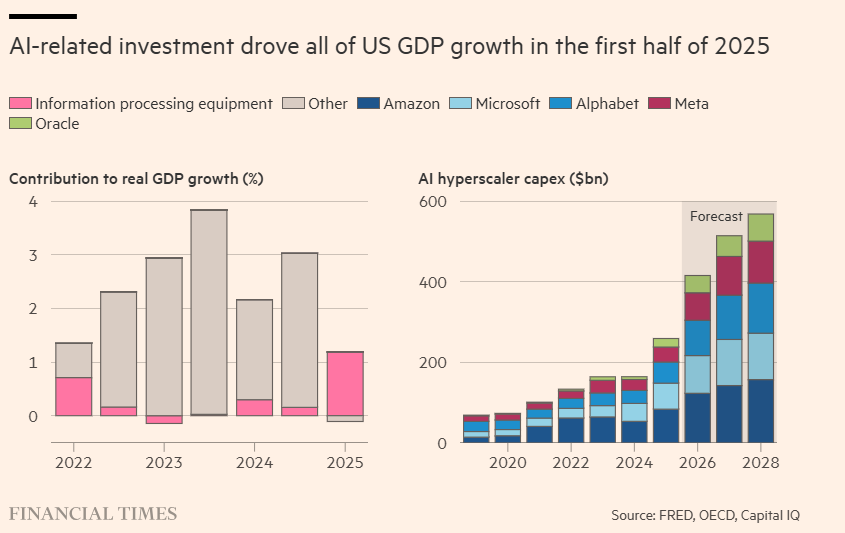
In 2025, AI-related names drove ~60% of the increase in the S&P 500’s value. Furthermore, AI spending from the “Hyperscalers” (Google, Microsoft, etc.) accounted for the lion’s share of our economy’s growth. Without the spending on data center infrastructure—servers, GPUs, and the centers themselves—some estimates suggest US GDP would have grown at a measly 0.1% in the first half of 2025. It’s safe to say that AI alone kept the economy afloat for most of last year.

The robust figures above underscore why AI rightfully commands significant attention. However, fixating on the bubble label can be a trap, much like timing the market. Instead, we should look at bubble psychology and how those excesses may be extending into the AI ecosystem.

Settling the AI Bubble Talk

It’s been over 20 years since we’ve seen such a transformative, general-purpose technology with the potential to deliver productivity gains eclipsing the internet era. This fervor has already minted a class of early winners, leaving everyone else watching with a potent mix of envy and regret. It’s the classic setup for FOMO, where the “AI train” starts looking less like a sound, technological investment and more like a high-speed shortcut to a cushy nest egg.

The danger is that the faster this train moves, the easier it is to speed right past the following flags:

  • Starting Valuations: We pay prices regardless of whether reasonable returns can be generated.
  • Risk/Reward Profiles: We stop asking if we’re actually being compensated for the layers of risk we’re adding to our broader portfolio.
  • Lofty Narratives: AI’s newness unrestrains the imagination to justify price tags that reality can’t yet support.

Behind the Excitement: What’s Different This Time?

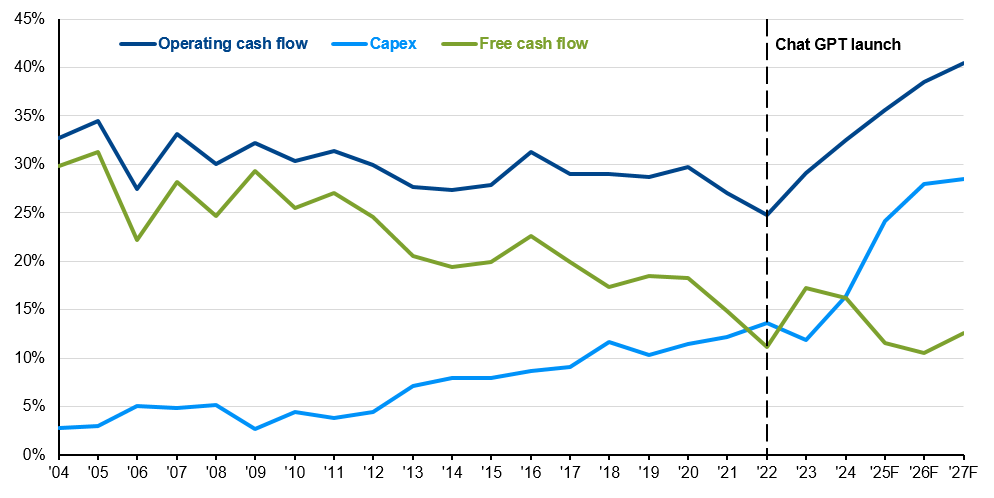
A Stronger Starting Line-Up Unlike the fragile startups of the dotcom era, today’s main AI spenders are profitable, cash-printing businesses. They are self-funding a massive AI arms race with capital expenditures set to leap by 60%, from $250bn in 2025 to over $400bn in 2026. Operating cash flows continue to outspace AI spend as a percentage of sales, allowing this historic investment to feel like a strategic augmentation of their core businesses rather than a reckless gamble.

Justified Valuations While Forward P/E ratios look expensive, today’s multiples are anchored by real-world profit. Take Nvidia: its stock price increased 14x over the last five years, but earnings grew 20x. Today’s titans aren’t as frothy as the dotcom class of 2000 because they are delivering healthy bottom-line results. However, this optimism hinges on perfection. While bulls argue we are buying “cheaper” growth today than at any point in the decade, that narrative leaves a near zero margin for error if adoption slows.

Infrastructure Demand In contrast to the fiber-optic mania of the 90s, the demand for AI build-outs can’t seem to catch a break. Data center vacancy rates are at a record low of 1.6%, and ~75% of pre-construction builds are already pre-leased. Additionally, past infrastructure bubbles saw spending peak between 2% and 5% of GDP, whereas today’s AI investment sits at roughly 1%. This suggests the build-out still has room to run.

Show Me the Money Revenues are skyrocketing. Alphabet’s Q3 2025 results proved that AI-driven features are accelerating search and ads, with generative AI product revenue surging into the triple-digit percentage range year-over-year. Beyond the titans, some industry participants have grown revenues nearly ninefold since ChatGPT launched. For now, the receipts are keeping the optimism alive.


AI Is Running Fast… But Will it Trip a Wire?

We are in a high-stakes arms race on both a micro level (hyperscalers) and a macro level (US vs. China). Businesses are pouring trillions into this effort to secure US leadership in a technology that will change the fabric of society. But in this race to the top, it’s easy to overlook the blind spots.

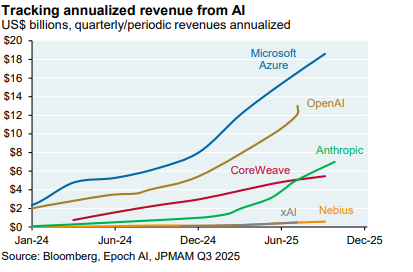
Revenues & Profits: Can We Reach the Promised Land? Despite the growth, there is a staggering gap between spending and earning. Analyst Azeem Azhar points out that AI companies are projected to generate $60bn in revenue against $400bn in spending for 2025. That’s a 6-7x gap—far wider than the dotcom bubble (4x) or the railroad boom (2x). Even if revenue catches up, will it translate to profit, or will we see a “race to the bottom” where large language models (LLMs) become commoditized?

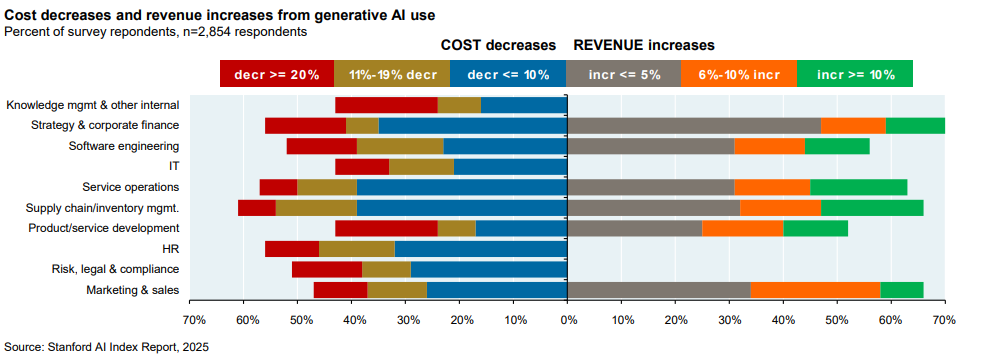
Is Demand Real? Adoption is still in its awkward early stages. Only roughly 10% of firms are using AI to produce goods, though 45% pay for LLM subscriptions. According to the Stanford AI Index and McKinsey, the majority of firms are seeing only modest cost savings (≤10%) and negligible revenue gains (≤5%). Will AI adoption ever truly scale into broad, durable profit expansion?

How Long is Your (Useful) Life? Hyperscalers like Microsoft and Google have boosted profits by extending the “useful life” of their AI assets in their books. If innovation renders chips obsolete in 24 months, these companies will face massive write-downs. More importantly, they are funding this short-lived hardware with 30-year debt, leaving investors holding the bag for “obsolete” infrastructure that won’t be paid off for decades.

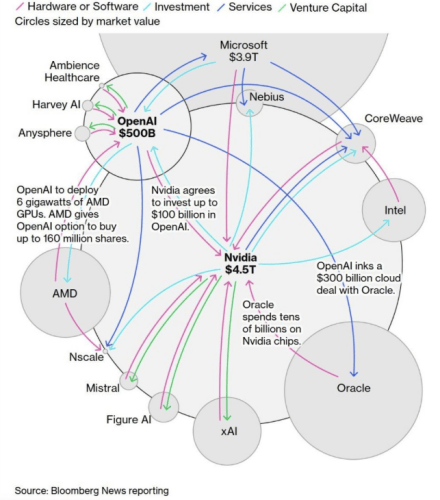
The AI Ouroboros There is an increasingly circular dance where Microsoft invests in OpenAI and then books cloud revenue from them. Nvidia buys stakes in the startups they sell chips to. This means a chunk of today’s “booming” revenue is an internal recycling of capital where true economic profit from external customers remains hypothetical.


Cloudy with a Chance of IOUs: While the biggest players usually use cash, we’re seeing a pivot toward the bond market. Oracle and Meta have emerged as outliers, using long-term bonds and project finance to bankroll their data centers. As free cash flow wilts under the weight of AI spend, their stock prices are feeling the gravity. Furthermore, the industry is using Special Purpose Vehicles (SPVs) to hide this leverage off-balance sheet, adding a layer of obscurity to the trillions being spent.

Conclusion: A Massive Collection of What-Ifs

Ultimately, the AI story comes down to “what-ifs.” What if AGI finally shows up and productivity explodes? Or, what if demand never materializes and the hyperscalers finally blink? With cracks showing—like OpenAI’s recent “Code Red”—it’s impossible to say if we’re headed for a minor correction or a systemic burst.

Our 2026 Recommendations:
  1. Keep a seat at the table: Exposure to market-cap weighted indices allows you to benefit if the “promised land” materializes.
  2. Diversify your sources of risk: Anchor beyond US tech. Gold, international markets, and bonds offer a necessary buffer if signs of excess turn into a choppy ride.

Rebalance systematically: Rebalancing is a controllable hedge. When sector weights become excessive, returning to target allocations helps lock in gains and reduce concentration risk.

Phillip Law, CFA

Senior Portfolio Manager, Warren Street Wealth Advisors

Investment Advisor Representative, Warren Street Wealth Advisors, LLC., a Registered Investment Advisor

The information presented here represents opinions and is not meant as personal or actionable advice to any individual, corporation, or other entity. Any investments discussed carry unique risks and should be carefully considered and reviewed by you and your financial professional. Nothing in this document is a solicitation to buy or sell any securities, or an attempt to furnish personal investment advice. Warren Street Wealth Advisors may own securities referenced in this document. Due to the static nature of content, securities held may change over time and current trades may be contrary to outdated publications. Form ADV available upon request 714-876-6200.
https://warrenstreetwealth.com/wp-content/uploads/2026/01/2026-Outlook-Beyond-AI-Mega-Cap-Tech.png 1080 1080 Phillip Law, CFA https://warrenstreetwealth.com/wp-content/uploads/2014/11/Warren_Street_logo-01.svg Phillip Law, CFA2026-01-28 07:29:002026-01-23 14:40:232026 Outlook: Beyond AI & Mega-Cap Tech

2026 Investment Outlook: AI, Economy, Inflation

January 23, 2026/in General, Investing/by Phillip Law, CFA

With 2025 in the rear view mirror, we look towards the new year. What lessons did we learn and what trends deserve attention? How do we allocate portfolios based on that knowledge? In this piece, we’d like to share three areas of focus heading into 2026:

  1. Artificial Intelligence and Bubbleness
  2. The State of the US Economy
  3. The Biggest Risks to Asset Markets (Namely Inflation)

2025 Recap: Laughing in the Face of Di-worsification:

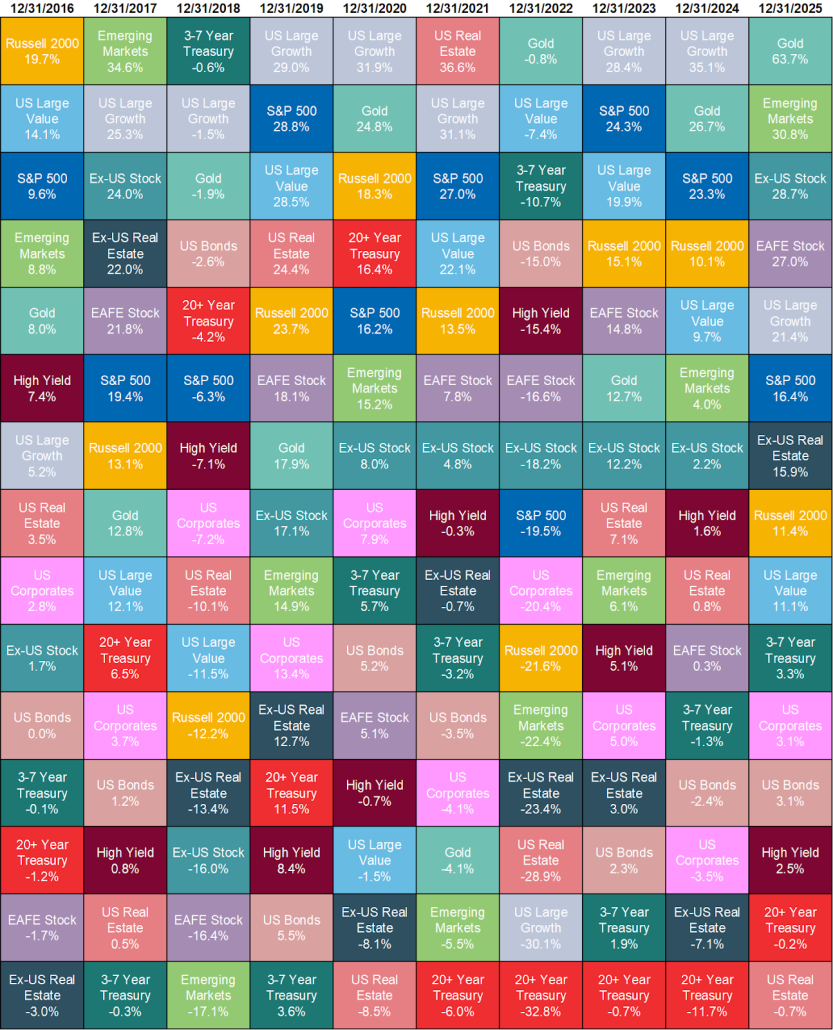
After years of US led-dominance, we saw narratives across asset classes flip on their heads. For the first time in years:

  • US Stocks underperformed developed international and emerging market geographies.
  • Gold, held for its diversification benefits, shined more brightly than most major asset categories. 

Source: YCharts

The year reminded us that “di-worsification” – a term long used to parody the idea that diversifying into less correlated, non-US assets only made portfolios worse – isn’t a universal truth. In 2025, holding different asset segments helped weather volatile trade policy, weakening dollar, and US deficit concerns.

Ultimately, we left 2025 with a more fragmented globe where nations now emphasize national security and independence over globalized efficiencies. In this new regime where the global economy is de-synchronized, we believe diversification is more essential than ever.

Looking to 2026: What of AI and Its Bubbleness?

The topic of artificial intelligence being a bubble is almost inescapable. AI Hyperscalers, bolstered by massive spending commitments on AI investments,  drove over 60% of the S&P 500’s growth and was a key lifeline for the economy in 2025. With AI hyperscalers and key players constituting a significant portion of the S&P 500, the ecosystem will likely continue to define US markets in 2026. So is it a bubble?

We have a separate piece that deep dives into the AI Bubble question which I’ve summarized below:

The Bull Case:

Proponents argue that this time is different compared to other speculative manias. The players here are profitable, cash-printing businesses whose valuations are not only reasonable, but also are pricing in achievable growth. Furthermore, there is ample demand for infrastructure, particularly data centers, unlike the railroad and dotcom bubbles. This all will enable revenue to follow, which has already exhibited enormous growth rates.

The Bear Case:

Despite tremendous growth, AI companies are spending way more than they’re making, (higher than past bubbles). Demand from businesses remains uncertain, with early studies showing only modest cost savings/revenue gains. Also, most revenue booked today is a result of circular investing amongst AI players. Meanwhile, AI companies are using aggressive accounting methods for their chips, which puts future earnings estimates at risk. Lastly, debt is now being used to finance spending, officially adding a shot clock for return on investment to materialize.

What to Do?

Within the deep-dive, we reach two conclusions: 

1. Focusing on the “bubble” label is often unproductive. Even if excesses exist, timing the eventual “burst” is a fool’s errand—will it be in one year or five? Selling too early means potentially missing out on healthy gains.

As Peter Lynch noted, “Far more money has been lost by investors preparing for corrections, or trying to anticipate corrections, than has been lost in corrections themselves.”

2. The AI dilemma is ultimately a huge collection of what-ifs, but we believe keeping a seat at the table while diversifying sources of risk and return in other parts of the portfolio such as international stocks, bonds, or gold is prudent.

How’s the US Economy?

Objectively speaking, the economy is in a healthy state heading into 2026. Let’s look at a few primary indicators:

  • A Productive Economy – GDP grew at an astonishing annualized rate of 4.3% in Q3 2025 and is projected to grow ~2% (long-term average) in 2026. We expect AI spending to continue as hyperscalers add to productivity and other businesses increase adoption.
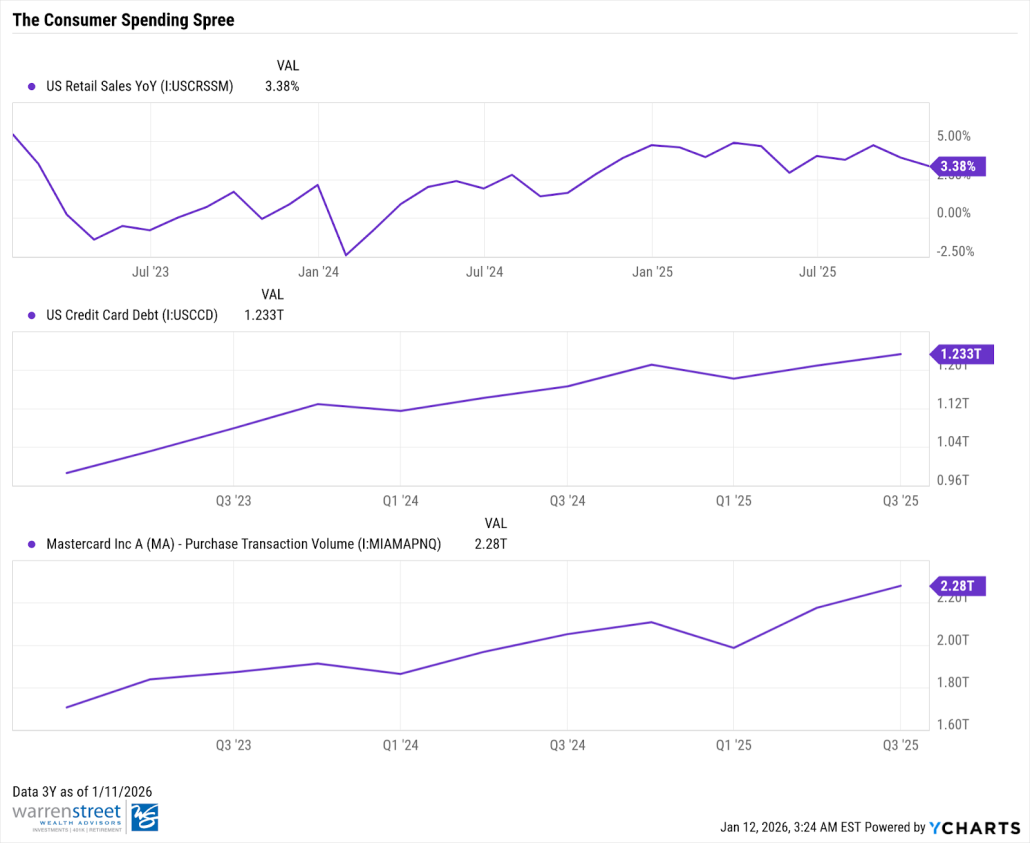
  • The Spending Surprise – Despite rising concerns around job security and waning sentiment, Americans are still spending. In late 2025, retail sales surged 3.5% year-over-year and we observed a healthy uptick in credit card balances.
  • Fiscal & Monetary Stimulus: 
    •  Heading into 2026, we’ve unlocked tax credits from the One Big Beautiful Bill (OBBB). We take estimates with a grain of salt, but if $100bn in total tax refunds and a $3,750 average tax cut per filer could further stimulate consumer spending.
    • The market currently anticipates two rate cuts, which will lower the cost of borrowing for both businesses and consumers (maybe more, pending Federal Reserve politics).

With a solid launching pad to start the year followed by additional liquidity in consumers pockets, we believe the US economy is well-equipped heading into 2026.

What About the Risks?

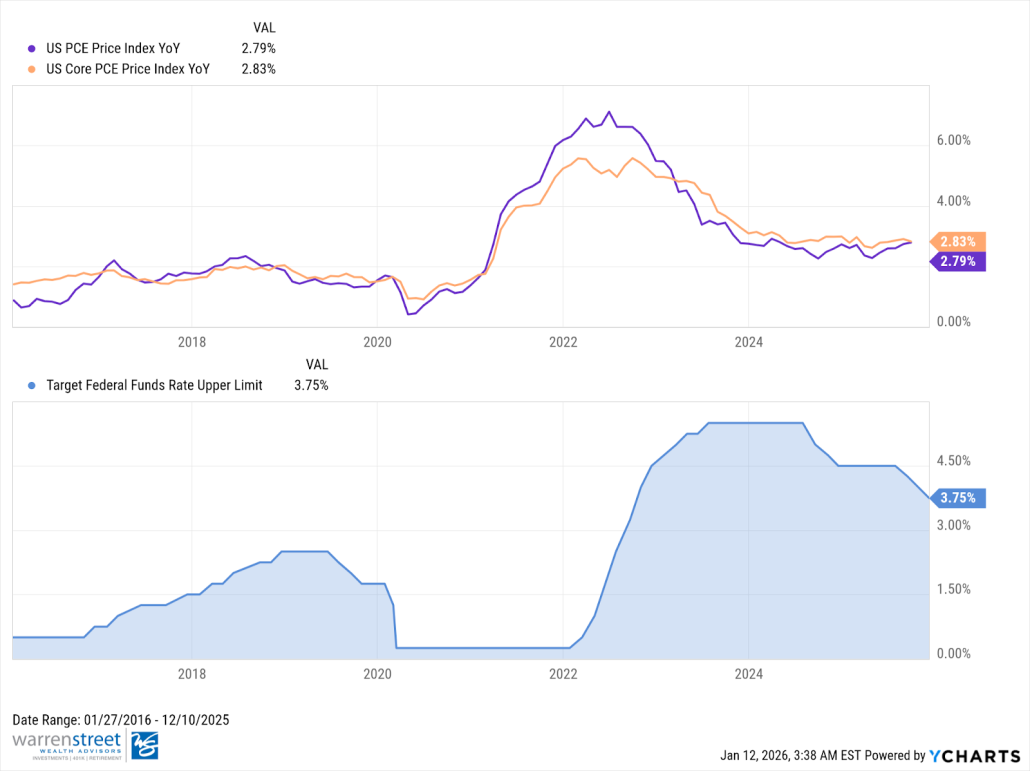
We believe the primary, non-wildcard risk to asset markets is inflation. Although inflation has stabilized from recent years, it remains sticky compared to pre-pandemic levels (around 2%), with the Fed’s preferred measure recently estimated at 2.8%.

The current economic backdrop does allow more sensitivities to a spike in inflation.

  1. Trade fragmentation and tariffs – while most businesses seemingly absorbed the price increases of tariffs in 2025, we’ve begun to see some price hikes passed to consumers in recent inflation prints. 
  2. Is Stimulus a Double-Edged Sword? – While increased liquidity for consumers can be helpful, it may also fuel inflation. The prior stimulus checks led to double-digit drops in equities and bonds (2022) as we raised rates to fight policy-driven inflation.
  3. Financial Repression – With US Debt-to-GDP approaching 120%, there is a risk that policymakers resort to “financial repression” – intentionally allowing higher inflation to “inflate away” the real value of government debt.

With US equities trading expensively and bonds vulnerable to inflation, I’d park this risk in the low probability, but high impact camp. To mitigate this risk, owning a portion of your portfolio to hedges (gold, commodities, natural resources) can cushion against a potential 2022 repeat.

Conclusion:

Ultimately, the backdrop seems favorable for US equity markets heading into 2026. Even if markets are frothy, the solution to managing potential excesses and drawdowns is not in timing them, but instead: a) building adequately diversified portfolios b) aligning allocations with your risk tolerance and financial objective and c) rebalancing into weakness to harness the long-term growth of capital markets at more advantageous price levels.

That’s our 2026 outlook. Our advice remains: use these investing principles as your foundation. This will allow 2026 to be less about watching tickers and more about the life you’re building. Hit that PR, read those books, or learn to cook—aim to achieve your best self. While we can recommend investments and share outlooks, there’s no substitute for investing in your own growth and happiness.

Phillip Law, CFA

Senior Portfolio Manager, Warren Street Wealth Advisors

Investment Advisor Representative, Warren Street Wealth Advisors, LLC., a Registered Investment Advisor

The information presented here represents opinions and is not meant as personal or actionable advice to any individual, corporation, or other entity. Any investments discussed carry unique risks and should be carefully considered and reviewed by you and your financial professional. Nothing in this document is a solicitation to buy or sell any securities, or an attempt to furnish personal investment advice. Warren Street Wealth Advisors may own securities referenced in this document. Due to the static nature of content, securities held may change over time and current trades may be contrary to outdated publications. Form ADV available upon request 714-876-6200.
https://warrenstreetwealth.com/wp-content/uploads/2026/01/2026-Investment-Outlook.png 1080 1080 Phillip Law, CFA https://warrenstreetwealth.com/wp-content/uploads/2014/11/Warren_Street_logo-01.svg Phillip Law, CFA2026-01-23 12:03:482026-01-28 08:02:082026 Investment Outlook: AI, Economy, Inflation

Introducing Warren Street Global Equity ETF (WSGE) – An Informed Approach to Diversification

December 12, 2025/in General, Investing/by Phillip Law, CFA

We’re thrilled to announce a major milestone for our firm and our clients: the launch of the Warren Street Global Equity ETF (NASDAQ: WSGE)!

This new Exchange-Traded Fund (ETF) is now available, bringing our disciplined investment philosophy to the public in a convenient, accessible format. This is an exciting step forward as we continue to provide sophisticated investment solutions while delivering on our fiduciary commitment.

The Warren Street Wealth Advisors team celebrates the launch with a visit to the NASDAQ MarketSite in Times Square, New York.

What is WSGE and Why Did We Create It?

The Warren Street Global Equity ETF (WSGE) is designed to be a smarter way to invest in the global stock market. The traditional choice has always been either a simple, broad index fund or a complicated, expensive actively managed fund. We created WSGE to give you the best of both worlds: global diversification with a smart strategy built to enhance returns.

Focus on You: The Key Client Benefits

While the investment strategy is robust, the most important reason we created WSGE is to provide direct, tangible benefits to you, our clients, and to uphold our fiduciary standard:

  • Embedded Tax Efficiencies: As an ETF, WSGE is structured to minimize capital gains distributions compared to traditional mutual funds. This powerful tax efficiency helps you keep more of your investment returns, making your portfolio work harder over the long term.
  • Economies of Scale: By bundling diverse global exposures and our proprietary strategy into a single vehicle, we achieve significant economies of scale. This approach reduces complexity and overall costs, effectively providing you with institutional-quality management at a lower expense.
  • Uniformity Across Clients: WSGE ensures every client benefits from the exact same research-driven exposure and proprietary factor tilts. This uniformity across clients leads to greater consistency, streamlined execution, and clearer reporting, regardless of account size.
  • Time Savings & Simplicity: The single-fund structure drastically simplifies trade execution, rebalancing, and overall portfolio maintenance. This provides time savings for both our advisory team and you, the client, allowing us to focus more on your comprehensive financial plan, retirement goals, and tax strategies.

Learn More

When you invest in WSGE, you’re accessing the same level of rigorous due diligence that defines Warren Street Wealth Advisors. We meticulously select the fund’s underlying investments, focusing on quality management, low cost, and alignment with our goals.

We are proud to bring this innovative solution to market and look forward to partnering with you on your journey toward long-term capital appreciation.

To learn more about the fund, view the prospectus, and review important disclosures, please visit warrenstreetetf.com.

Phillip Law, CFA

Senior Portfolio Manager, Warren Street Wealth Advisors

Investment Advisor Representative, Warren Street Wealth Advisors, LLC., a Registered Investment Advisor

The information presented here represents opinions and is not meant as personal or actionable advice to any individual, corporation, or other entity. Any investments discussed carry unique risks and should be carefully considered and reviewed by you and your financial professional. Nothing in this document is a solicitation to buy or sell any securities, or an attempt to furnish personal investment advice. Warren Street Wealth Advisors may own securities referenced in this document. Due to the static nature of content, securities held may change over time and current trades may be contrary to outdated publications. Form ADV available upon request 714-876-6200.
Important Information

The Fund’s investment objectives, risks, charges and expenses must be considered carefully before investing. This and other important information is contained in the prospectus, which may be obtained by following the links Prospectus and Summary Prospectus or by calling +1.714.876.6200. Please read the prospectus carefully before investing.

The Fund is actively-managed and is subject to the risk that the strategy may not produce the intended results. The Fund is new and has a limited operating history to evaluate.

Median 30 Day Spread: is a calculation of Fund’s median bid-ask spread, expressed as a percentage rounded to the nearest hundredth, computed by: identifying the Fund’s national best bid and national best offer as of the end of each 10 second interval during each trading day of the last 30 calendar days; dividing the difference between each such bid and offer by the midpoint of the national best bid and national best offer; and identifying the median of those values.

Basis Points (bps): A unit of measure used in quoting yields, changes in yields or differences between yields. One basis point is equal to 0.01%, or one one-hundredth of a percent of yield and 100 basis points equals 1%.

Equity Investing Risk. An investment in the Fund involves risks similar to those of investing in any fund holding equity securities, such as market fluctuations, changes in interest rates and perceived trends in stock prices. The values of equity securities could decline generally or could underperform other investments. In addition, securities may decline in value due to factors affecting a specific issuer, market or securities markets generally.

Fixed-Income Risk. The market value of fixed-income securities will change in response to interest rate changes and other factors, such as changes in the effective maturities and credit ratings of fixed-income investments. During periods of falling interest rates, the values of outstanding fixed-income securities and related financial instruments generally rise. Conversely, during periods of rising interest rates, the values of such securities and related financial instruments generally decline. Fixed-income investments are also subject to credit risk.

Large-Capitalization Companies Risk. Large-capitalization companies may trail the returns of the overall stock market. Large-capitalization stocks tend to go through cycles of doing better – or worse – than the stock market in general. These periods have, in the past, lasted for as long as several years.

Mid-Capitalization Companies Risk. Investing in securities of mid-capitalization companies involves greater risk than customarily is associated with investing in larger, more established companies. These companies’ securities may be more volatile and less liquid than those of more established companies. Often mid-capitalization companies and the industries in which they focus are still evolving and, as a result, they may be more sensitive to changing market conditions.

Depositary Receipt Risk. ADRs and GDRs are generally subject to the risks of investing directly in foreign securities and, in some cases, there may be less information available about the underlying issuers than would be the case with a direct investment in the foreign issuer. ADRs are U.S. dollar-denominated receipts representing shares of foreign-based corporations. GDRs are similar to ADRs but are shares of foreign-based corporations generally issued by international banks in one or more markets around the world.

Risk of Investing in Other ETFs. Because the Fund may invest in Underlying ETFs, the Fund’s investment performance is impacted by the investment performance of the selected Underlying ETFs. An investment in the Fund is subject to the risks associated with the Underlying ETFs that then-currently comprise the Fund’s portfolio. At times, certain of the segments of the market represented by the Fund’s Underlying ETFs may be out of favor and underperform other segments.

Focus Investing Risk. The Fund seeks to hold the stocks of approximately 40 companies. As a result, the Fund invests a high percentage of its assets in a small number of companies, which may add to Fund volatility.

Foreign Investment Risk. Returns on investments in foreign securities could be more volatile than, or trail the returns on U.S. securities. Investments in or exposures to foreign securities are subject to special risks,  including differences in information available about issuers of securities and investor protection standards. In addition, foreign securities denominated in other currencies could decline due to changes in local currency.

Factor-Based Investing Risk. There can be no assurance that the factor-based investment selection process employed by the Sub-Adviser will enhance the Fund’s performance. Exposure to the different investment cycles identified by the Sub-Adviser may detract from the Fund’s performance in some market environments.

ETFs may trade at a premium or discount to their net asset value. ETF shares may only be redeemed at NAV by authorized participants in large creation units. There can be no guarantee that an active trading market for shares will exist. The trading of shares may incur brokerage.

This material has been distributed for informational purposes only and should not be considered as investment advice or a recommendation of any particular security, strategy or investment product. We make no representation or warranty as to the accuracy or completeness of the information contained herein including third-party data sources. The views expressed are as of the publication date and subject to change at any time. No part of this material may be reproduced in any form, or referred to in any other publication without express written permission. References to other funds should not to be interpreted as an offer or recommendation of these securities.

An investment in the Fund involves risk, including possible loss of principal. Exchange-traded funds (ETFs) trade like stocks, are subject to investment risk, fluctuate in market value and may trade at prices above or below the ETF’s net asset value (NAV), and are not individually redeemable directly with the ETF. Brokerage commissions and ETF expenses will reduce returns. ETFs are subject to specific risks, depending on the nature of the underlying strategy of the Fund, which should be considered carefully when making investment decisions. For a complete description of the Fund’s principal investment risks, please refer to the prospectus.

Shares of the Funds Are Not FDIC Insured, May Lose Value, and Have No Bank Guarantee.

The Fund is distributed by PINE Distributors LLC. The Fund’s investment adviser is Empowered Funds, LLC, which is doing business as ETF Architect. Warren Street Wealth Advisors, LLC serve as the Sub-advisers to the Fund. PINE Distributors LLC is not affiliated with ETF Architect or Warren Street Wealth Advisors, LLC. Learn more about PINE Distributors LLC at FINRA’s BrokerCheck.

ETFAC-4941235-10/25

https://warrenstreetwealth.com/wp-content/uploads/2025/11/image.jpeg 1365 2048 Phillip Law, CFA https://warrenstreetwealth.com/wp-content/uploads/2014/11/Warren_Street_logo-01.svg Phillip Law, CFA2025-12-12 08:00:002025-12-12 08:44:36Introducing Warren Street Global Equity ETF (WSGE) – An Informed Approach to Diversification

Decoding the AI Hype: How Today’s Market Compares to the Dot-Com Bubble

November 19, 2025/in General, Intermediate, Investing/by Phillip Law, CFA

You’ve likely seen headlines comparing today’s AI-driven market to the late-1990s dot-com era. We take those comparisons seriously. This note outlines what’s different today, what still deserves caution, and, most importantly, how we’re positioning your strategy to hold up across a range of outcomes.1

Where Valuations Stand

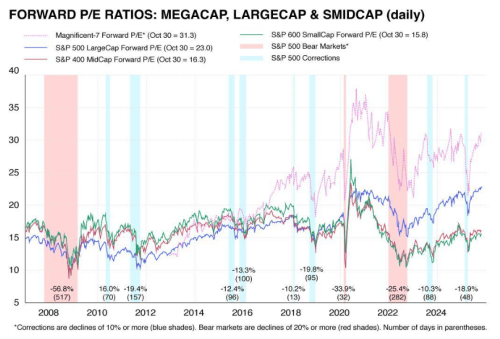
Stock prices have climbed, and by simple measures of “price versus earnings,” the market looks more expensive than its long-term average. That’s a reason for discipline. However, it’s also true that the broad market remains below the most extreme levels reached in the late 1990s. You can see this in the valuation charts that track the relationship between prices and earnings over time.2

What’s Different From Dot‑Com Era

Back then, Barron’s magazine cover story in March 2000, called “Burning Up,” reported that 74% of 207 publicly traded internet companies had “negative cash flows” and at least 51 of those companies were projected to run out of money in the next 12 months. In contrast, today the largest parts of the market are producing real earnings, and overall profit margins across the major U.S. index remain above their five-year average. That doesn’t remove risk, but it does mean prices are supported by business results that we didn’t see from some companies in the dot-com cycle. FactSet’s latest quarterly review provides a good snapshot.3

AI Isn’t Just a Story—There’s Heavy Investment Behind It

A big reason certain companies have led is the build-out of the “plumbing” for AI: data centers, chips, software, and power. You can see this in government data, which shows manufacturing construction near record highs, much of it related to chip facilities, and in rising business spending on information-processing equipment and software. Those are dollars going into real plants, servers, and tools that support future productivity.4,5

Real Fundamentals – But Are AI Profits a Distant Dream?

Today’s AI landscape, where players boast robust business models and real fundamentals stemming from their core businesses, still is not without questions. While fortress balance sheets, resilient revenue, and strong earnings growth remain in place, the central point becomes: does the uncertain return on investment for AI justify the existing valuation levels, even if they aren’t as extreme as the Dotcom era? 

We have to remember that many of today’s leading AI companies still look expensive based on profits they made last year. Meanwhile, the forward looking bull-argument rests entirely on whether their earnings will grow to meet the evergrowing mountain of expectations. 

Intertwining Illusions of Growth

Beyond the frothy valuations, the AI hyperscaler ecosystem can feel like an Ouroboros (i.e.,  a snake that eats its own head). Okay, maybe that’s a bit extreme. However, it doesn’t take away from the increasingly circular dance of chipmakers, cloud providers, and foundational AI companies increasingly investing in one another.

Take for example, Microsoft’s $13billion investment in OpenAi in exchange for OpenAI agreeing to purchase $250 billion in Azure cloud services over the next decade. Microsoft is relying on OpenAI to find real, external customers to honor commitments in due time. 

However, readers should ask – even if OpenAI succeeds in building an Artificial Generative Intelligence (AGI), will there be enough downstream demand for its products and services (especially if AI is displacing jobs)? Or will the primary customer base for AGI simply be the same tech giants who funded its creation? With more interdependence, one setback amongst one of these players could ripple across the entire industry. 

Put simply, today’s “booming” AI revenue isn’t necessarily from new, organic customers with demand for AI services – it’s an internal recycling of investment capital that creates an illusion of growth where economic profit from external customers remains largely hypothetical. While long-term prospects for AI remain strong and we aren’t predicting a bubble, does being invested in an “expensive,” concentrated space predicated on nascent technologies warrant a closer look?  We think it does.

How We’re Managing Your Strategy

That brings us to AI and concentration levels in US Markets. While we’re not sounding alarm bells or declaring an “AI Bubble,” we do recognize concentrated exposure in US Markets (and especially to AI) presents vulnerabilities. That’s why we continue to build adequately diversified portfolios that not only invest around the globe, but also across asset classes such as bonds, gold, and commodities. Recently, we’ve performed a partial rebalance of our market-cap weighted S&P 500 holdings (heavily concentrated to AI) towards US companies with stronger balance sheets and profitability (i.e., “quality” characteristics). Ultimately, we believe we’re in a state where diversifying our client’s sources of “risk” will be prudent for meeting their long-term goals.

If you’d like to meet and discuss how your portfolio is positioned for both stronger and more challenging environments, please give us a call to schedule a meeting.9,10

Bottom line, your portfolio is being actively managed with vigilance and care, and we’re always here if you’d like to discuss further.

Phillip Law, CFA

Senior Portfolio Manager, Warren Street Wealth Advisors

Investment Advisor Representative, Warren Street Wealth Advisors, LLC., a Registered Investment Advisor

The information presented here represents opinions and is not meant as personal or actionable advice to any individual, corporation, or other entity. Any investments discussed carry unique risks and should be carefully considered and reviewed by you and your financial professional. Nothing in this document is a solicitation to buy or sell any securities, or an attempt to furnish personal investment advice. Warren Street Wealth Advisors may own securities referenced in this document. Due to the static nature of content, securities held may change over time and current trades may be contrary to outdated publications. Form ADV available upon request 714-876-6200.
Sources:

1. Insights.com, October 08, 2025. “This Is How the AI Bubble Bursts” https://insights.som.yale.edu/insights/this-is-how-the-ai-bubble-bursts Yale Insights

2. Yardeni.com, 2025. “Stock Market P/E Ratios“ https://yardeni.com/charts/stock-market-p-e-ratios/ Yardeni Research

The S&P 500 Composite Index is an unmanaged index that is considered representative of the overall U.S. stock market. Index performance is not indicative of the past performance of a particular investment. Past performance does not guarantee future results. Individuals cannot invest directly in an index. The return and principal value of stock prices will fluctuate as market conditions change. And shares, when sold, may be worth more or less than their original cost.

The term “Magnificent 7” refers to a group of seven influential companies in the S&P 500, including Apple, Microsoft, Alphabet (Google), Amazon, Nvidia, Tesla, and Meta Platforms.

The S&P MidCap 400 is a benchmark for mid-sized companies. The index is designed to measure the performance of 400 mid-sized companies,

The S&P SmallCap 600 is a benchmark for small-cap companies. The index is designed to track companies that meet inclusion criteria, which include liquidity and financial viability.

3. FactSet.com, October 31, 2025. “Earnings Insight” https://www.factset.com/earningsinsight factset.com

4. Fred.StLouisFed.org, September 25, 2025. “Total Construction Spending: Manufacturing (TLMFGCONS) (manufacturing construction near record highs)” https://fred.stlouisfed.org/series/TLMFGCONS FRED

5. Fred.StLouisFed.org, September 25, 2025. “Private fixed investment in information processing equipment and software” https://fred.stlouisfed.org/series/A679RC1Q027SBEA FRED

6. FederalReserve.gov, October 29, 2025. “Statement” https://www.federalreserve.gov/newsevents/pressreleases/monetary20251029a.htm Federal Reserve

7. Reuters.com, October 29, 2025. “Fed to end balance-sheet reduction on Dec 1, 2025; cuts rates by 0.25%” https://www.reuters.com/business/finance/fed-end-balance-sheet-reduction-december-1-2025-10-29/ Reuters

8. Bloomberg.com, September 30, 2025. “What a US Government Shutdown Means for Markets” https://www.bloomberg.com/news/newsletters/2025-09-30/what-a-us-government-shutdown-means-for-markets Bloomberg 

9. Corporate.Vanguard.com, 2025. “Vanguard’s Principles for Investing Success” https://corporate.vanguard.com/content/dam/corp/research/pdf/vanguards_principles_for_investing_success.pdf Vanguard

10. Morningstar.com, April 1, 2025. “Q1’s Biggest Lesson for Investors: Diversification Works” https://www.morningstar.com/markets/q1s-biggest-lesson-investors-diversification-works

https://warrenstreetwealth.com/wp-content/uploads/2025/11/AI-Headlines-and-Your-Portfolio-Context-That-Helps.png 1080 1080 Phillip Law, CFA https://warrenstreetwealth.com/wp-content/uploads/2014/11/Warren_Street_logo-01.svg Phillip Law, CFA2025-11-19 07:06:002025-11-18 13:15:16Decoding the AI Hype: How Today’s Market Compares to the Dot-Com Bubble
Page 1 of 3123

Recent Posts

  • Navigating Health Insurance Enrollment SeasonSeptember 24, 2026 - 3:20 pm

    As health insurance open enrollment season arrives, reviewing your options is key to making sound financial and healthcare decisions. Learn what factors to evaluate beyond monthly premiums—such as deductibles, out-of-pocket maximums, HSA contribution limits, and special enrollment rules—to select the coverage that best fits your budget and healthcare needs.

  • 5% and Counting: Is the US Treasury Back?September 15, 2026 - 3:30 pm

    With 10-Year US Treasury yields breaching 5%, explore the key economic drivers behind the surge and what higher interest rates mean for stocks and bond portfolios.

  • Beyond the Magnificent Seven: A 2026 Midyear Check-InJuly 29, 2026 - 3:40 pm

    The AI rally has packed its bags: mega-cap tech has stalled while small caps and emerging markets lead 2026 gains. From chip supply chains and rising corporate debt to Federal Reserve policy shifts under Chair Kevin Warsh, we analyze where market risks are building and how we’re positioning portfolios for the road ahead.

  • Meet the Team: Victor Campos, CPA, CFP®July 21, 2026 - 9:05 am

    Get to know Victor Campos, the newest Lead Advisor at Warren Street. Victor utilizes his extensive background as both a Certified Public Accountant (CPA) and Certified Financial Planner™ (CFP®) to deliver holistic financial strategies for our clients. Check out the full interview to discover how his background, values, and dual credentials make him a massive asset to your financial journey.

Categories

  • Basic
  • Chevron
  • Education
  • Financial Planning
  • General
  • Intermediate
  • Investing
  • Quarterly Economic Update
  • Retirement
  • Taxes
  • Uncategorized

Contact Us

(714) 876-6200

hello@warrenstreetwealth.com

Warren Street Wealth Advisors, LLC
200 Spectrum Center Drive, Suite 300,
Irvine, CA 92618

As a Registered Investment Advisor, Warren Street Wealth Advisors, LLC is required to file form ADV to report our business practices and conflicts of interest. Please call to request a copy at 714-876-6200.
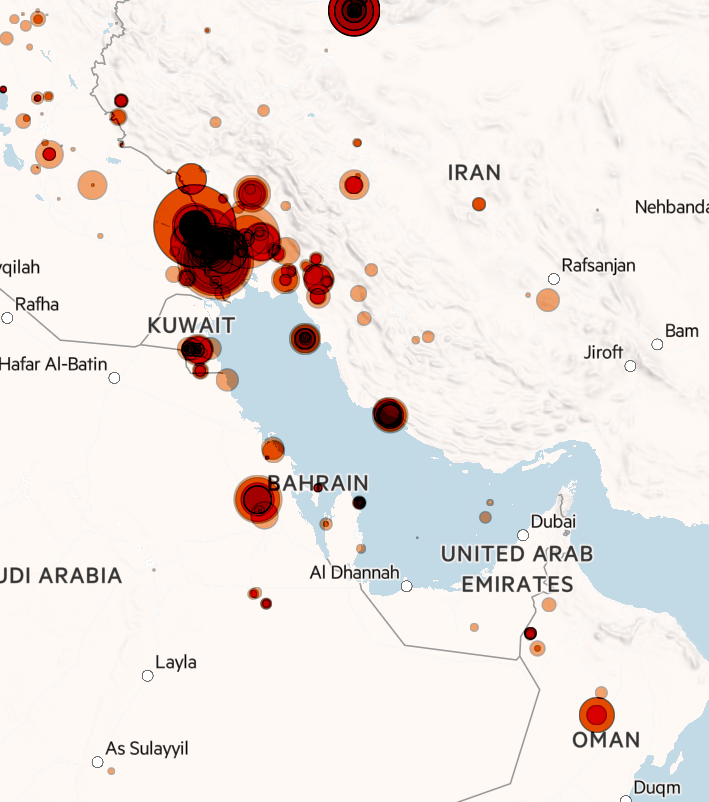
IMPORTANT DISCLOSURE INFORMATION

Stay Connected

© Copyright 2026 - Warren Street Wealth Advisors, LLC - 200 Spectrum Center Drive, Suite 300, Irvine, California 92618 - Enfold Theme by Kriesi
  • Link to Facebook
  • Link to Instagram
  • Link to LinkedIn
  • Link to Youtube
  • Link to Yelp
  • Link to X
  • Link to Mail
Scroll to top Scroll to top Scroll to top