Posts

‘Risk On’ trades take the lead in October

‘Risk On’ trades take the lead in October

Key Takeaways

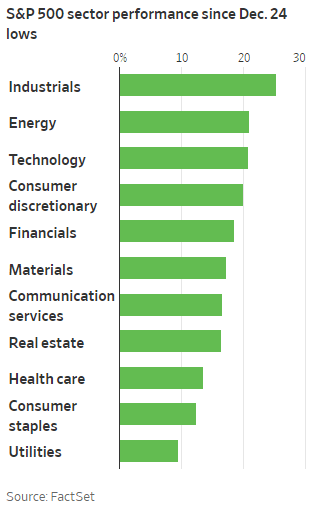
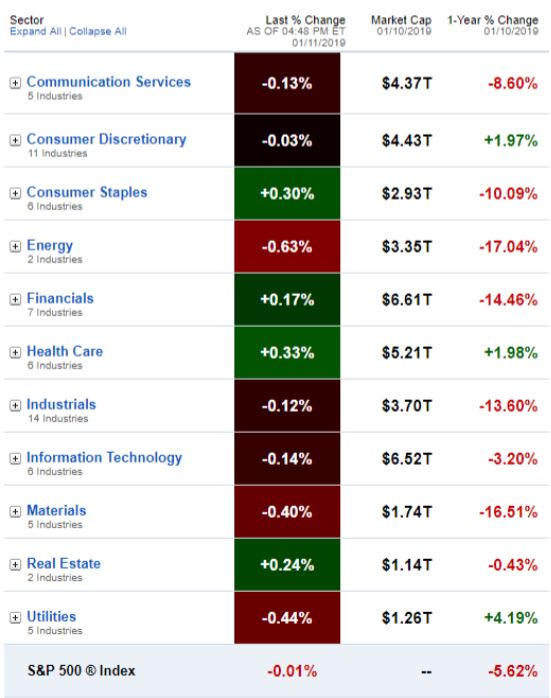
  • U.S. growth stocks and emerging markets jump-started the 4th quarter with returns of 2.82% and 4.22% respectively as investors shifted away from ‘risk off’ assets such as defensive stocks and U.S. Treasury bonds
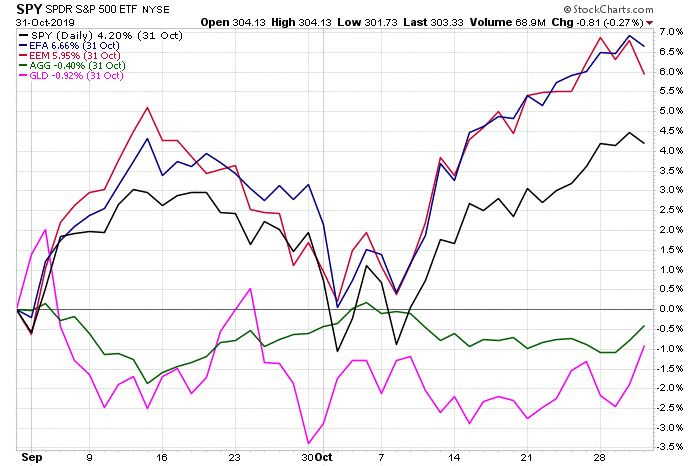
  • The FOMC dropped its federal funds interest rate target for the 3rd time in 2019 to 1.5% – 1.75%. Chairman Powell indicated this cut was the last of the ‘midcycle adjustments’, causing investors to speculate about a pause in rate changes for the next few FOMC meetings.
  • The U.S. and China made progress toward a trade resolution, though the pace and magnitude of the agreement is unclear. Global economies seem to be successfully navigating geopolitical tensions in Hong Kong, unrest in Chile, water wars in Egypt, and the never-ending Brexit saga, among others.
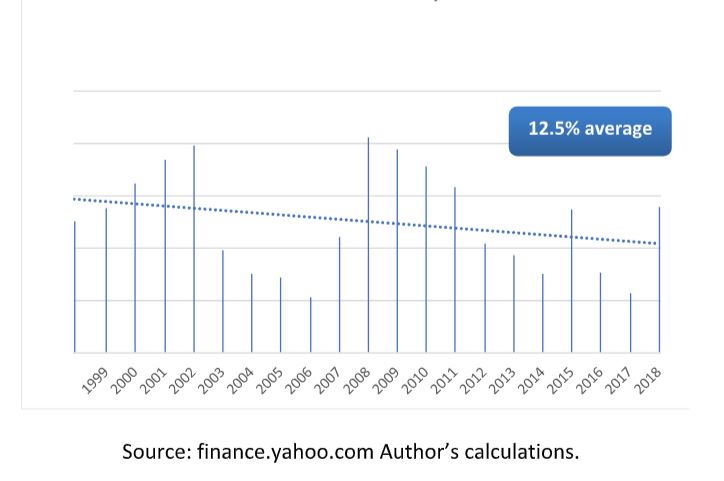
  • Conclusion: Barring a major geopolitical misstep, the U.S. stock market could end the year with a return in the top 25% since 1998. U.S. bonds may end with their best return since 2010.

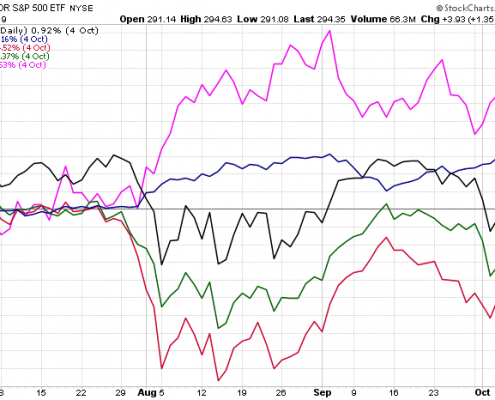
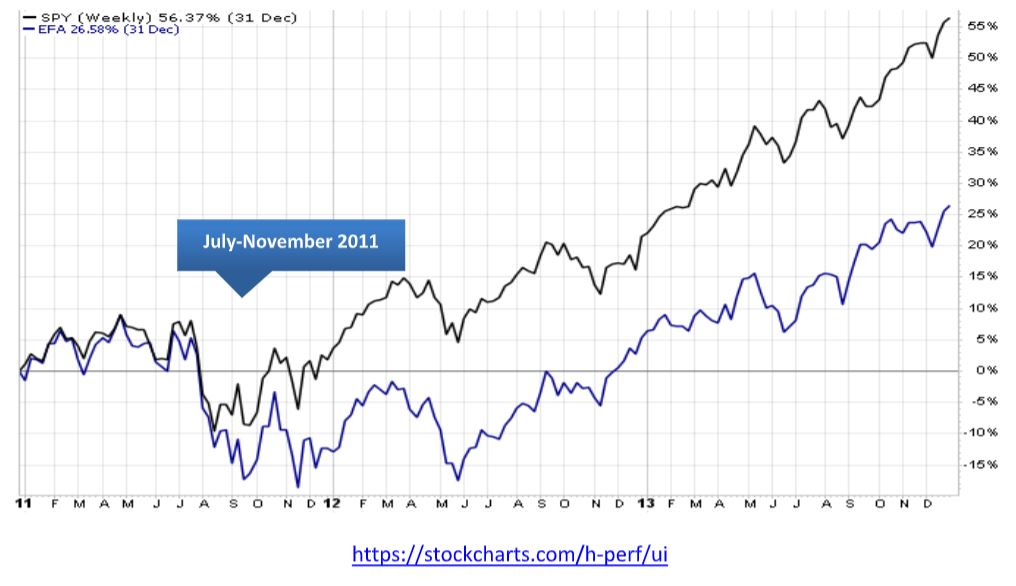
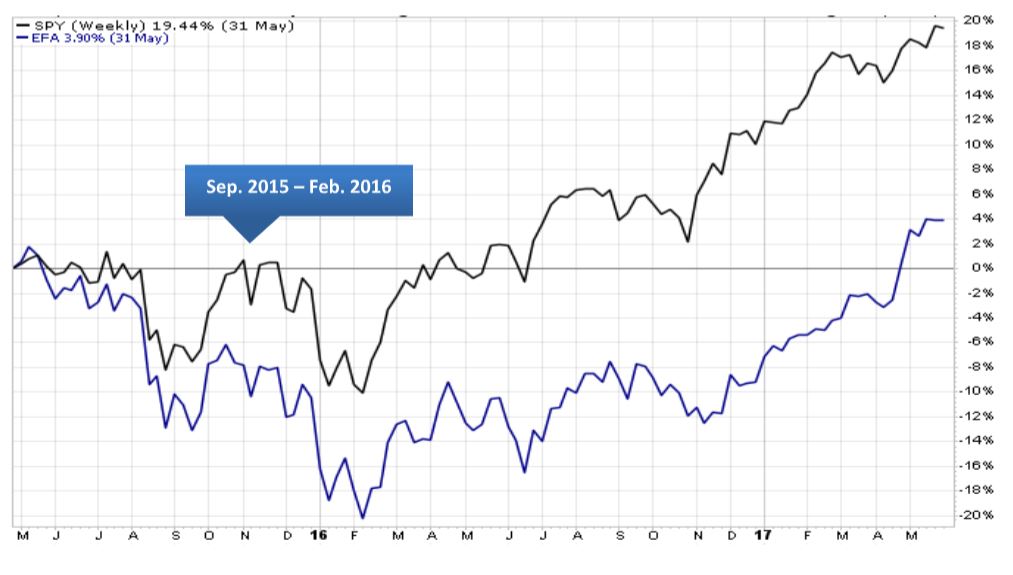
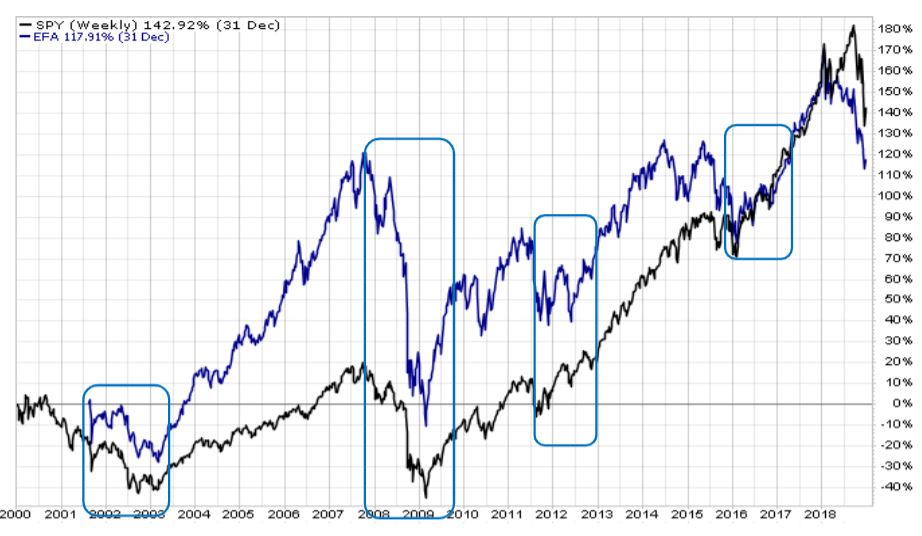
Global stocks begin to close the gap with the U.S.

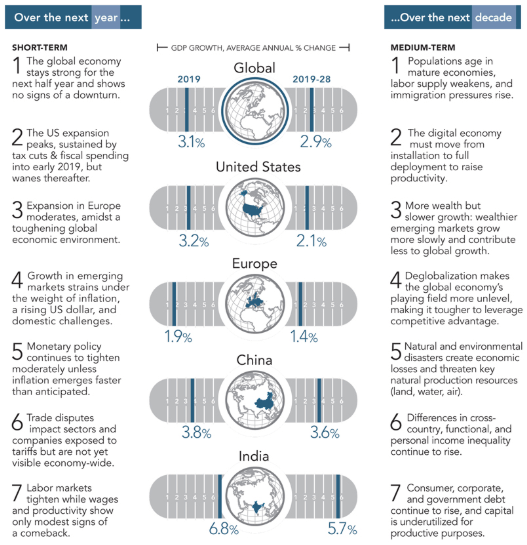
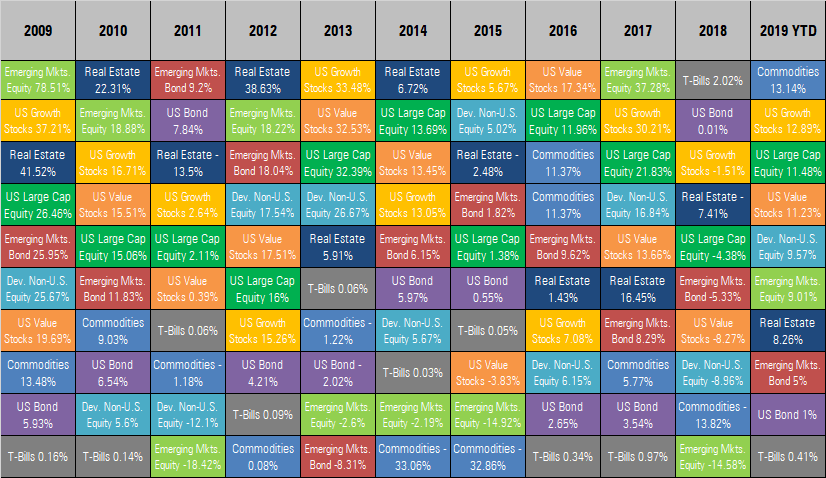
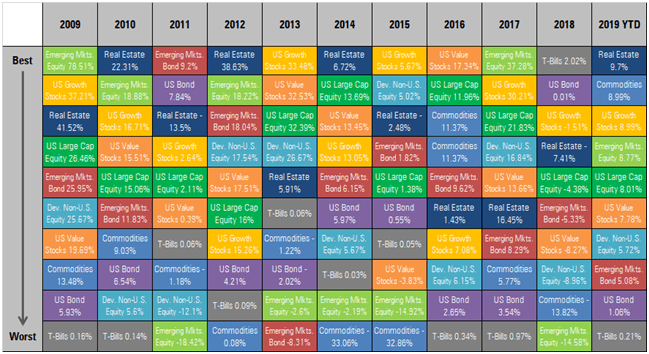
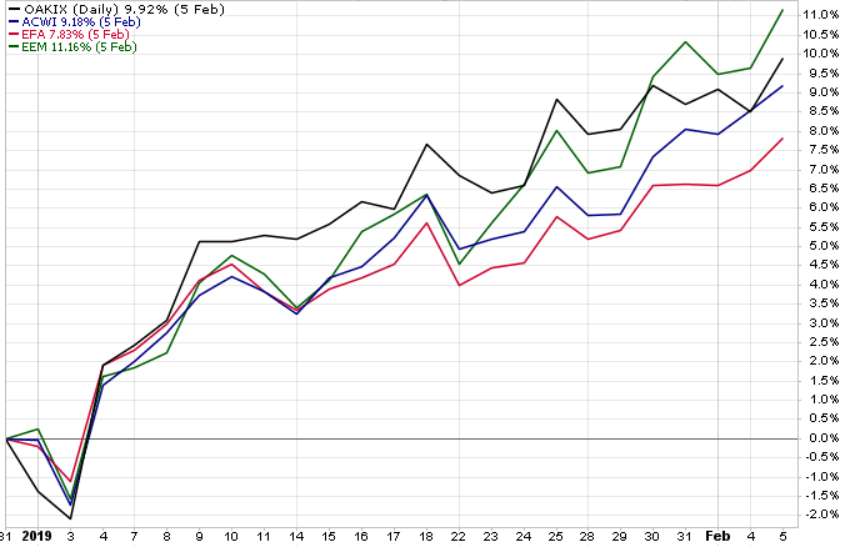
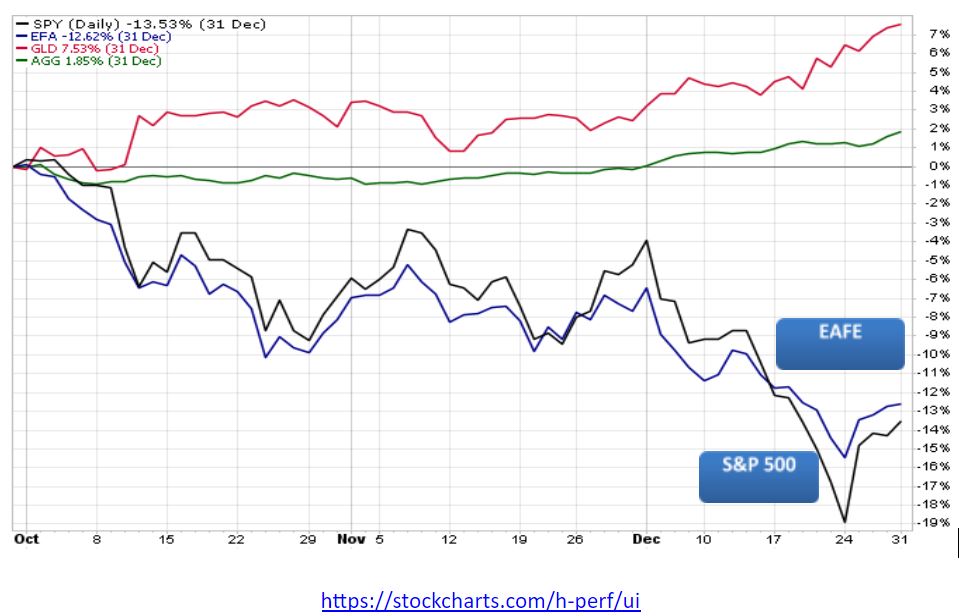
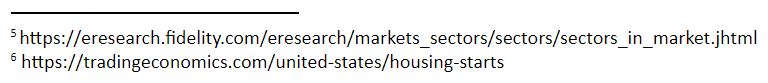
The 4th quarter is off to a great start! Despite a sharp decline the first few days of the month, global stock markets were very strong in October. Emerging Markets equity beat the S&P 500 for the second month in a row, up 4.22% versus 2.17%[1]. In typical ‘risk on’, ‘risk off’ fashion, bonds and gold lagged the field in October. Commodities stayed within sight of the leaders at +1.24% for the month, but U.S. and Emerging Markets bonds were far behind at +0.41% and +0.30%, respectively. For the year-to-date, Europe, Australasia, and Far East (EAFE) is picking up the pace with a return of 20.05% versus 23.16% for the S&P 500. The year-to-date leader as of October 31st is U.S. growth stocks at 26.77%.

https://stockcharts.com/h-perf/ui

This strong start to the 4th quarter can be attributed to progress with China/U.S. trade negotiations and no significant negative news about the other international worries facing the markets: Brexit, political uncertainty in the U.S. and overseas, tensions between Hong Kong and China, and soft business confidence around the world. If none of these go terribly wrong, 2019 is on track to be in the top 25% of S&P 500 stock market returns since 1988[2].

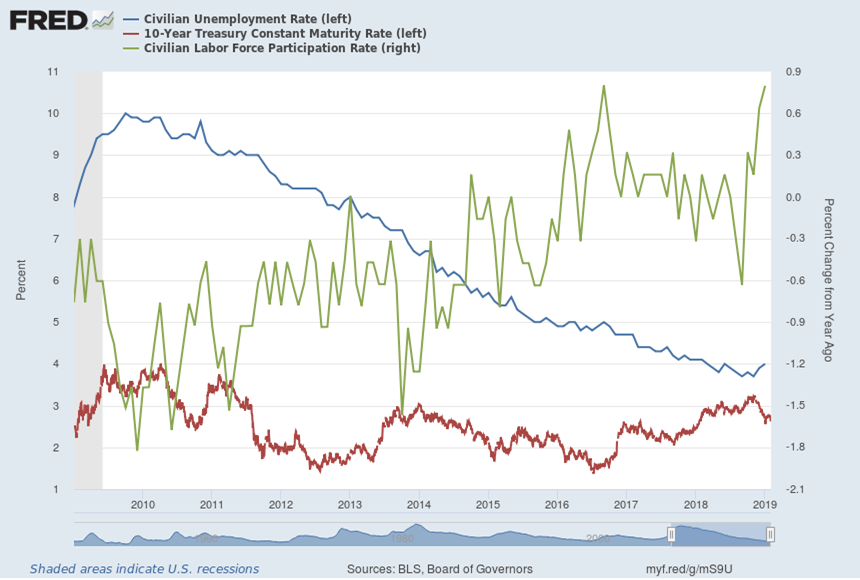
Amid this backdrop of relative stability, the Federal Open Market Committee (FOMC) lowered its short-term target interest rate for the third time in 2019 to a range of 1.5% to 1.75%[3]. Fed Chairman Jerome Powell stated that U.S. economic growth is steady despite continued weakness in business investment and exports, and core inflation is running below the Fed’s 2% target. The October rate cut was characterized as the final ‘midcycle adjustment’ to help support the maturing U.S. economic expansion. Chairman Powell indicated the FOMC will continue to monitor economic activity to determine the appropriate level of the federal funds rate going forward. His remarks did not include previous language about the Fed acting “as appropriate to sustain the expansion”, causing market watchers to expect a pause in rate changes going forward.

Source: BNP Paribas Asset Management, Bloomberg as of 11/4/2019

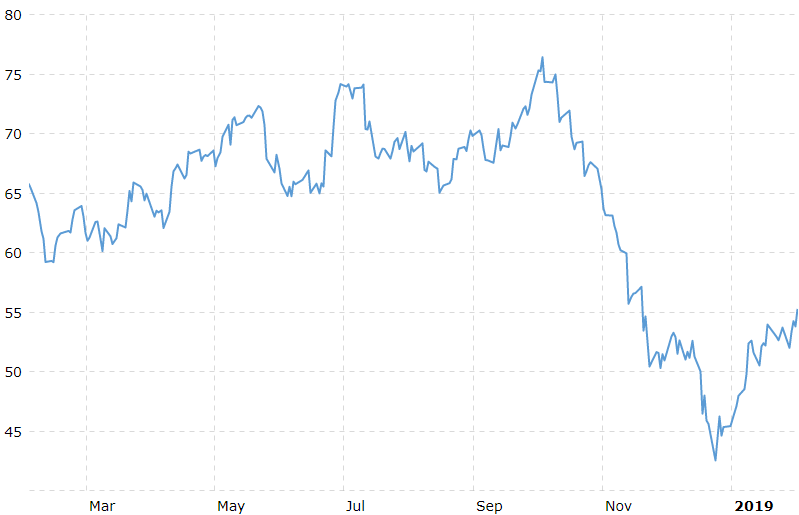
In the days following the rate cut, intermediate and longer-term Treasury yields rose, reversing the yield curve inversion seen for much of 2019 and signaling diminishing investor expectations for a near-term recession.

The return to an upwardly-sloping yield curve is a relief to market watchers. A healthy banking system requires short term rates to be lower than long term rates for banks to maintain consistent profit margins. Higher long-term yields encourage investors to take a longer-term perspective and make more strategic investments. Institutions such as pension plans also have a better chance of satisfying their obligations to future retirees. In general, financial markets do a much better job allocating capital when short-term interest rates are lower than long term rates.

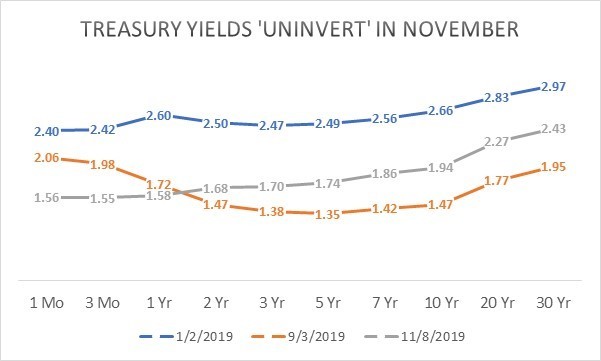
Source: www.treasury.gov

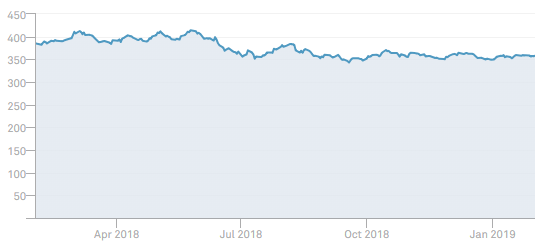
Looking beyond Treasuries, corporate bond yield spreads have drifted back toward the extremely low levels seen in early 2018. This is another indication that investors are comfortable taking risk right now. At Warren Street Wealth Advisors, we’re watching for excessive risk taking which could mean an asset price ‘bubble’ and potentially the end of the stock and bond rally. The occasional drops in market prices we see from time to time are a healthy sign that investors are making rational decisions rather than reckless speculation.

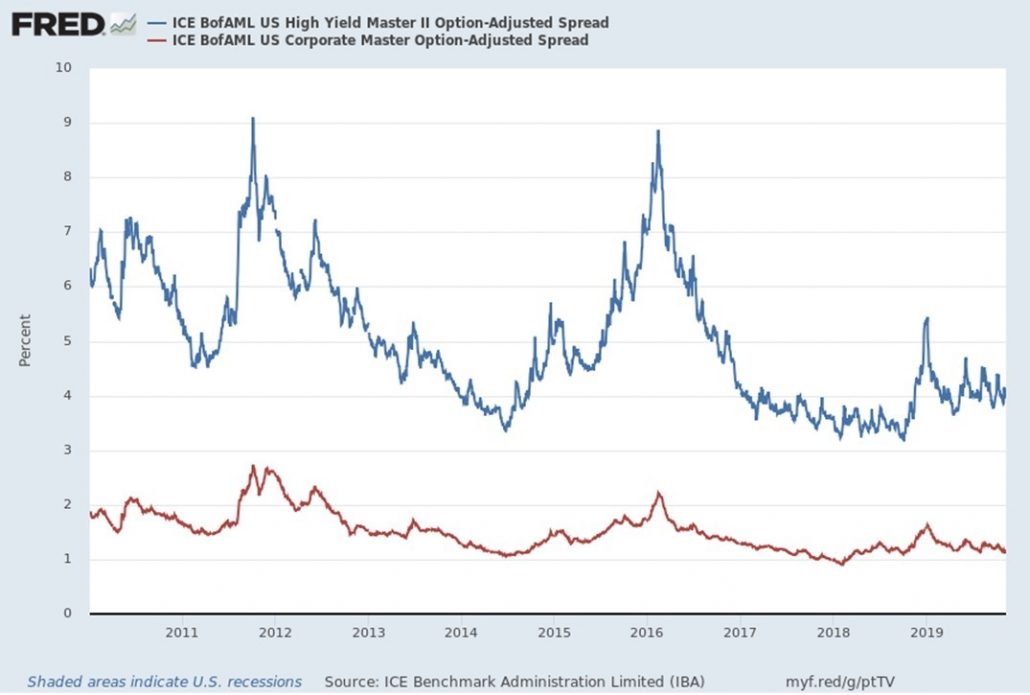
Corporate bond risk premiums drift near historic lows

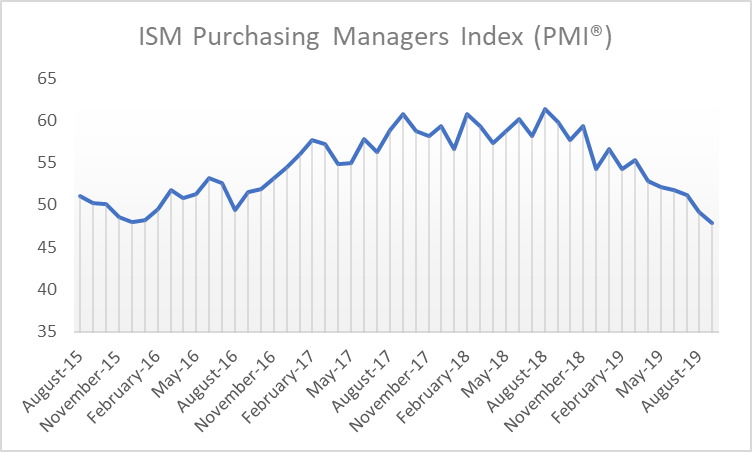
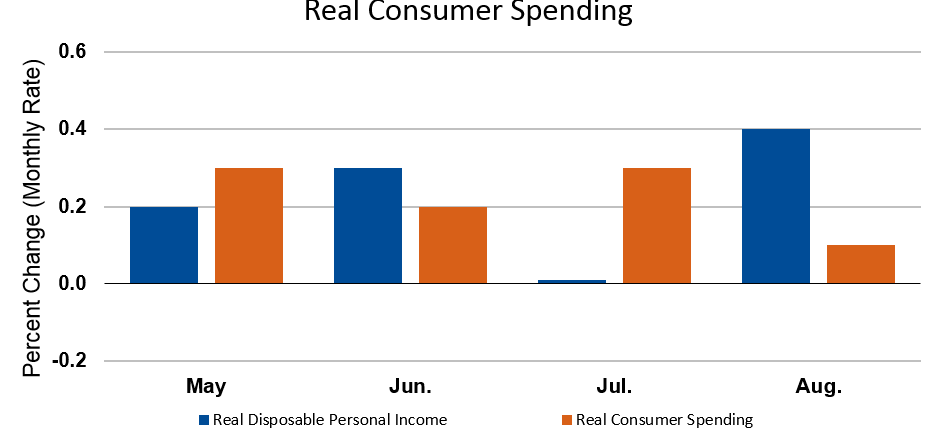
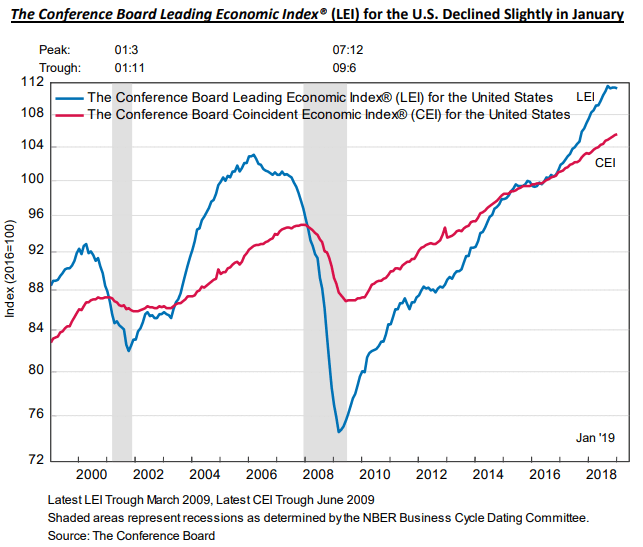
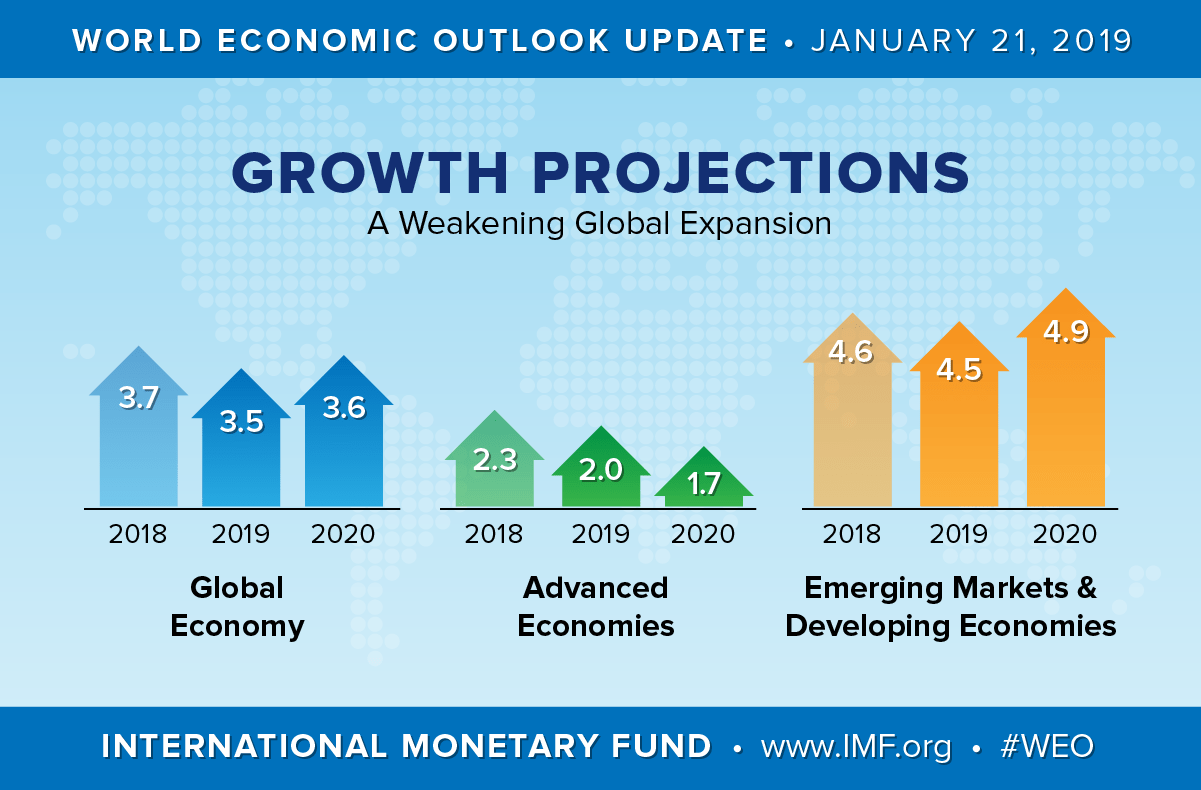
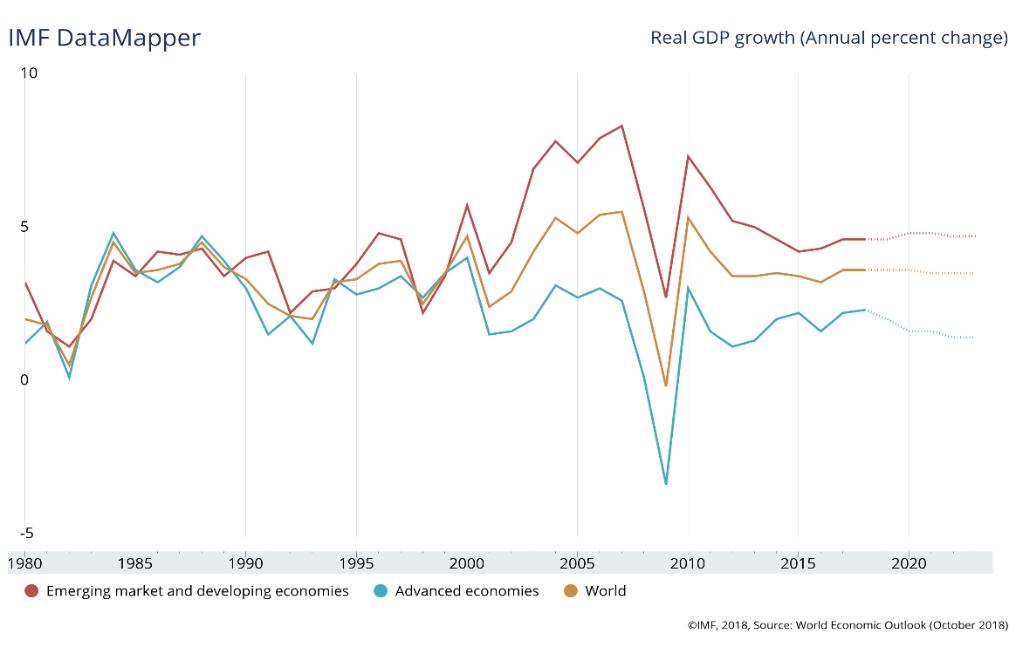
Let’s not forget the global economy, which the Fed has often mentioned as one reason for reducing interest rates this year. Though the data remains mixed, the International Monetary Fund is forecasting global GDP to close 2019 up 3%, with the U.S. at 1.7% and Emerging and Developing Economies up nearly 4%[4]. The IMF expects global growth to improve in 2020 to 3.4% as Europe adjusts to the new tariff landscape and political uncertainties diminish.

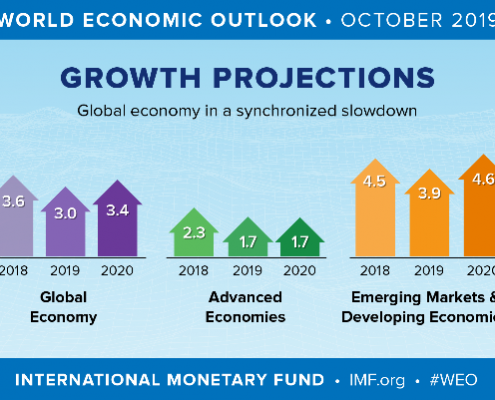
Global GDP projected to remain low but positive

A global recession is highly unlikely through the end of 2020 and probably longer, but there are significant risks to this outlook! The IMF is urging political leaders to defuse trade tensions and reinvigorate multilateral cooperation, rather than focus solely on accommodative monetary policy to keep the world economy afloat.

Bottom line: The U.S. economic expansion remains on track and should end the year well, barring significant missteps in the global economic and political landscape. Though it’s been a bumpy ride, investors are likely to close the books on 2019 with healthy profits from both stocks and bonds, and meaningful progress toward achieving their financial goals.

Marcia Clark, CFA, MBA

Senior Research Analyst, Warren Street Wealth Advisors


DISCLOSURES

Investment Advisor Representative, Warren Street Wealth Advisors, LLC., a Registered Investment Advisor

The information presented here represents opinions and is not meant as personal or actionable advice to any individual, corporation, or other entity. Any investments discussed carry unique risks and should be carefully considered and reviewed by you and your financial professional. Nothing in this document is a solicitation to buy or sell any securities, or an attempt to furnish personal investment advice. Warren Street Wealth Advisors may own securities referenced in this document. Due to the static nature of content, securities held may change over time and current trades may be contrary to outdated publications.

Form ADV available upon request 714-876-6200

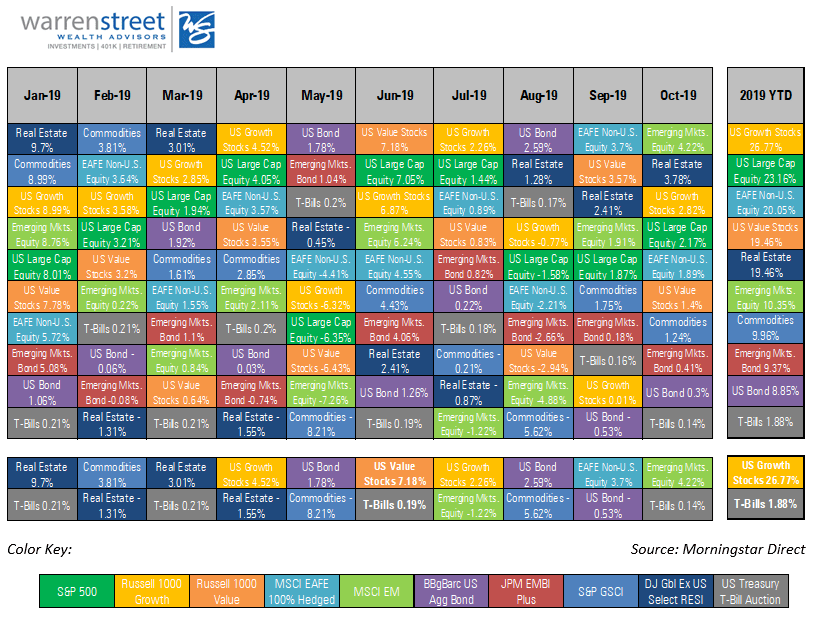
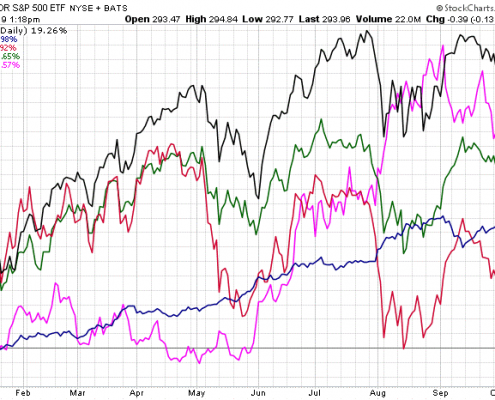
Growth stocks take the lead year-to-date


[1] Performance represented by ETFs designed to track various market segments: SPY (S&P 500), AGG (Barclay’s Aggregate Bond index), EEM (emerging markets equity), EFA (developed international equity), GLD (gold prices)

[2] Source: www.stockcharts.com

[3] https://www.federalreserve.gov/monetarypolicy/files/monetary20191030a1.pdf

[4] https://www.imf.org/en/Publications/WEO/Issues/2019/10/01/world-economic-outlook-october-2019

September 2019 Market Review

With competing economic data, where should investors turn?

Oil shocks, impeachment, and Brexit – Oh My!

Key Takeaways

  • U.S. stock and bond markets closed the 3rd quarter with an impressive – though volatile – year-to-date return. The S&P 500 index ended September up nearly 19%, the best 3-quarter return since 1997, while the Barclays Aggregate Bond index posted an outstanding return near 8%.
  • Economic data remained mixed. The U.S. Consumer Confidence index fell by -9.1%, much more than expected, but unemployment fell to 3.5%, the lowest in 50 years.
  • The House of Representatives initiated an impeachment investigation of President Trump after a ‘whistleblower’ leaked information about the President asking Ukrainian officials to investigate Democratic candidate Joe Biden’s son.
  • Drone strikes on Saudi Arabian oil installations shut down 50% of Saudi oil production, about 5% of world production, briefly sending oil prices off the rails and adding to recession fears.
  • Prime Minister Boris Johnson was deemed to have acted illegally by shutting down the U.K. Parliament, putting pressure on him to come to a Brexit resolution with the European Union.
  • Conclusion: The U.S. economy remains on track for a good year. Despite the markets’ willingness to shrug off trade wars and geopolitical uncertainty, significant challenges are still out there. Investors should prepare  for renewed market turbulence as these issues resolve themselves over the coming months.

Stock and bond markets rebound from August’s slump

The 3rd quarter was quite a roller coaster ride! Gold and other ‘safe’ assets were the go-to market segments for the quarter. Gold led the way with a return of +4.26%[1], despite a slip in late September. U.S. bonds took second place, edging out U.S. stocks with a return of 2.34% versus 1.75%. International stocks were the top performers in September at +3.7%, but continued to lag the U.S. for the quarter at -0.79%. Emerging markets equities were in second place for the month at +1.91%, but are far behind for the year and quarter, losing -4.75% between July 1st and September 30th.

Market returns 7/1/2019 – 10/4/2019

https://stockcharts.com/h-perf/ui

The financial markets continued to react strongly to economic news and geopolitical events, though the magnitude of the swings began to subside. This moderation is a bit surprising given the unexpected -9% drop in Consumer Confidence and the Purchasing Manufacturers Index falling to its lowest level since June 2009. But investor fatigue is bound to set in sooner or later, and current events just seem to build on a base with which investors have become wearily familiar.

Source: https://ycharts.com/indicators/us_pmi

The economy created only 136,000 new jobs in September – certainly nothing to brag about, but good enough this late in the expansion. At the same time, the unemployment rate fell to 3.5% – the lowest in half a century – and the overall employment ratio increased to 61%, the highest since December 2008. Apparently, the U.S. job market is alive and well…at least for the time being.

Despite competing political and economic pressures, U.S. and developed international stock markets are on track for a very strong year. As of October 7, the S&P 500 was up more than 19%, gold was up over 16%, and the Europe, Australasia, and Far East index was up nearly 12%. But be wary of another 4th quarter slump like we saw in 2018! Given mixed economic data, the impeachment inquiry of President Trump, and continuing trade tensions, any of these could derail the markets – at least temporarily – between now and December 31st.

Market returns 1/1/2019 – 10/4/2019

https://stockcharts.com/h-perf/ui

One of the less-reported casualties in the U.S.-China trade war is the agricultural sector. Inflation-adjusted prices for corn, wheat, and soybeans have been declining for decades, largely due to increased productivity and reduced global population growth. Add trade tariffs and the wettest 12 months on record[3], and farmers are facing a ‘perfect storm’ of negative events. Smaller farms are going out of business, and the number of farms in the U.S. is heading below 2 million, the lowest in nearly a century.

But despite the significant challenges facing the agriculture and manufacturing sectors, the U.S. economy is holding steady. Personal income and consumer spending rose in August for the second month in a row. Retail sales were good, and housing showed signs of renewed activity.


As reported by the Wall Street Journal on September 25, U.S. home-price growth is slowing and mortgage rates are historically low at around 4%[4]. With such low interest rates, home price affordability remains within reach as indicated by the sharp drop in the Case-Shiller Home Price Index in 2019, shown on the chart above.

Forecasters expect housing to contribute slightly to GDP for the first time since 2017 as home sales and construction increased in August.

With so much going on in the world, it’s hard to know which direction to turn! For a straightforward summary of the likely impact of these competing economic factors on global growth, we refer you to the graphic below prepared by The Conference Board (publisher of the Leading Economic Indicator index.)

The Conference Board economic outlook

Bottom line: the U.S. economy is on track for solid growth in 2019, slowing somewhat thereafter. A recession is not in the forecast for the next 12 months, though demographic factors point to slower growth worldwide in the coming years.

Given the myriad challenges facing the global economy right now, negative surprises are definitely a possibility as we navigate the final quarter of 2019. Investors may just have to close their eyes, hold on tight to a prudent investment plan, and ride out the inevitable turbulence in the coming months.

Marcia Clark, CFA, MBA

Senior Research Analyst, Warren Street Wealth Advisors


DISCLOSURES

Investment Advisor Representative, Warren Street Wealth Advisors, LLC., a Registered Investment Advisor

The information presented here represents opinions and is not meant as personal or actionable advice to any individual, corporation, or other entity. Any investments discussed carry unique risks and should be carefully considered and reviewed by you and your financial professional. Nothing in this document is a solicitation to buy or sell any securities, or an attempt to furnish personal investment advice. Warren Street Wealth Advisors may own securities referenced in this document. Due to the static nature of content, securities held may change over time and current trades may be contrary to outdated publications.

Form ADV available upon request 714-876-6200

[1] Performance represented by ETFs designed to track various market segments: SPY (S&P 500), AGG (Barclay’s Aggregate Bond index), EEM (emerging markets equity), EFA (developed international equity), GLD (gold prices)

[2] Performance represented by ETFs designed to track various market segments: SPY (S&P 500), AGG (Barclay’s Aggregate Bond index), EEM (emerging markets equity), EFA (developed international equity), GLD (gold prices)

[3] https://www.wsj.com/graphics/us-farmers-miserable-year/?mod=article_inline&mod=hp_lead_pos5

[4] https://blogs.wsj.com/economics/2019/09/25/newsletter-housings-maybe-rebound-chinas-decoupling-warning-and-consumers-cloudy-crystal-ball/?guid=BL-REB-39607&dsk=y

Did the Fed make a mistake? – “A Few Minutes with Marcia”

Welcome back to A Few Minutes with Marcia. My name is Marcia Clark, senior research analyst at Warren Street Wealth Advisors.

Today we’re going to spend a few minutes considering the pros and cons of the Federal Reserve Open Market Committee holding short-term interest rates steady at its June meeting. Most of my comments today are based on the FOMC announcement published on June 19, the press conference with Chairman Jerome Powell shortly thereafter, and remarks by Federal Reserve Governor Lael Brainard on June 21st.

Watch:


On June 19, the Federal Reserve Open Market Committee announced its decision to keep short-term interest rates unchanged at 2.25%-2.5%. Did they make a mistake?

To answer this question, let’s put ourselves in the shoes of the Fed and attempt to base our opinion on the available data. The Fed should reduce rates if they see the economy struggling. Is that what they see?

During a speech in Cincinnati on June 21st, Fed Governor Lael Brainard stated his assessment that the most likely path for the economy remains solid. He noted strength in consumer spending and consumer confidence, as well as unemployment at a 50-year low.

He did note a few areas of concern: cautious business investment due to policy uncertainty, slow growth overseas, and muted inflation.

  • Mr. Brainard said: “The downside risks, if they materialize, could weigh on economic activity. Basic principles of risk management in a low neutral rate environment with compressed conventional policy space would argue for softening the expected path of policy when risks shift to the downside.” But what does he mean by ‘compressed conventional policy space’?

The Fed has limited room to maneuver because interest rates are already low, and inflation and employment have not responded to changes in interest rates as predictably as they have in the past. 

  • On the plus side, this means the labor market can strengthen a lot without an acceleration in inflation
  • On the other hand, this low sensitivity along with already low interest rates gives the Fed less ability to buffer the economy in a downturn


If the Fed doesn’t get their interest rate call right, the economy could begin to spiral too far up or too far down.

Let’s take a deeper look at why low interest rates present a challenge for the Fed.

  • In the past, the Federal Reserve has cut interest rates 4 to 5 percentage points in order to combat past recessions
  • The chart on slide 6 shows the current Fed Funds rate sitting at less than half where it was before the last two recessions. 
  • Clearly there is less room to run if a recession hits


The chart also shows GDP beginning to stabilize at the end of 2016. With GDP on a more steady path, back in 2017 the Fed started raising short-term interest rates toward a more normal level in order to have some ‘dry powder’ for the next recession.

How did we get to this delicate balance point?

In December 2018, the Fed said more rate hikes were appropriate given the strengthening economy. The stock market reacted badly as at the same time trade talks with China were going nowhere and portions of the Treasury yield curve were inverted. Recession fears were on everyone’s mind.

In March 2019, Federal Reserve officials reassure markets that they will be “patient” with increasing short-term interest rates. To quote the FOMC statement after the March meeting: “the case for raising rates has weakened…” Notice that they didn’t say the case for cutting rates has strengthened.

And in June, the FOMC held interest rates steady and stated that the current level of interest rates is consistent with its mission to promote full employment and price stability. In its post-meeting statement, the committee said that the timing and size of future adjustments will be based on economic conditions relative to these two objectives. 

After the announcement, both stocks and bonds reacted positively to the decision, with the stock market indexes touching new highs before falling back a bit at the end of the week. 

Commentators speculated that the markets reacted well because a rate cut could be imminent. Equally likely, however, is that the markets reacted to the lack of a rate hike and prospects that a recession is not around the corner. 

During a press conference after the announcement, Fed chairman Jerome Powell responded to a question by saying that being independent of political pressure or market sentiment has served the country well and would do so in the future. He stated that the FOMC will react to data and trends that are sustainable rather than individual data points that can be volatile

But despite all the evidence, as we approach the end of June an astonishing 100% of futures investors are betting on a rate cut in July. These investors are wrong. 

Why am I so sure they won’t cut rates when commentators and the futures market clearly think differently?

You may have heard the expression ‘pushing on a string’. What this means is that applying force to something with no rigidity won’t have any impact – the string absorbs the force and the force doesn’t go any further. This is the current situation with monetary policy.

Imagine pushing a sofa across your carpeted living room versus pushing a mattress across the same room.

Once the feet of the sofa get out of the dent they made in the carpet, the sofa will move fairly easily. That’s because the sofa is rigid – when you apply force at one end, the sofa moves away from the force.

But a mattress is much more resistant to shifting. That’s because much of the force you apply is absorbed by the cushioning already in the mattress. The mattress will often bend before it will move. The force doesn’t go anywhere or accomplish anything.

The current U.S. economy is like the mattress in this example. The U.S. economy has plenty of available capital and interest rates are already low. Reducing the Fed Funds target from 2.375% to 2.00% is unlikely to accomplish much other than encouraging unwise borrowing and ultimately sparking inflation.

Yes, bad things can happen to our economy and the Fed needs to guard against a recession. But a recession overseas is much more likely than in the U.S., and no U.S. recession has ever been caused by a recession overseas. Dropping interest rates to ease market concerns or satisfy political sentiment is not the Fed’s mandate and would be counterproductive.

Barring some catastrophic political event or natural disaster, the U.S. economy is unlikely to falter between now and mid-July. 

Recognizing the Fed’s dual mandate of stable prices and full employment are both being met at the current level of short-term interest rates, right now the downside risk of lowering rates outweighs the potential stimulus benefit. The FOMC should keep the Fed Funds rate steady when they meet in July.

This has been ‘A Few Minutes with Marcia’. I hope you are a bit clearer on how to assess the likelihood of Fed policy decisions going forward. As always, comments and questions are welcome!

Sources:


Marcia Clark, CFA, MBA
Senior Research Analyst
Warren Street Wealth Advisors

Warren Street Wealth Advisors, a Registered Investment Advisor. The information contained herein does not involve the rendering of personalized investment advice but is limited to the dissemination of general information. A professional advisor should be consulted before implementing any of the strategies or options presented. Any investments discussed carry unique risks and should be carefully considered and reviewed by you and your financial professional. Past performance may not be indicative of future results. All investment strategies have the potential for profit or loss. 


DISCLOSURES

Investment Advisor Representative, Warren Street Wealth Advisors, LLC., a Registered Investment Advisor

The information presented here represents opinions and is not meant as personal or actionable advice to any individual, corporation, or other entity. Any investments discussed carry unique risks and should be carefully considered and reviewed by you and your financial professional. Nothing in this document is a solicitation to buy or sell any securities, or an attempt to furnish personal investment advice. Warren Street Wealth Advisors may own securities referenced in this document. Due to the static nature of content, securities held may change over time and current trades may be contrary to outdated publications.

Form ADV available upon request 714-876-6200

2019 Started with a Roar!

WSWA Monthly Market Commentary for February 2019

Key Takeaways

    • Commodities took the lead in February with a year-to-date return of 13.14% as oil prices recovered from the supply/demand imbalance during the second half of 2018
    • The S&P 500 index is on pace for its biggest early-year advance in nearly 30 years, due in part to diminished investor fears about the impact of trade tensions and slowing pace of interest rate hikes
    • Forward-looking economic data is mixed: S&P 500 companies expect earnings growth to slow, but the Conference Board’s Leading Economic Indicators remain strong
    • Overseas tensions continue as the U.K. has yet to approve a ‘Brexit’ plan, trade tariffs put pressure on global economic growth, and high levels of public and private debt reduces central bank flexibility
    • Conclusion: Global economies are slowing but unlikely to enter a recession in 2019, providing support for U.S. financial markets. Market performance around the world is likely to be positive though with mixed results across developed and emerging economies.

Energy takes the lead with an impressive year-to-date return over 23%.

2019 started with a roar as commodities streaked off the starting line, gaining 13.14% in January and February (combined). The biggest winner was the Energy sector leaving everything else in the dust with an impressive 23.48% return. The rebound in oil prices was fueled in part by ongoing supply reductions by OPEC and diminishing trade tensions between the U.S. and China. Going forward, U.S. shale oil production capacity should keep a lid on oil prices despite efforts by OPEC countries to keep prices higher.

wti

Source: www.cnbc.com

1. https://us.spindices.com/performance-overview/commodities/sp-gsci
2. Source: Morningstar Energy sector analyst report

Global stocks were not left in the dust.

Despite the recent downturn, the S&P 500 is on pace for its strongest start in recent memory. This impressive performance was felt broadly across market sectors, led by Industrial companies and followed closely by Energy, Technology, and Consumer Discretionary firms.

Global stocks

Thankfully, U.S. stock market volatility as measured by the Chicago Board Options Exchange Volatility Index (VIX) calmed down from the frantic pace of the 4th quarter, perhaps due to investor fatigue as much as anything else. In truth, news has indeed gotten better: the FOMC indicated it would remain patient with the pace of normalizing interest rates; trade negotiations with China are progressing toward a workable conclusion; and corporate earnings for the 4th quarter are coming in better than investors feared.

vix

Source: www.bloomberg.com

3. https://www.wsj.com/articles/history-shows-stock-rally-could-have-more-legs-11550840401

International stocks are also benefiting from economic and political tailwinds, pulling slightly ahead of the U.S. in February with a return of 3.58% versus 3.21% for the S&P 500. The U.S. remains in the lead year-to-date: +11.48% compared to +9.57% for the developed markets equity index (MSCI ACWI.) Emerging Markets stocks are solidly in the middle of the pack at 0.22% in February and 9.01% year-to-date. U.S. bonds lagged the field with a negative return of -0.06% in February and 1.0% year-to-date, despite over $25 billion of inflows from mutual fund investors fleeing the stock market volatility of the 4th quarter 2018.

Asset Class Winners and Losers as of February 2019

Asset Class Winners and Losers as of February 2019

Source: Morningstar Direct

4. Source: Morningstar Direct
5. https://ici.org/research/stats/flows

With such a great start to the year, you might be wondering “where do we go from here?”

As reported in the Wall Street Journal and calculated by Dow Jones Market Data, the U.S. stock market continues in the same direction it started 64% of the time. Whether this relationship will apply in 2019 depends to some degree on the cause of the strong start. Given the sharp sell-off in the 4th quarter of 2018, some of the rally in early 2019 is likely attributed to stock prices finding a more rational foundation after being oversold, with the remainder based on fundamental factors outlined above. These aren’t powerful reasons for the rally to continue the rest of the year, but no reason to decline either.

It is encouraging to see Industrials leading the way rather than Technology, as the returns of industrial companies tend to be more closely tied to longer term economic trends. The breadth of the rally is also hopeful, as the number of stocks rising versus falling each day hit new highs in February.

Another bright spot is the Conference Board’s ‘Leading Economic Indicators’ index which remains strong despite declining a bit in January.

conference board

6. Source: Dow Jones Market Data

What could go wrong?

On the less optimistic side of the equation, most S&P 500 companies are forecasting earnings growth to slow in 2019. Overseas, economic tensions persist as the U.K. has yet to come up with a ‘Brexit’ deal acceptable to both the European Union and the British Parliament, and trade tariffs are hitting European automakers particularly hard. Add to this the worrisome growth of debt among many public and private entities worldwide, including the U.S. government, leaving central banks with less flexibility if the global economy stumbles.

The International Monetary Fund recently published an eye-opening study about the amount of debt accumulated around the world. (see chart below) The large light blue circle in the ‘Advanced Economies’ section at the top of the chart represents U.S. public and private debt at 256% of GDP. Japan is the green circle at the top right with nearly 400% debt to GDP(!), and Germany is the medium blue circle at the top left with 171% debt.

The dark blue circle in the middle ‘Emerging Markets’ section represents the debt load of mainland China at 254%. The lower section reflects ‘Low Income’ countries including Bangladesh, the light blue circle in the middle with 76% debt, and Vietnam in dark blue at the far right of this group with 189% debt to GDP.

Global Public and Private Debt as a Percent of GDP

Global Public and Private Debt as a Percent of GDP

7. https://blogs.imf.org/2019/01/02/new-data-on-global-debt/

Is all this debt a problem, especially for the U.S. government with over $22 trillion debt outstanding?

You might be comforted to know that though the U.S. government debt load is growing ever higher – due in some part to the ever-expanding U.S. economy – the interest servicing cost is only 1 ½% of GDP, compared to about 3% of GDP in the much higher interest rate environment of the 1980s and 1990s.

 interest rate

Source: www.treasurydirect.gov

As long as government borrowing and spending doesn’t ‘crowd out’ the private sector capacity to lend and spend, the debt shouldn’t be a problem. However, if government debt becomes so large that the government’s need to borrow pushes up interest rates for the rest of us, the economy could slow, kicking off a vicious cycle of unsustainable borrowing to keep the economy afloat. But there’s no need to panic just yet! Government debt is nowhere near the danger level and is unlikely to get there any time soon.

How do we weigh the positive and negative economic data?

Based on the available information, it’s hard to say whether 2019 will be an outstanding year for financial assets, below average, or somewhere in between. The International Monetary Fund is forecasting an economic slowdown – not a recession – across most developed markets in 2019 and 2020 (including Europe and the U.S.)

Growth Projections

On balance, there is enough positive data to support the case that a recession is not on the horizon. This outlook is becoming more widely held, which should enable the financial markets to hold their position and cross the finish line in positive territory by the end of 2019.

As always, the investment team at Warren Street Wealth Advisors will keep a sharp lookout for confirming or contrary evidence as the year unfolds, and will base our investment decisions on the best information we can find. While the future remains unclear, we promise to keep you informed as we journey forward.

8. https://www.treasurydirect.gov/NP/debt/current
9.https://www.ftportfolios.com/Commentary/EconomicResearch/2019/2/22/debt,-the-economy-and-stocks
10. https://www.investopedia.com/terms/c/crowdingouteffect.asp

Quiz:

Referring to the IMF ‘Debt Around the World’ blog post at https://blogs.imf.org/2019/01/02/new-data-on-global-debt/, which of the following countries has the largest debt as a percent of GDP, including both government and private entities? (Hint: click on the link, then move your mouse over the circles to see the details for each country)

  1. United States
  2. China
  3. Japan
  4. Germany

If you’re the sort of person who likes to draw your own conclusions, we highly recommend the IMF website from which we source much of our global information. Click on this link to see global economic data: https://www.imf.org/external/datamapper/NGDP_RPCH@WEO/OEMDC/ADVEC/WEOWORLD

Answer below…


Marcia Clark, CFA, MBA
Senior Research Analyst
Warren Street Wealth Advisors

Warren Street Wealth Advisors, a Registered Investment Advisor. The information contained herein does not involve the rendering of personalized investment advice but is limited to the dissemination of general information. A professional advisor should be consulted before implementing any of the strategies or options presented. Any investments discussed carry unique risks and should be carefully considered and reviewed by you and your financial professional. Past performance may not be indicative of future results. All investment strategies have the potential for profit or loss. 


DISCLOSURES

Investment Advisor Representative, Warren Street Wealth Advisors, LLC., a Registered Investment Advisor

The information presented here represents opinions and is not meant as personal or actionable advice to any individual, corporation, or other entity. Any investments discussed carry unique risks and should be carefully considered and reviewed by you and your financial professional. Nothing in this document is a solicitation to buy or sell any securities, or an attempt to furnish personal investment advice. Warren Street Wealth Advisors may own securities referenced in this document. Due to the static nature of content, securities held may change over time and current trades may be contrary to outdated publications.

Form ADV available upon request 714-876-6200


Quiz Answer: Japan


WSWA Monthly Market Commentary

WSWA Monthly Market Commentary for January 2019

Key Takeaways

  • All major asset classes were up strongly in January, one of the best yearly starts in recent memory, despite the month-long partial government shutdown in the U.S. and continuing uncertainty internationally about the economic impact of trade tariffs and the U.K. ‘Brexit’ negotiations
  • Global real estate took the lead with a monthly return of 9.7%, followed by commodities and U.S. growth stocks at 9% each. The S&P 500 posted an 8% return for the month
  • Recession fears in the U.S. receded as job growth was strong despite the unemployment rate edging up to 4%;Corporate profits continued to grow in the 4th quarter of 2018, though will slow in 2019
  • Fears of a recession due to rising interest rates diminished with Federal Reserve officials holding short-term rates steady at their January meeting and commenting on being ‘patient’ with future rate increases

What a way to start the year!

All major asset classes were up strongly in January, one of the best yearly starts in recent memory, despite the month-long partial government shutdown in the U.S., continuing uncertainty about trade tariffs’ impact on international growth, and the failure of U.K. ‘Brexit’ negotiations.

Global real estate took the lead among major asset classes with a monthly return of 9.70%, followed by commodities and U.S. growth stocks at 8.99% each. The S&P 500 gained 8.01% for the month, with emerging markets equities up 8.77% and developed international equities up 5.72%. U.S. bonds also had a strong month, rising 1.06%.

Morningstar Direct

Source: Morningstar Direct

Among commodities, crude oil prices led the way with a strong rebound from the December 24th low of $42.53, ending the month at $53.79. The S&P GSCI Agriculture index, the second largest component of the S&P GSCI index, stabilized after declining steadily in recent years[1].

West Texas Crude Oil Price

Source: www.macrotrends.net

GSCI Agriculture Index

GSCI Agriculture Index

International equity markets are well priced for future growth.

Emerging Markets equities (EEM) led the international equity markets in January, followed by the MSCI All Country World Index (ACWI), with Europe, Australasia, and Far East (EAFE) markets not far behind.


[1]https://us.spindices.com/indices/

European markets posted solid returns despite Prime Minister Theresa May’s Brexit plan being voted down by Parliament. After the Brexit agreement was rejected, Prime Minister May survived a ‘no confidence’ vote and promised renewed efforts to negotiate an acceptable exit plan with European Union leadership.

According to Harris Associates, manager of the Oakmark International fund, international markets have been the victim of “overly emotional equity markets” in recent months[2] and U.K. businesses are generating the highest percent free cash flow in the world (6%[3]). Prominent companies such as Daimler, Lloyds, and Tencent are trading at significant discounts to intrinsic value, and the Oakmark International portfolio has a Price/Cash Flow ratio of 4.8x compared to 7.5x for the world, indicating the shares held in the fund are priced significantly lower than the world markets.

Oakmark International, MSCI ACWI, EAFE, and Emerging Markets Equity Returns

Oakmark International

Source: https://stockcharts.com/h-perf/ui

Worries about a near-term recession in the U.S. receded as corporate earnings continued to grow in the 4th quarter of 2018 and employers added more new jobs than expected.

Unemployment in the U.S. remained near historic lows, edging up to 4%[4] due to the temporary addition of government workers furloughed during the partial government shutdown. The labor participation rate continued to increase slowly and job creation exceeded expectations in January with 304,000 jobs added[5].

Fears of rising interest rates derailing the U.S. economy diminished with Federal Reserve officials holding short-term rates steady at their January meeting and commenting on being ‘patient’ with future interest rate increases[6].


[2]https://www.im.natixis.com/us/markets/finding-value-in-overly-emotional-equity-markets
[3] As presented Natixis National Sales Meeting January 10, 2019 Source: Corporate Reports, Empirical Research Partners Analysis as of November 30, 2018. Excluding financials and utilities; data smoothed on a trailing six-month basis.
[4]https://www.wsj.com/articles/global-stocks-edge-up-after-a-january-surge-in-the-u-s
[5]https://www.bls.gov/news.release/empsit.nr0.htm
[6]https://www.federalreserve.gov/monetarypolicy/fomcpresconf20190130.htm

U.S. Unemployment Rate, Participation Rate, and 10-yr. Treasury Yield

Corporate earnings for the 4th quarter were generally near the 5-year average with 10 of the 11 S&P sectors reporting year-over-year earnings growth.

Energy, Industrials, and Communication Services led the way with double-digit growth rates in the 4th quarter, though earnings estimates for 2019 are trending lower across most sectors[7].

4th Quarter 2018 Actual Earnings Growth vs. 12/31/2018 Projections

2019 Forecast Earnings Growth vs. 12/31/2018 Projections


[7]https://insight.factset.com/earnings-season-update-february-1-2019
The investment team at Warren Street Wealth Advisors held the line through a difficult 4th quarter of 2018, reaping the reward with a strong start to 2019.

Despite some negative headlines in December, the U.S. economy does not seem poised for a recession and we will remain fully invested across market sectors until evidence to the contrary becomes clear. With the Federal Reserve cautious on raising interest rates, job growth and wages increasing, and trade talks moving forward, we expect market volatility in 2019 to settle closer to historic norms, though not without some bumps along the way.

Despite recent weakness in overseas markets relative to the U.S., we are strong in our conviction that international markets are poised to rebound as stock prices stabilize at attractive levels, particularly in Europe and Emerging Markets, and negative headlines diminish. While economic and fundamental data appear mixed globally, we continue to be broadly diversified as international markets work through the next phase of political and economic developments.

As always, if you have any concerns or questions, the investment and financial planning teams at Warren Street Wealth Advisors want to hear from you! Call, write, or drop by our Tustin or El Segundo offices any time. We are here to help.


Marcia Clark, CFA, MBA
Senior Research Analyst
Warren Street Wealth Advisors

Warren Street Wealth Advisors, a Registered Investment Advisor. The information contained herein does not involve the rendering of personalized investment advice but is limited to the dissemination of general information. A professional advisor should be consulted before implementing any of the strategies or options presented. Any investments discussed carry unique risks and should be carefully considered and reviewed by you and your financial professional. Past performance may not be indicative of future results. All investment strategies have the potential for profit or loss. 


Market Commentary – December 2018

Market Commentary – December 2018

Key Takeaways

  • Though the U.S. stock market closed the year with its first annual loss since 2008 (S&P 500 -4.38%)(1), investors retained the vast majority of gains earned in 2017 (21.83%.) International stocks as measured by the MSCI EAFE(2) index were down -8.96%, giving up just over half of 2017’s gains (16.84%), and the Barclays Aggregate U.S. bond index ended the year flat at +0.01% after a very strong November and December.
  • Though market turbulence in the 4th quarter felt extreme, volatility over the year didn’t approach the peaks seen after the Dot Com bubble burst in 2001-2002 or during the financial crisis of 2008-2009.
  • Global financial markets tend to exhibit a ‘sector rotation’ pattern of recent losers becoming the next period’s winners. If the pattern holds true, international stocks are poised for a strong year in 2019.
  • 2018’s poor performance followed an unusually steady 10-year period of growth. Investors bold enough to put their money at risk after the market plummeted in 2008 were handsomely rewarded. Investors willing to do the same in 2019 may be rewarded once again.


It wasn’t pretty, but the year is finally over and we already see indications of better times ahead in 2019.

Though the U.S. stock market closed the year with its first annual loss since 2008 (-4.38%) , investors retained the vast majority of gains earned in 2017 (21.83%) and the previous 9 years of recovery post the 2008 financial crisis. Though European stock markets fell behind the U.S. last summer and never caught up, these markets also ended 2018 well ahead of where they started in 2017. International stocks as measured by the MSCI EAFE index were down -8.96% in 2018 compared to +16.84% in 2017, and U.S. bonds ended the year flat after recovering strongly late in the 4th quarter.

Source: https://stockcharts.com/h-perf/ui

Market sectors which lagged in the strong quarters, especially bonds (AGG) and gold (GLD), provided welcome relief during the 4th quarter downturn. International stock markets avoided some of the December tumble and rebounded into January 2019, easing some of the pain from lagging the robust U.S. market earlier in the year.

The return of stock market volatility in the 4th quarter surprised investors, especially compared to an unusually stable 2017.

Volatility in 2018 was more than double that of 2017, though did not approach the peak volatility seen during the financial crisis of 2008-2009 and post the Dot Com bubble/credit crisis in 2001-2002. The pattern seems to be that periods of unusual stability are often followed by a spike in volatility. We know that the past isn’t always reflective of the future, but as Mark Twain is reported to have said: “History doesn’t repeat itself, but it often rhymes.”

Just as periods of stability are often followed by turbulence, extreme market moves are commonly followed by reversion toward the mean (average).

This tendency is illustrated by the two charts below. The first chart shows the drop in the SPY and EFA ETFs in the period between July-November 2011. Notice the jagged ups and downs just after the drop, followed by a fairly steady up-trend through 2013, though not without some negative surprises along the way.

We see a similar pattern in the 4th quarter of 2015 before the start of the bull market of 2016-2017.

And while the downturns are painful, they tend to be relatively brief compared to the recovery period.


  • Dot Com bust lasted from early 2000 to early 2003, followed by 5 years of positive returns
  • Financial crisis crash lasted from late 2007 to early 2009, followed by 9 years of mostly positive returns
  • Less dramatic declines in 2011 and 2015 were followed by 3 years of positive returns

Asset class returns tend to follow a ‘sector rotation’ pattern with prior period winners commonly falling in the rankings in subsequent periods, and prior period losers tending to rise in the rankings.

Source: Morningstar Direct

Though historical context is helpful, we need to face forward when making investment decisions. Following the crowd and expecting history to repeat itself without considering the underlying drivers of returns isn’t likely to be a successful strategy in the coming year.

Though market conditions vary from year to year, the investment team at Warren Street Wealth Advisors believes international stocks in particular have been hit by political and economic ‘headline risk’ more than actual financial distress. Many European companies such as BNP Paribas (one of the largest banks in Europe), Daimler (maker of Mercedes Benz), and Lloyds Banking Group (a leading U.K. financial service firm) are poised for a strong rebound in 2019. In emerging countries, stalwart firms such as Samsung and Taiwan Semiconductor remain solid global players, with disruptors such as Alibaba and Tencent making their presence felt beyond their home base in AsiaPacific.

Another important thing to remember is that the stock market is not the real economy. Fundamental strength in corporate balance sheets should keep the global economy, and the markets, positive in 2019.

GDP reflects the value of goods and services produced in a country – ultimately, GDP reflects corporate earnings. Robust U.S. GDP growth early in 2017 led to tight labor markets and rising inflation, supporting the Federal Reserve’s plan to ‘normalize’ short-term interest rates(3). Though GDP growth is expected to slow in 2019, the Federal Reserve forecasts a positive growth rate of approximately 2%. Not stellar, but certainly not in recession territory. And not so strong as to require the Fed to increase their pace of raising short-term interest rates, since modest GDP growth is unlikely to spark inflation. The International Monetary Fund is projecting similar modest positive growth for developed nations, and near 5% growth for emerging economies.


Growth Projection for U.S. GDP

Source: Factset


Growth Projection for the World

Source: International Monetary Fund


Economic fundamentals should ultimately find their way into stock prices, but the markets often become overly optimistic or pessimistic along the way.

As we mentioned in our November commentary, S&P 500 corporate profits were very strong in the 4th quarter of 2018. And for the calendar year, growth in corporate profits was 20.3% due in part to the reduced corporate tax rate(4). This is the highest growth rate we’ve seen since 2010 when profits jumped nearly 40% coming out of the Great Recession of 2008-2009. All 11 sectors of the S&P 500 reported positive growth for the year, with 9 of the 11 sectors reporting double-digit growth.


You might be surprised to see that Energy companies reported the highest calendar year earnings growth of all the 11 sectors. Despite the 4th quarter fall in oil prices, oil has actually increased when compared against the prior year-end. Materials and Financials also posted strong earnings growth in 2018, a fact not reflected in their December closing stock prices.

As shown in the chart above from Fidelity Research(5), the biggest losers in the S&P 500 were not Technology companies which were grabbing most of the news headlines, but rather Industrials, Financials, Materials, and Energy firms. Industrials and materials were hard hit by concerns over trade tariffs and a slowing, though still strong, pace of new home building(6). Energy equipment and services firms suffered from falling oil prices hurting profit margins. Financial firms also struggled as increasing short-term funding rates squeezed investors’ profit expectations.

Conclusion: Though we can’t predict the future, periods of extreme market movements are often followed by reversion toward the mean. The underlying economic data remains solid and sooner or later investors will incorporate this reality into global stock and bond prices. In the meantime, the investment team at Warren Street Wealth Advisors is watching the data, rebalancing into weakness, and looking forward to a smoother ride in 2019.


Marcia Clark, CFA, MBA
Senior Research Analyst
Warren Street Wealth Advisors

Warren Street Wealth Advisors, a Registered Investment Advisor. The information contained herein does not involve the rendering of personalized investment advice but is limited to the dissemination of general information. A professional advisor should be consulted before implementing any of the strategies or options presented. Any investments discussed carry unique risks and should be carefully considered and reviewed by you and your financial professional. Past performance may not be indicative of future results. All investment strategies have the potential for profit or loss. 


Sources

  1. All returns retrieved from Morningstar Direct
  2. EAFE = Europe, Australasia, Far East
  3. https://insight.factset.com/2017-look-back-2018-predictions-0
  4. https://insight.factset.com/sp-500-2018-earnings-preview-highest-earnings-growth-in-eight-years
  5. https://eresearch.fidelity.com/eresearch/markets_sectors/sectors/sectors_in_market.jhtml
  6. https://tradingeconomics.com/united-states/housing-starts


Word on the Street – November 27th – December 1st

Word on the Street – November 27th – December 1st

Another brief conversation with our CIO on current events in the investing world…

A sit down with Blake Street, CFA, CFP® to discuss some current events in the news, their impact on investors, and his sentiment on some issues. Enjoy…

Trade War talks are still present as people were worried about the G20 meeting. Since our last conversation, where do you think we are now with the trade talks?

Blake Street: Specific to the US and China, much remains to be seen. At this point, we are still on the light end of threatened tariffs with escalation due here soon without further intervention. In recent days, the President has new motivation to come up with some type of remedy to re-instill confidence in the markets. One way would be to calm US & China trade tensions and get global growth back on track. It remains to be seen if this is the case. As we have seen in the recent past, sometimes these summits result in a lot of talk and no action. The G20 Summit resulted in a “truce” or “ceasefire” of sorts between the US & China, however, very little clarity has been provided and an arrest of the CFO of Huawei, China’s largest tech company, this morning (12/6/2018) could further inflame tensions.

General Motors seems to have suffered greatly due to the tariffs, among other things. Do you think that this is going to be a reoccurring theme for some US companies, or is this just a casualty of war?

B.S.: I don’t know if you can say they suffered greatly, but they are doing what every company should do which is look out for their long-term interests. They have spotted changes in their own market landscape that require a change in where they produce their products and what products they produce for consumers. Tariffs have certainly hurt their bottom line by increasing certain input costs and while this seems obvious in hindsight, a lot of industries from automotive manufacturers to agricultural producers have been harmed by trade tensions and tariffs.

Oil prices are down again as well. How with this impact both consumers at the pump and investors? What do you think the long-term trend will be?

B.S.: Consumers during the holiday season will benefit by keeping more money in their pocket. However, falling crude prices can also come with other adverse impacts such as slowing economies and weak investment markets. Historically, 30% declines in crude oil prices have correlated strongly to short-term bear markets, not always a recession.

Personally, I think the most recent selloff is overdone, and we will return to higher oil prices in the not too distant future. Case and point, I don’t think that demand has dropped off in a meaningful way, and we have not seen the type of supply buildups reminiscent of 2015, the last time we saw oil prices collapse.

On Wednesday (11/28/2018), Jerome Powell, Chair of the Federal Reserve, came out and said that the Fed Funds rate is approaching neutral. This news was a stark contrast to his October statements. What does this mean for the market as we approach 2019?

B.S.: Investors and markets alike were appeased to hear that we may be due for fewer rate hikes than initially priced in. Foreign markets have also been dealing with adverse effects of a strengthening US dollar and rising US interest rates. Markets overseas breathed a sigh of relief to hear of a potentially more accommodative Fed policy.

In my mind, an even bigger question mark is how the Fed continues to handle the unwinding of its balance sheet in the coming years. I’m also slightly concerned with President Trump’s recent politicization of the Fed. At the end of the day, Fed Chair Jerome Powell has a job to do, and it is not solely to provide octane to investment markets at the President’s request. I expect the Fed to remain focused on their traditional mandate and to shirk Presidential pressures.


Warren Street Wealth Advisors, a Registered Investment Advisor. The information contained herein does not involve the rendering of personalized investment advice but is limited to the dissemination of general information. A professional advisor should be consulted before implementing any of the strategies or options presented. Any investments discussed carry unique risks and should be carefully considered and reviewed by you and your financial professional. Past performance may not be indicative of future results. All investment strategies have the potential for profit or loss. 


Word on the Street – October 1st-5th

Word on the Street – October 1st – 5th

A brief conversation with our CIO, Blake Street, CFA, CFP®, on what’s going on in the world today.

We constantly want to deliver more content to our clients and followers on current events, and how we are viewing them from an investment or planning angle.

“Word on the Street” will be a series where I sit down with our Chief Investment Officer, Blake Street, CFA, CFP® to pick his brain on what’s going on in the news and what that means for you.

Here is the conversation I had with him on Friday, October 5th discussing the last couple weeks. Enjoy.

Alright, Blake. Let’s start with the new US trade deal that people are calling NAFTA 2.0. What’s your take and how will this new deal impact investors?

B.S.: NAFTA 2.0 or more accurately titled the U.S. Mexico Canada Agreement (USMCA) in my opinion is largely underwhelming. At its core, it should bring some manufacturing jobs back to the U.S. from Mexico, but I also expect this to result in increased cost to the end consumer. Considering the United States spends $500 billion a year on autos, cost increases will be noticed.

The reason I’m underwhelmed is the negotiation process wasn’t without collateral damage in trade relations and the ultimate outcomes are incremental at best. Essentially, Canada and Mexico agreed that 75% of parts for cars built for export would be made in North America. This is up from the original agreement of 62.5% under NAFTA. They also agreed that 45% of cars would be built by workers making more than $16 an hour by 2023, this was ultimately targeted at Mexico and should result in rising costs for domestic and imported production. Mexico also agreed to improve labor conditions but enforcement remains vague.

Canada agreed to increase import quotas for U.S. dairy into their market. I’ve seen estimates that this could result in $50-$100 million in activity for American dairy farmers. Not sure this moves the needle, especially in the face of what appears to be a $100-$400 million decline in Chinese imports of American dairy in the coming years.

Additionally, USMCA hasn’t officially been ratified yet. It has only been approved for a vote. If the midterm elections put more Democrats in Congress, then they have the opportunity to deny President Trump the victory of its passing.

We are entering the last quarter of the first year operating under tax reform. Do you think that it has been good or bad for investors?

B.S.: It’s hard to argue that is has been anything but great for investors. Three straight quarters of near-record earnings and US markets are oscillating around record highs. Taxpayers have yet to officially file under the new tax reform, so they have yet to even feel the full benefits.

It will be interesting to see how equity markets react as we get into 2019. The initial thrust of the tax cuts on earnings will wane over time, and it will be interesting to compare year-over-year numbers to post-tax cut figures.

Is there anything people might be surprised about as they go to file?

B.S.: The biggest surprise to most will be the balance between an enhanced and expanded standard deduction, lower marginal rates, and aggressively capped state and local tax deductions. In addition, I expect the 20% pass-through deduction to surprise a lot of folks who don’t know how it works, in both a good and bad way.

How do you feel about Elon Musk and the SEC?

B.S.: He got off way too easy. He should have been stripped of his role as director and CEO in addition to losing his chairman position. His $20 million personal and $20 million corporate fines are a drop in the bucket compared to the market cap of Tesla and the potential money that was lost or made based on his manipulative behavior.

Leaking a takeover bid or the idea of taking a company private should force a stock price to the assumed target price. Any rational CEO would know this ahead of time. He coerced unknowing investors to buy into Tesla based on this information and blew out short positions which seemed to be his intention.

The amount of talk around marijuana stock is at a high again. How should investors approach it, if at all?

B.S.: Personally, it is not a sector I am interested in investing in for myself or for clients as it is still illegal at the federal level. Recent buzz escalated when Tilray, a Canadian pot producer, got approval for a clinical trial to use marijuana in pill form to treat seizures. They had about 10 million in sales last year, and the market cap soared to 15 billion, which is, frankly, absurd. A good piece of that market cap has been given back.

Should it ever become legal at the federal level, I expect a massive influx from titans of industry in alcohol, tobacco, and pharmaceuticals. Production will drive down cost quickly. If we were to invest, we would focus more on the picks and shovels, distribution, and manufacturing perspective. A diversified approach will likely pay as picking the winners of such a rapidly developing space may prove to be very difficult.

What do you find most interesting in the market right now?

B.S.: Emerging Markets.

Interesting response…why?

B.S.: They started the year at low relative valuations even after a monster 2017. As of the end of September, they were at a 20% drawdown from the year’s high. I continue to believe they will be the best place to be over the next 5-10 years for fundamental and demographic reasons. Dollar strength has caused a lot of pain in emerging market currency denominated holdings and the sell-off in emerging market stocks has reached seemingly oversold levels. The pain might not be fully over yet, so a disciplined approach to buying into recent weakness is needed.

The 10 year Treasury closed Friday at 3.23. What are some of your thoughts as rates rise?

B.S.: I believe we’re now 8 Fed Rate hikes in. The consensus seems to be that we are due for 3-4 more. It seems that the market is not fighting back and pushing yields down. It will continue to pay to be nimble, keep durations short, and invest in fixed income asset classes with lower rate sensitivity and look for opportunities abroad.

Do you see any opportunities or concerns with rates increasing?

B.S.: Rising rates have resulted in a strong dollar which puts pressure on emerging market debt causing yield spreads to widen. This has created possible valuation pockets within emerging market debt, and this opportunity should not be entered into lightly.

Concerns: If inflation and yields continue to rise, investors who are accustomed to long-term, stable outcomes will be surprised to find out how volatile bonds can be in a rising rate environment. Going back to 1976, bonds on average have only had 3 negative years. Count 2018 as the fourth. Would a fifth materially change investors perspectives on what bonds mean to portfolios? Or will investors continue to understand bonds importance in a well-diversified portfolio? This creates opportunity and concern.

Any closing remarks?

B.S.: Loss aversion is one of the most basic human tendencies I can think of. In a year where virtually every asset class other than US stocks is in the red, I can see a lot of potentially bad behavior starting to fester. It is important now more than ever that you don’t chase the hot dot. Stick to your plan, stick to your process, even if that means deferring to your advisor.


WSWA Team Compressed-19-squareJoe Occhipinti
Marketing Manager
Warren Street Wealth Advisors

Warren Street Wealth Advisors, a Registered Investment Advisor. The information contained herein does not involve the rendering of personalized investment advice but is limited to the dissemination of general information. A professional advisor should be consulted before implementing any of the strategies or options presented. Any investments discussed carry unique risks and should be carefully considered and reviewed by you and your financial professional. Past performance may not be indicative of future results. All investment strategies have the potential for profit or loss.