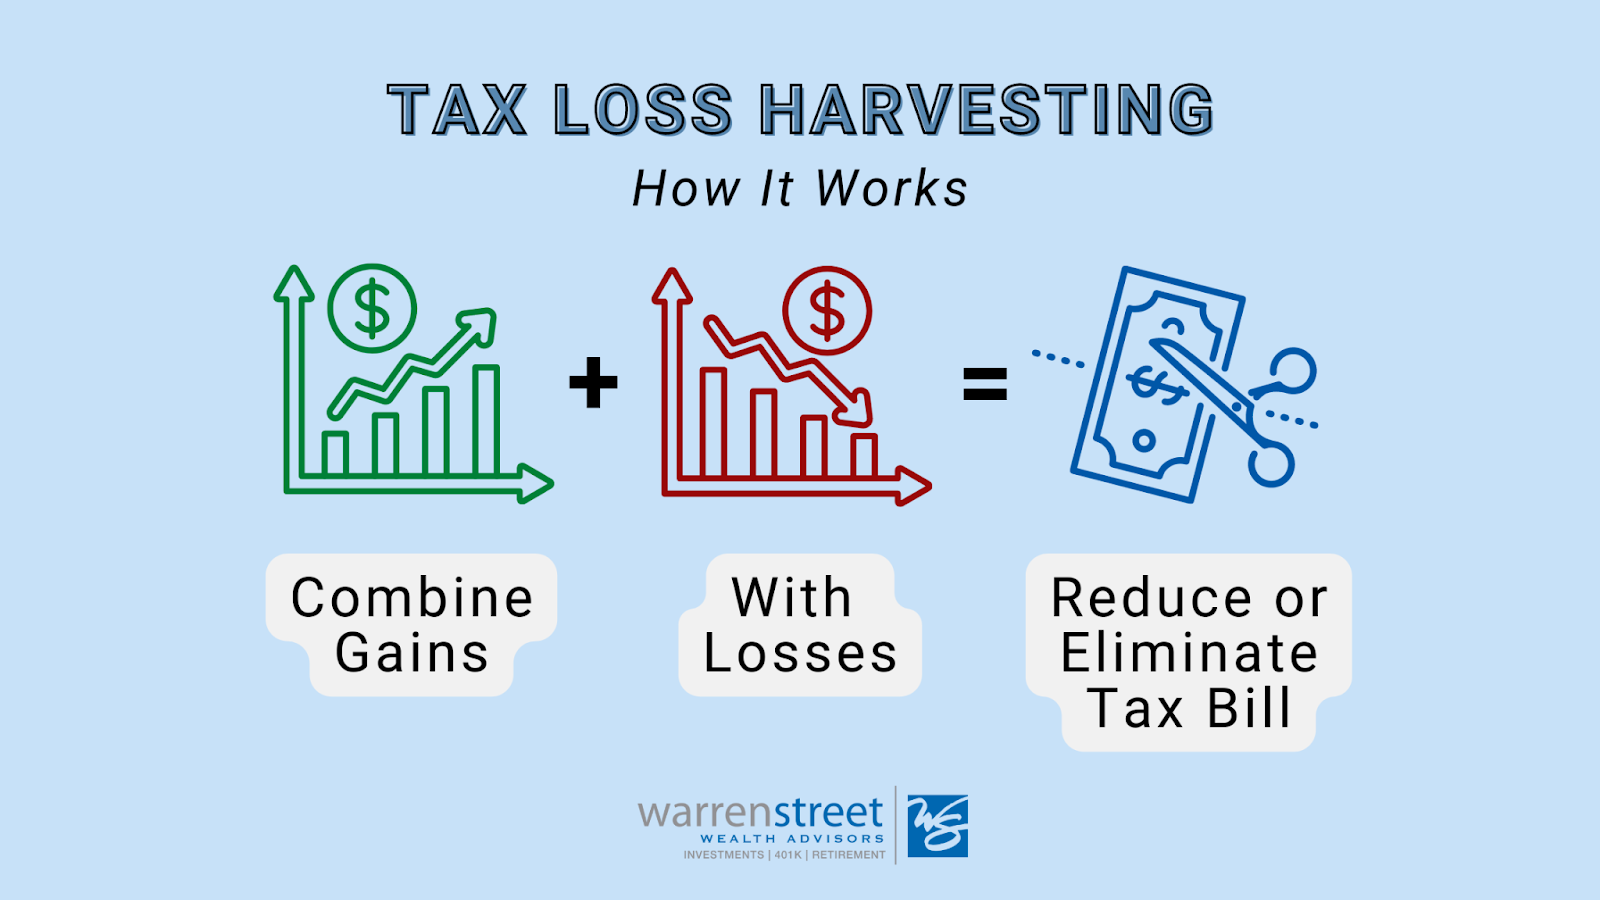
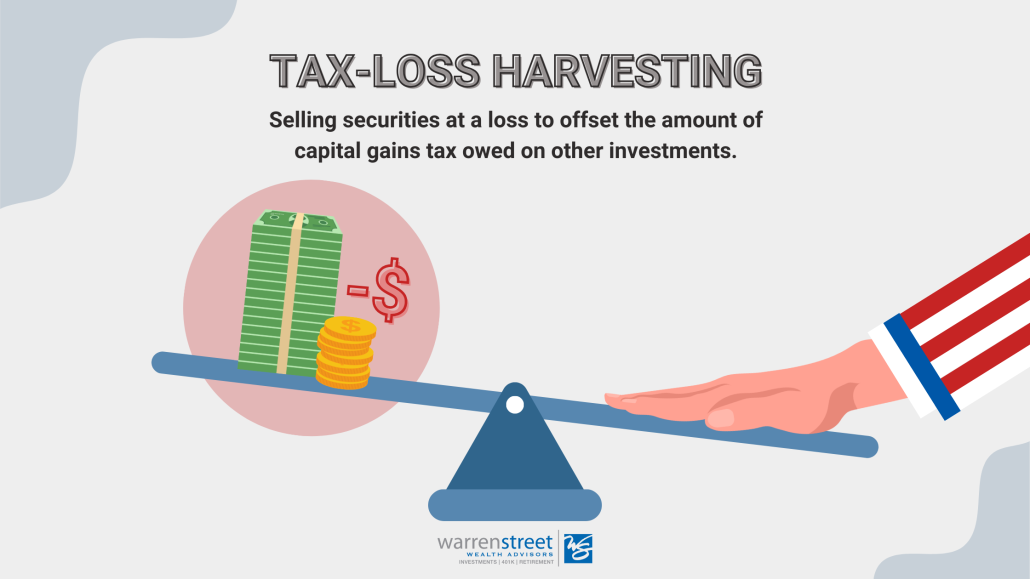
Tax-Loss Harvesting: Opportunities and Obstacles
So much of investing is beyond our control (picking stock prices, timing market movements, and so on) that it’s nice to know there are several “power tools” that can potentially enhance overall returns. Tax-loss harvesting is one such instrument, but — like many tools — it’s best used skillfully, and only when it is the right tool for the task.
The (Ideal) Logistics
When properly applied, tax-loss harvesting is the equivalent of turning your financial lemons into lemonade by converting market downturns into tangible tax savings. A successful tax-loss harvest lowers your tax bill, without substantially altering or impacting your long-term investment outcomes.
Tax Savings
If you sell all or part of a position in your taxable account when it is worth less than you paid for it, this generates a realized capital loss. You can use that loss to offset capital gains and other income in the year you realize it, or you can carry it forward into future years. We can realize losses on a holding’s original shares, its reinvested dividends, or both. (There are quite a few more caveats on how to report losses, gains, and other income. A tax professional should be consulted, but that’s the general premise.)
Your Greater Goals
When harvesting a loss, it’s imperative that we remain true to your existing investment plan. To prevent a tax-loss harvest from knocking your carefully structured portfolio out of balance, we reinvest the proceeds of any tax-loss harvest sale into a similar position (but not one that is “substantially identical,” as defined by the IRS). Typically, we then return the proceeds to your original position no sooner than 31 days later (after the IRS’s “wash sale rule” period has passed).
The Tax-Loss Harvest Round Trip
In short, once the dust has settled, our goal is to have generated a substantive capital loss to report on your tax returns, without dramatically altering your market positions during or after the event. Here’s a three-step summary of the round trip typically involved:
- Sell all or part of a position in your portfolio when it is worth less than you paid for it.
- Reinvest the proceeds in a similar (not “substantially identical”) position.
- Return the proceeds to the original position no sooner than 31 days later.
Practical Caveats
An effective tax-loss harvest can contribute to your net worth by lowering your tax bills. That’s why we keep a year-round eye on potential harvesting opportunities, so we are ready to spring into action whenever market conditions and your best interests warrant it.
That said, there are several reasons that not every loss can or should be harvested. Here are a few of the most common caveats to bear in mind.
- Trading costs – You shouldn’t execute a tax-loss harvest unless it is expected to generate more than enough tax savings to offset the trading costs involved. As described above, a typical tax-loss harvest calls for four trades: There’s one trade to sell the original holding and another to stay invested in the market during the waiting period dictated by the IRS’s wash sale rule. After that, there are two more trades to sell the interim holding and buy back the original position.
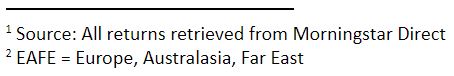
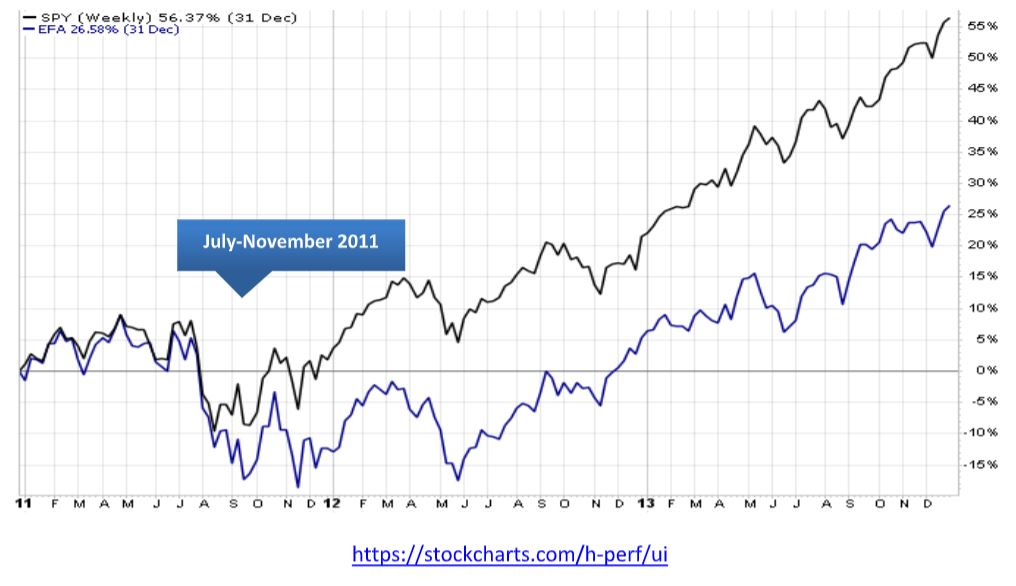
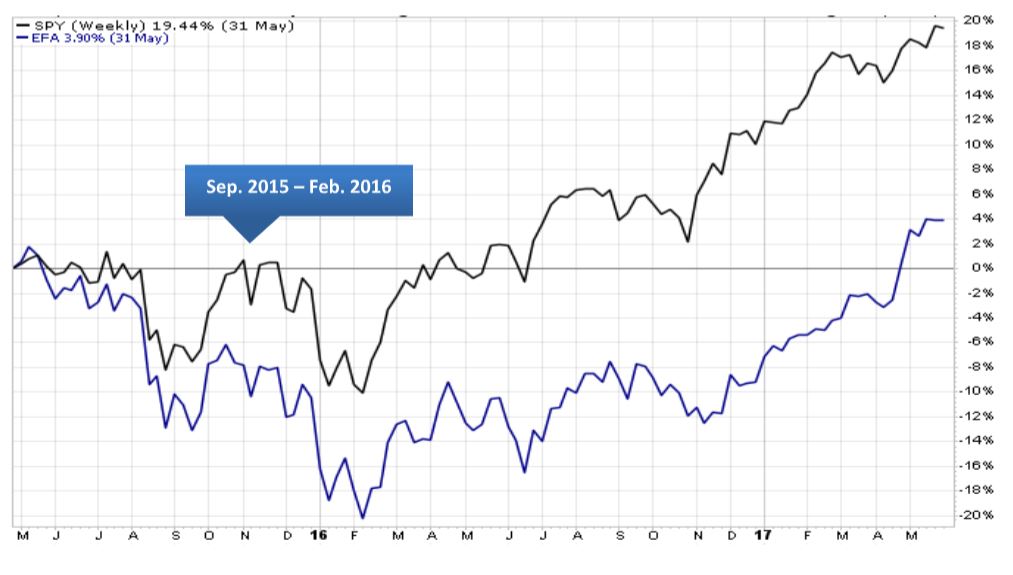
- Market volatility – When the time comes to sell the interim holding and repurchase your original position, you ideally want to sell it for no more than it cost, lest it generate a short-term taxable gain that can negate the benefits of the harvest. We may avoid initiating a tax-loss harvest in highly volatile markets, especially if your overall investment plans might be harmed if we are unable to cost-effectively repurchase your original position when advisable.
- Tax planning – While a successful tax-loss harvest shouldn’t have any impact on your long-term investment strategy, it can lower the basis of your holdings once it’s completed, which can generate higher capital gains taxes for you later on. As such, we want to carefully manage any tax-loss harvesting opportunities in concert with your larger tax-planning needs.
- Asset location – Holdings in your tax-sheltered accounts (such as your IRA) don’t generate taxable gains or realized losses when sold, so we can only harvest losses from assets held in your taxable accounts.
Adding Value with Tax-Loss Harvesting
It’s never fun to endure market downturns, but they are an inherent part of nearly every investor’s journey toward accumulating new wealth. When they occur, we can sometimes soften the sting by leveraging losses to your advantage. Determining when and how to seize a tax-loss harvesting opportunity, while avoiding the obstacles involved, is one more way we seek to add value to your end returns and to your advisory relationship with us. Let us know if we can ever answer any questions about this or other tax-planning strategies you may have in mind.

Bryan Cassick, MBA, CFP®
Wealth Advisor, Warren Street Wealth Advisors
Investment Advisor Representative, Warren Street Wealth Advisors, LLC., a Registered Investment Advisor
The information presented here represents opinions and is not meant as personal or actionable advice to any individual, corporation, or other entity. Any investments discussed carry unique risks and should be carefully considered and reviewed by you and your financial professional. Nothing in this document is a solicitation to buy or sell any securities, or an attempt to furnish personal investment advice. Warren Street Wealth Advisors may own securities referenced in this document. Due to the static nature of content, securities held may change over time and current trades may be contrary to outdated publications. Form ADV available upon request 714-876-6200.