Tag Archive for: international stock

Oil, Conflict, and Your Portfolio: What We’re Watching

Before we dive into the facts, we want to take a moment to recognize that before we are advisors or investment analysts, we are human. Our hearts go out to the families and individuals affected. We hold that reality close as we do our job of helping you navigate what it means for your financial future.

Part of that job is cutting through the noise, so let’s talk about what’s happening, what it means, and what we’re doing about it.

What’s Happening

The conflict entered its second week with crude oil briefly crossing $110 per barrel. Energy infrastructure in the region sustained damage, and the world turned its attention to the Strait of Hormuz — the narrow waterway through which roughly 20% of global oil supply flows — and whether it would remain open for business.

The View from fire-detecting satellites:
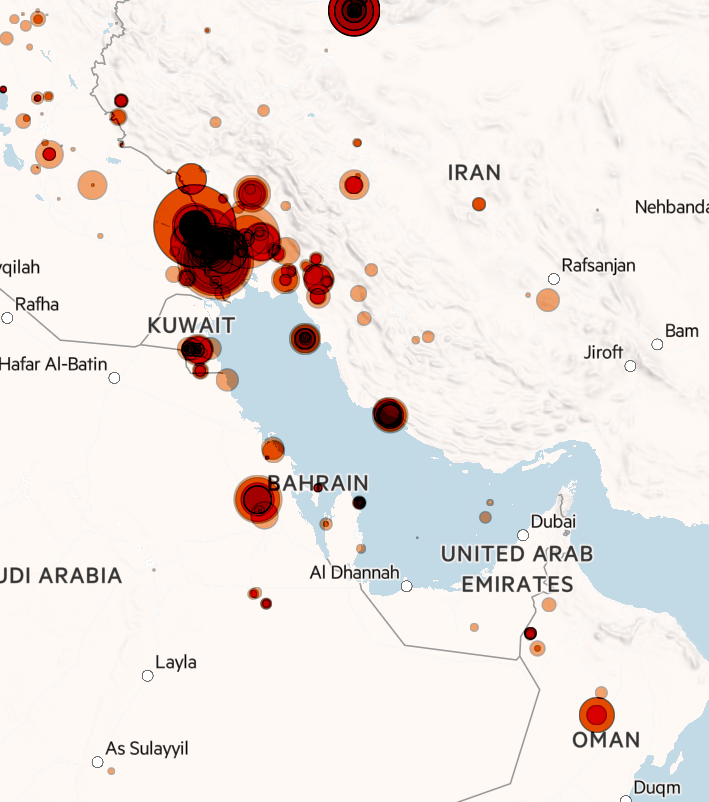
Fire anomalies detected by infrared sensors on 7-8 March. Circles are sized by fire radiative power, darker circles mean several fires in close proximity

Sources: FT Analysis, Nasa Firms. Fires reported are either in locations with no history of regular burns or are unusually bright.

We don’t have a crystal ball for what will happen next, but there are three questions we’re watching closely:

  1. Will there be more lasting damage to energy infrastructure?
  2. What does the endgame look like in terms of leadership and capabilities on both sides?
  3. Can a compromise be reached that keeps oil flowing through the gulf?

And Then Oil Dropped $20

Here’s the thing about geopolitical risk: it tends to be loud and unpredictable.

As I’m writing this, oil has pulled back from $110+ per barrel to below $90 — after President Donald Trump suggested the potential for a swift conclusion to the conflict. Meanwhile, the Strait of Hormuz is seeing vessel traffic increase, recovering from post-attack lows with inbound and outbound ship movements gradually rising. 

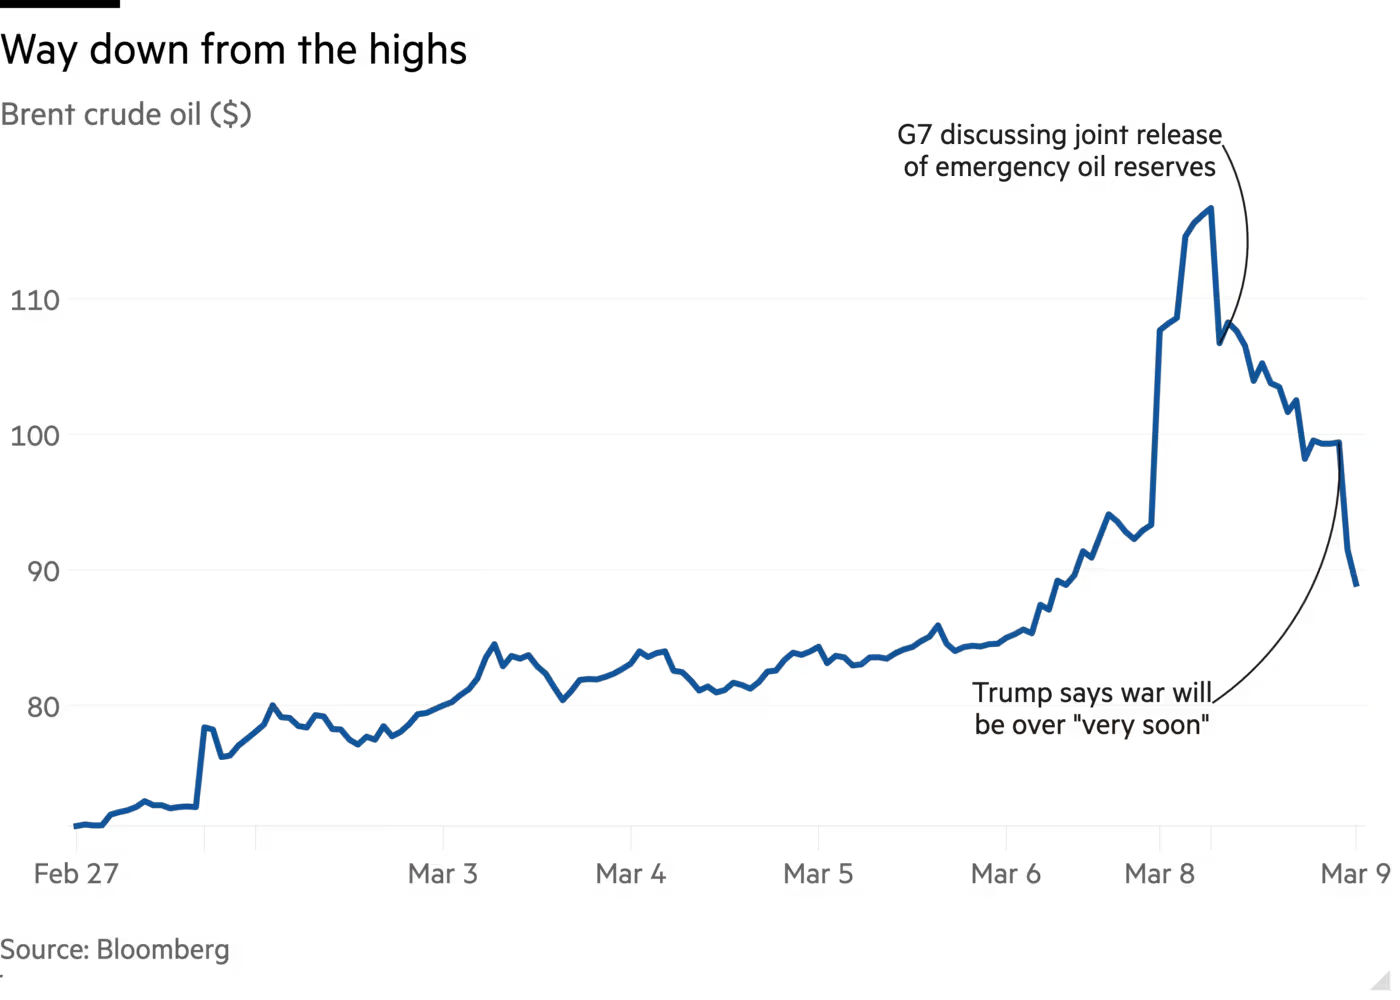
While it’s too soon to declare a resolution, the swift oil price drop following comments from President Trump shows the market was pricing in a major supply shock that hasn’t materialized. This underscores why we avoid trading headlines, which often lead to emotional decisions mistaken for analysis. Our consistent advice for geopolitical headlines remains: stay diversified, stay disciplined, and trust your portfolio strategy.

History Has Seen This Before

Here’s something worth sitting with. Looking at the past 20 major military conflicts and their impact on the S&P 500 over the last 75 years, the average decline from the initial shock to the market bottom was around 6%, and in 19 out of 20 cases, markets returned to pre-event levels in an average of just 28 days.

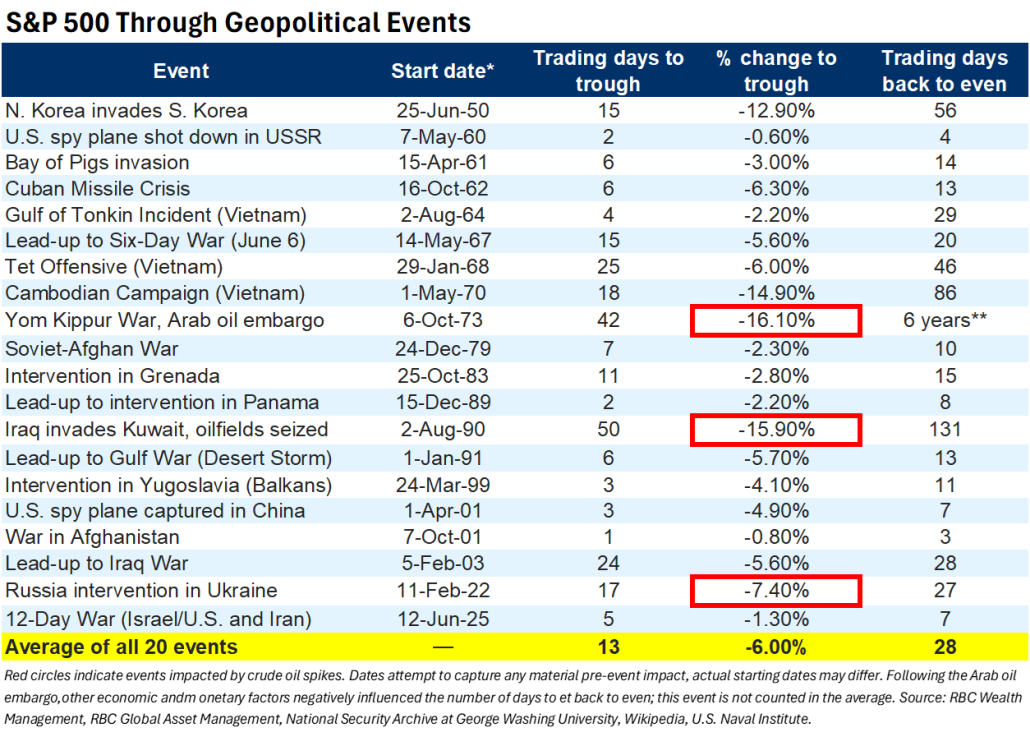
The two biggest exceptions — the 1973 Yom Kippur War and Iraq’s 1990 invasion of Kuwait — both involved sustained oil supply disruptions that pushed stocks down 15–16%. The 1973 episode scarred a generation of investors who sold out of equities and missed the enormous bull run of the 1980s.

The lesson isn’t that conflicts don’t matter. It’s that panicking out of a well-structured portfolio tends to hurt more than the conflict itself does.

This Isn’t 1973

Clients who lived through the Yom Kippur War might flinch from the prospect of re-living around-the-block gas lines, federally imposed speed reductions, or darkened cities to conserve energy. We understand the instinct, but there are major differences today.

In 1973, the U.S. was heavily dependent on imported oil. Every extra dollar at the pump was more money in the pockets of Middle Eastern countries. Today, the U.S. is a net energy exporter. Higher oil prices are painful for consumers, yes — but every extra dollar is more cash in the pockets of domestic energy producers. It’s a redistribution within the economy, not a pure drain out of it.

As for inflation, Energy makes up only about 6% of today’s U.S. inflation basket.  There also headwinds blowing against the case for a 1970’s stagflation landscape, including:

  1. Shelter Lags: Shelter costs (33% of the basket) are declining as lagging rent data catches up to reality, which will apply downward pressure on inflation prints.
  2. Technological Progress: AI and technology-driven productivity is quietly acting as a deflationary force as consumers and businesses increase adoption.
  3. Calming Tariff Tantrums: After the recent IEEPA tariff ruling, the effective tariff rate has also come down meaningfully to 9.1%.
  4. Fundamental economic strength: We acknowledge the recent jobs report’s weakness, but also recognize other areas in the economy remain healthy. Corporate profits are expected to grow at high single to double digits in 2026. Tax refunds from last year’s One Big Beautiful Bill (OBBB) haven’t fully hit consumer accounts yet.

The Fed will likely pause at upcoming meetings, but that’s very different from the kind of policy circumstances that defined the stagflation era.

Weeks, Not Months?

Both sides have strong incentives to reach a compromise quickly. Iran can’t export oil under prolonged conditions and is subject to existential economic pressure. In the U.S., $4+ gas heading into a midterm summer is its own political tax. December oil futures were already trading in the low $70s before today’s pullback, suggesting the market never fully bought the doomsday scenario. Inflation breakeven rates have stayed surprisingly calm throughout.

Even after hostilities quiet down, there’s likely a period of elevated shipping costs and more cautious tanker behavior through the region. Think of it as a persistent risk premium rather than a single clean resolution — but a manageable one, not an economy-altering one.

What We’re Doing

We’re not making dramatic moves based on headlines and that’s by design. We are however, sticking to our operating procedure of:

  1. Rebalancing – different parts of our clients’ portfolios have generally weathered the volatility well, but some may have drifted off target. Rebalancing is a disciplined move back toward those levels, not a market call, but a long-term wealth strategy of selling strength and buying weakness.
  2. We built the “Diversifiers” strategy in client’s retirement portfolios for moments like this. It’s doing its job and reminding us that traditional stock-bond portfolios don’t always move in opposite directions when inflation is in the picture.
  3. If markets sell off further in an extreme scenario, we have the flexibility to tilt asset classes within our portfolios.

We’ll continue monitoring the conflict while staying with our standard operating procedure, but what we won’t do is trade headlines. The oil price chart of the last two weeks makes that case better than we ever could.

WSWA

Warren Street Wealth Advisors

Warren Street Wealth Advisors, LLC., a Registered Investment Advisor

The information presented here represents opinions and is not meant as personal or actionable advice to any individual, corporation, or other entity. Any investments discussed carry unique risks and should be carefully considered and reviewed by you and your financial professional. Nothing in this document is a solicitation to buy or sell any securities, or an attempt to furnish personal investment advice. Warren Street Wealth Advisors may own securities referenced in this document. Due to the static nature of content, securities held may change over time and current trades may be contrary to outdated publications. Form ADV available upon request 714-876-6200.

Sources:

2026 Outlook: Beyond AI & Mega-Cap Tech

“Is AI a bubble?” my uncle asked as I put my fork down mid-bite on New Year’s Eve. I’d wager that this question dominated dinner tables and family gatherings across the country this holiday season. Even my sister, whose focus lies entirely within the arts and creative pursuits, managed to put the two words “AI” and “Bubble” together.

This tells me two things: 1) Concern around AI and “bubble-ness” is virtually inescapable and 2) this question is dominating the audience’s perception of markets, perhaps even more so than the meteoric rise of silver and gold as we enter 2026.

Why Does AI Deserve So Much Attention?

In 2025, AI-related names drove ~60% of the increase in the S&P 500’s value. Furthermore, AI spending from the “Hyperscalers” (Google, Microsoft, etc.) accounted for the lion’s share of our economy’s growth. Without the spending on data center infrastructure—servers, GPUs, and the centers themselves—some estimates suggest US GDP would have grown at a measly 0.1% in the first half of 2025. It’s safe to say that AI alone kept the economy afloat for most of last year.

The robust figures above underscore why AI rightfully commands significant attention. However, fixating on the bubble label can be a trap, much like timing the market. Instead, we should look at bubble psychology and how those excesses may be extending into the AI ecosystem.

Settling the AI Bubble Talk

It’s been over 20 years since we’ve seen such a transformative, general-purpose technology with the potential to deliver productivity gains eclipsing the internet era. This fervor has already minted a class of early winners, leaving everyone else watching with a potent mix of envy and regret. It’s the classic setup for FOMO, where the “AI train” starts looking less like a sound, technological investment and more like a high-speed shortcut to a cushy nest egg.

The danger is that the faster this train moves, the easier it is to speed right past the following flags:

  • Starting Valuations: We pay prices regardless of whether reasonable returns can be generated.
  • Risk/Reward Profiles: We stop asking if we’re actually being compensated for the layers of risk we’re adding to our broader portfolio.
  • Lofty Narratives: AI’s newness unrestrains the imagination to justify price tags that reality can’t yet support.

Behind the Excitement: What’s Different This Time?

A Stronger Starting Line-Up Unlike the fragile startups of the dotcom era, today’s main AI spenders are profitable, cash-printing businesses. They are self-funding a massive AI arms race with capital expenditures set to leap by 60%, from $250bn in 2025 to over $400bn in 2026. Operating cash flows continue to outspace AI spend as a percentage of sales, allowing this historic investment to feel like a strategic augmentation of their core businesses rather than a reckless gamble.

Justified Valuations While Forward P/E ratios look expensive, today’s multiples are anchored by real-world profit. Take Nvidia: its stock price increased 14x over the last five years, but earnings grew 20x. Today’s titans aren’t as frothy as the dotcom class of 2000 because they are delivering healthy bottom-line results. However, this optimism hinges on perfection. While bulls argue we are buying “cheaper” growth today than at any point in the decade, that narrative leaves a near zero margin for error if adoption slows.

Infrastructure Demand In contrast to the fiber-optic mania of the 90s, the demand for AI build-outs can’t seem to catch a break. Data center vacancy rates are at a record low of 1.6%, and ~75% of pre-construction builds are already pre-leased. Additionally, past infrastructure bubbles saw spending peak between 2% and 5% of GDP, whereas today’s AI investment sits at roughly 1%. This suggests the build-out still has room to run.

Show Me the Money Revenues are skyrocketing. Alphabet’s Q3 2025 results proved that AI-driven features are accelerating search and ads, with generative AI product revenue surging into the triple-digit percentage range year-over-year. Beyond the titans, some industry participants have grown revenues nearly ninefold since ChatGPT launched. For now, the receipts are keeping the optimism alive.


AI Is Running Fast… But Will it Trip a Wire?

We are in a high-stakes arms race on both a micro level (hyperscalers) and a macro level (US vs. China). Businesses are pouring trillions into this effort to secure US leadership in a technology that will change the fabric of society. But in this race to the top, it’s easy to overlook the blind spots.

Revenues & Profits: Can We Reach the Promised Land? Despite the growth, there is a staggering gap between spending and earning. Analyst Azeem Azhar points out that AI companies are projected to generate $60bn in revenue against $400bn in spending for 2025. That’s a 6-7x gap—far wider than the dotcom bubble (4x) or the railroad boom (2x). Even if revenue catches up, will it translate to profit, or will we see a “race to the bottom” where large language models (LLMs) become commoditized?

Is Demand Real? Adoption is still in its awkward early stages. Only roughly 10% of firms are using AI to produce goods, though 45% pay for LLM subscriptions. According to the Stanford AI Index and McKinsey, the majority of firms are seeing only modest cost savings (≤10%) and negligible revenue gains (≤5%). Will AI adoption ever truly scale into broad, durable profit expansion?

How Long is Your (Useful) Life? Hyperscalers like Microsoft and Google have boosted profits by extending the “useful life” of their AI assets in their books. If innovation renders chips obsolete in 24 months, these companies will face massive write-downs. More importantly, they are funding this short-lived hardware with 30-year debt, leaving investors holding the bag for “obsolete” infrastructure that won’t be paid off for decades.

The AI Ouroboros There is an increasingly circular dance where Microsoft invests in OpenAI and then books cloud revenue from them. Nvidia buys stakes in the startups they sell chips to. This means a chunk of today’s “booming” revenue is an internal recycling of capital where true economic profit from external customers remains hypothetical.


Cloudy with a Chance of IOUs: While the biggest players usually use cash, we’re seeing a pivot toward the bond market. Oracle and Meta have emerged as outliers, using long-term bonds and project finance to bankroll their data centers. As free cash flow wilts under the weight of AI spend, their stock prices are feeling the gravity. Furthermore, the industry is using Special Purpose Vehicles (SPVs) to hide this leverage off-balance sheet, adding a layer of obscurity to the trillions being spent.

Conclusion: A Massive Collection of What-Ifs

Ultimately, the AI story comes down to “what-ifs.” What if AGI finally shows up and productivity explodes? Or, what if demand never materializes and the hyperscalers finally blink? With cracks showing—like OpenAI’s recent “Code Red”—it’s impossible to say if we’re headed for a minor correction or a systemic burst.

Our 2026 Recommendations:
  1. Keep a seat at the table: Exposure to market-cap weighted indices allows you to benefit if the “promised land” materializes.
  2. Diversify your sources of risk: Anchor beyond US tech. Gold, international markets, and bonds offer a necessary buffer if signs of excess turn into a choppy ride.

Rebalance systematically: Rebalancing is a controllable hedge. When sector weights become excessive, returning to target allocations helps lock in gains and reduce concentration risk.

Phillip Law, CFA

Senior Portfolio Manager, Warren Street Wealth Advisors

Investment Advisor Representative, Warren Street Wealth Advisors, LLC., a Registered Investment Advisor

The information presented here represents opinions and is not meant as personal or actionable advice to any individual, corporation, or other entity. Any investments discussed carry unique risks and should be carefully considered and reviewed by you and your financial professional. Nothing in this document is a solicitation to buy or sell any securities, or an attempt to furnish personal investment advice. Warren Street Wealth Advisors may own securities referenced in this document. Due to the static nature of content, securities held may change over time and current trades may be contrary to outdated publications. Form ADV available upon request 714-876-6200.

2026 Investment Outlook: AI, Economy, Inflation

With 2025 in the rear view mirror, we look towards the new year. What lessons did we learn and what trends deserve attention? How do we allocate portfolios based on that knowledge? In this piece, we’d like to share three areas of focus heading into 2026:

  1. Artificial Intelligence and Bubbleness
  2. The State of the US Economy
  3. The Biggest Risks to Asset Markets (Namely Inflation)

2025 Recap: Laughing in the Face of Di-worsification:

After years of US led-dominance, we saw narratives across asset classes flip on their heads. For the first time in years:

  • US Stocks underperformed developed international and emerging market geographies.
  • Gold, held for its diversification benefits, shined more brightly than most major asset categories. 

Source: YCharts

The year reminded us that “di-worsification” – a term long used to parody the idea that diversifying into less correlated, non-US assets only made portfolios worse – isn’t a universal truth. In 2025, holding different asset segments helped weather volatile trade policy, weakening dollar, and US deficit concerns.

Ultimately, we left 2025 with a more fragmented globe where nations now emphasize national security and independence over globalized efficiencies. In this new regime where the global economy is de-synchronized, we believe diversification is more essential than ever.

Looking to 2026: What of AI and Its Bubbleness?

The topic of artificial intelligence being a bubble is almost inescapable. AI Hyperscalers, bolstered by massive spending commitments on AI investments,  drove over 60% of the S&P 500’s growth and was a key lifeline for the economy in 2025. With AI hyperscalers and key players constituting a significant portion of the S&P 500, the ecosystem will likely continue to define US markets in 2026. So is it a bubble?

We have a separate piece that deep dives into the AI Bubble question which I’ve summarized below:

The Bull Case:

Proponents argue that this time is different compared to other speculative manias. The players here are profitable, cash-printing businesses whose valuations are not only reasonable, but also are pricing in achievable growth. Furthermore, there is ample demand for infrastructure, particularly data centers, unlike the railroad and dotcom bubbles. This all will enable revenue to follow, which has already exhibited enormous growth rates.

The Bear Case:

Despite tremendous growth, AI companies are spending way more than they’re making, (higher than past bubbles). Demand from businesses remains uncertain, with early studies showing only modest cost savings/revenue gains. Also, most revenue booked today is a result of circular investing amongst AI players. Meanwhile, AI companies are using aggressive accounting methods for their chips, which puts future earnings estimates at risk. Lastly, debt is now being used to finance spending, officially adding a shot clock for return on investment to materialize.

What to Do?

Within the deep-dive, we reach two conclusions: 

1. Focusing on the “bubble” label is often unproductive. Even if excesses exist, timing the eventual “burst” is a fool’s errand—will it be in one year or five? Selling too early means potentially missing out on healthy gains.

As Peter Lynch noted, “Far more money has been lost by investors preparing for corrections, or trying to anticipate corrections, than has been lost in corrections themselves.”

2. The AI dilemma is ultimately a huge collection of what-ifs, but we believe keeping a seat at the table while diversifying sources of risk and return in other parts of the portfolio such as international stocks, bonds, or gold is prudent.

How’s the US Economy?

Objectively speaking, the economy is in a healthy state heading into 2026. Let’s look at a few primary indicators:

  • A Productive Economy – GDP grew at an astonishing annualized rate of 4.3% in Q3 2025 and is projected to grow ~2% (long-term average) in 2026. We expect AI spending to continue as hyperscalers add to productivity and other businesses increase adoption.
  • The Spending Surprise – Despite rising concerns around job security and waning sentiment, Americans are still spending. In late 2025, retail sales surged 3.5% year-over-year and we observed a healthy uptick in credit card balances.
  • Fiscal & Monetary Stimulus: 
    •  Heading into 2026, we’ve unlocked tax credits from the One Big Beautiful Bill (OBBB). We take estimates with a grain of salt, but if $100bn in total tax refunds and a $3,750 average tax cut per filer could further stimulate consumer spending.
    • The market currently anticipates two rate cuts, which will lower the cost of borrowing for both businesses and consumers (maybe more, pending Federal Reserve politics).

With a solid launching pad to start the year followed by additional liquidity in consumers pockets, we believe the US economy is well-equipped heading into 2026.

What About the Risks?

We believe the primary, non-wildcard risk to asset markets is inflation. Although inflation has stabilized from recent years, it remains sticky compared to pre-pandemic levels (around 2%), with the Fed’s preferred measure recently estimated at 2.8%.

The current economic backdrop does allow more sensitivities to a spike in inflation.

  1. Trade fragmentation and tariffs – while most businesses seemingly absorbed the price increases of tariffs in 2025, we’ve begun to see some price hikes passed to consumers in recent inflation prints. 
  2. Is Stimulus a Double-Edged Sword? – While increased liquidity for consumers can be helpful, it may also fuel inflation. The prior stimulus checks led to double-digit drops in equities and bonds (2022) as we raised rates to fight policy-driven inflation.
  3. Financial Repression – With US Debt-to-GDP approaching 120%, there is a risk that policymakers resort to “financial repression” – intentionally allowing higher inflation to “inflate away” the real value of government debt.

With US equities trading expensively and bonds vulnerable to inflation, I’d park this risk in the low probability, but high impact camp. To mitigate this risk, owning a portion of your portfolio to hedges (gold, commodities, natural resources) can cushion against a potential 2022 repeat.

Conclusion:

Ultimately, the backdrop seems favorable for US equity markets heading into 2026. Even if markets are frothy, the solution to managing potential excesses and drawdowns is not in timing them, but instead: a) building adequately diversified portfolios b) aligning allocations with your risk tolerance and financial objective and c) rebalancing into weakness to harness the long-term growth of capital markets at more advantageous price levels.

That’s our 2026 outlook. Our advice remains: use these investing principles as your foundation. This will allow 2026 to be less about watching tickers and more about the life you’re building. Hit that PR, read those books, or learn to cook—aim to achieve your best self. While we can recommend investments and share outlooks, there’s no substitute for investing in your own growth and happiness.

Phillip Law, CFA

Senior Portfolio Manager, Warren Street Wealth Advisors

Investment Advisor Representative, Warren Street Wealth Advisors, LLC., a Registered Investment Advisor

The information presented here represents opinions and is not meant as personal or actionable advice to any individual, corporation, or other entity. Any investments discussed carry unique risks and should be carefully considered and reviewed by you and your financial professional. Nothing in this document is a solicitation to buy or sell any securities, or an attempt to furnish personal investment advice. Warren Street Wealth Advisors may own securities referenced in this document. Due to the static nature of content, securities held may change over time and current trades may be contrary to outdated publications. Form ADV available upon request 714-876-6200.

Periodic Table of Investing

Periodic Table of Investing

Dust off your memories of high school chemistry and think of your investment returns and your investment risks as two separate and distinct members of the periodic table. Certain elements (in this case, securities) are prone to interact when mixed, while others may remain neutral. Each element (security) will always have its own separate and unique profile and characteristics.

Starting with carbon, one of the world’s most important elements, I’d equate carbon to U.S. stocks. Regardless of age, every investor we work with has likely benefited from or utilized this element and will continue to do so in some capacity going forward.

Argon, the world’s least reactive element, tends to be more akin to Treasury Bonds or cash, not responding negatively to volatility much, if at all.

I’m far from the first person to think of investments in this way, in-fact there is deep history in what many refer to as the “Callan Chart” or “Periodic Table of Returns”. Below you’ll see a large majority of the world’s major asset classes and their returns relative to zero:

Callan from Zero

https://www.callan.com/periodic-table/

The most striking thing from this chart is that after a disastrous 2008 for everything except U.S. Bonds (argon), the only asset class that is yet to have a negative year is Large Cap ($10B+) U.S. Stocks (starred).

Winners and Losers

SPY vs ACWI vs EEM

Charlie Bilello via Twitter

This freedom from negative returns and the compounding of large year-to-year gains has led to outsized outperformance from Large U.S. stocks. Over the last 10 years, Large U.S. stocks have produced cumulative total returns of 158%. Developed Foreign Country stocks have produced 19% and Emerging Markets only 16%.

Two takeaways from this are: the power of compounding positive returns but even more important is the force of losses and the time it takes to make them up. In addition, one recurring theme of study and practice in investing is that asset prices move in cycles. While U.S. outperformance seems like an unbreakable cycle, it’s just a matter of time.

Trading Places

Take a look below at how U.S. and international stock market leadership has traded off over time. Most recently international stocks outperformed from 2003-2009, and the U.S. finds itself on its longest stretch of outperformance since 1979.
Performance Leadership

We have been incrementally positioning our clients’ portfolios for this eventual inflection since 2015. Last year we looked right, this year thus far we look wrong. Personally, I just consider myself patient as I wait for a multi-year trend to unfold.

Whether it’s high prices and valuation concerns or much of the low hanging fruit in our U.S. economic recovery is out of the way, we have a firm conviction in our posture of reducing U.S. stock market exposure. Having said that, we do not have a proverbial crystal ball, therefore we diversify and avoid throwing all of our eggs into the international basket.

Don’t Give up on Bonds

In addition, we haven’t given up on bonds, which have been tough to own this year, with U.S. Bonds down on average -1.62%.


Callan Periodic Table

https://www.callan.com/periodic-table/


It’s important to keep in mind how bonds have performed during down years for the stock market, something that is potentially in the cards this far into an extended bull market.

bonds vs stocks

One does not need to own the entire U.S. bond market via an index fund or otherwise. We currently prefer shorter term bonds, typically corporate bonds, and even in some cases inflation protected bonds. With a recent uptick in short-term government bonds, they aren’t nearly as painful to hold as in years past when yields hovered near zero. The 2-year treasury currently yields 2.829%, at the time of writing this article.

Late Cycle Playbook

With a backdrop of rising inflation globally, rising rates here in the U.S., accommodative monetary policy globally, and stretched valuations in U.S. equity markets, we continue to prefer assets that tend to outperform late in the economic cycle and when the factors above are present.

These assets include:

  • International and Emerging Market stocks
  • Industrials, Metals, Energy
  • Shorter Term Bonds, TIPS

Signing Off

While we realize this year has been far less exciting than the last, we remain firm in our convictions on how we want to combine elements from the “Periodic Table of Returns” moving forward. We stand at the ready to buy into recent market weakness and will not capitulate to chasing what has done well. We appreciate your continued trust and patience while we navigate through what’s been an unstable first half of 2018. Don’t hesitate to contact our office should you have any questions or concerns about how we are approaching your investments.

Respectfully yours,

Blake Street, CFA, CFP®


Blake StreetBlake Street, CFA, CFP®
Chief Investment Officer
Founding Partner
Warren Street Wealth Advisors

Blake Street is an Investment Advisor Representative of Warren Street Wealth Advisors, a Registered Investment Advisor. Information contained herein does not involve the rendering of personalized investment advice, but is limited to the dissemination of general information. A professional advisor should be consulted before implementing any of the strategies or options presented.

Any investments discussed carry unique risks and should be carefully considered and reviewed by you and your financial professional. Past performance may not be indicative of future results. All investment strategies have the potential for profit or loss. Changes in investment strategies, contributions or withdrawals may materially alter the performance, strategy, and results of your portfolio. Historical performance results for investment indexes and/or categories, generally do not reflect the deduction of transaction and/or custodial charges or the deduction of an investment-management fee, the incurrence of which would have the effect of decreasing historical performance results. Economic factors, market conditions, and investment strategies will affect the performance of any portfolio and there are no assurances that it will match or outperform any particular benchmark. Nothing in this commentary is a solicitation to buy, or sell, any securities, or an attempt to furnish personal investment advice. We may hold securities referenced in the blog and due to the static nature of content, those securities held may change over time and trades may be contrary to outdated posts.