Is Tesla Flying Too Close to the Sun?
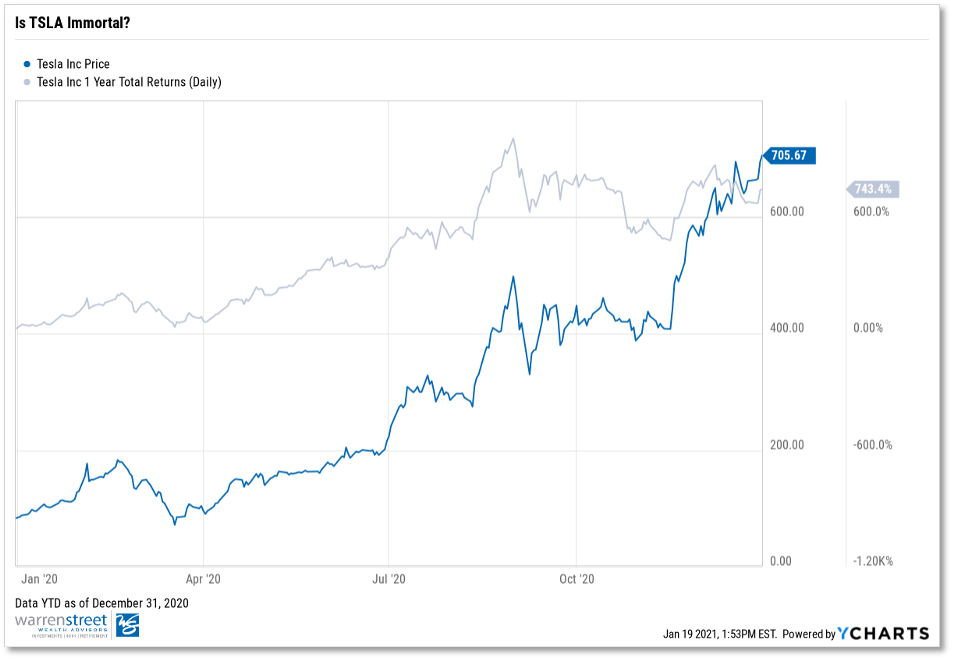
743%. That’s how much Tesla stock (Ticker: TSLA) returned in 20201. Most of us are aware of the bifurcation between the market’s seemingly invisible ceiling and the economy’s continued disarray, but nobody could have foreseen that Elon Musk and his army of “musketeers” would be amongst those most rewarded for owning increased allocations of TSLA stock.
In fact, 2020 was an eventful year for the electric vehicle company. Among a series of roller coaster weeks, a stock split announcement, and raging debate over analyst price targets, perhaps TSLA’s most noteworthy 2020 phenomenon was its inclusion in the S&P 500 Index – a profound move that has us concerned over the stock’s perceived immortality at the forefront.
On December 21, 2020, the S&P 500 Index committee formally added the “profitable” carmaker to the index after denying TSLA index entry earlier in the year. The circumstances around this inclusion eerily resembles something we’ve seen before. Does “You’ve Got Mail” ring a bell? That’s right – we see multiple uncanny parallels between the TSLA and former net stock giant: American Online (AOL).
Echoes of The Past
On December 23, 1998, Standard & Poor’s announced it would make American Online the first “net” stock featured in the S&P 500 Index. Leading up to the announcement, AOL rallied 510% year-to-date2, before ending the year with a return of 585%. Compare this to TSLA, which had run-up 388%3 by the time the committee made its announcement on November 16, 2020. As mentioned previously, TSLA’s 2020 return was 743%. Notice here that a large proportion of TSLA’s 2020 return came in the last month and a half in the year…talk about upward volatility.
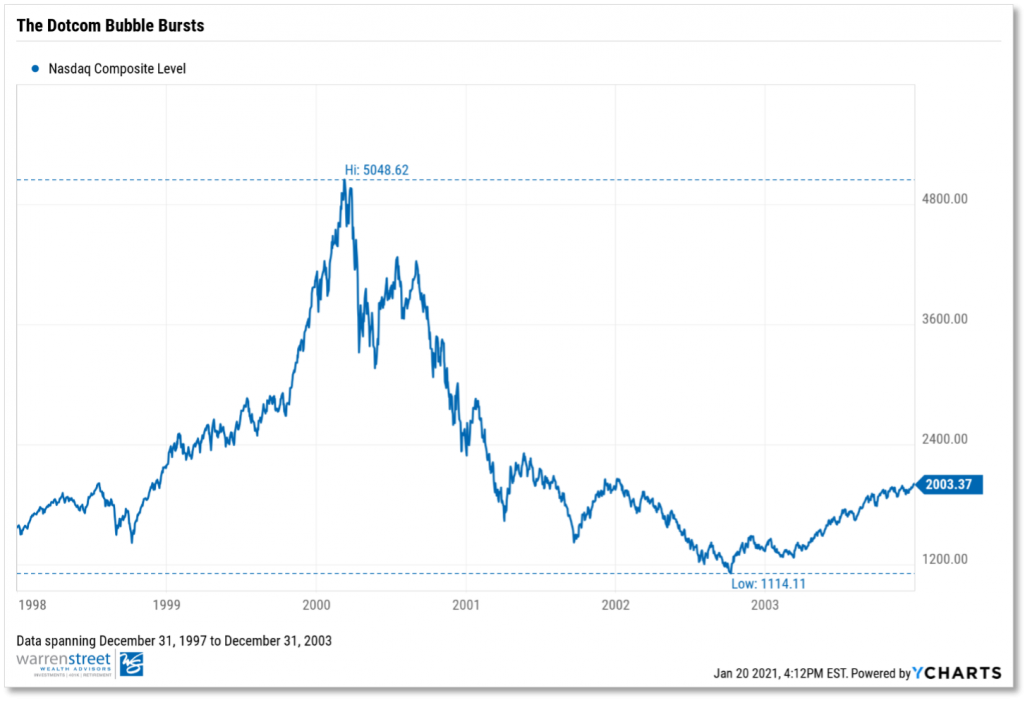
Arguably, the most intriguing similarity between these two stocks is the amount of price action driven by momentum and fear of missing out (FOMO). Investors overlooked red flags related to both AOL’s fundamentals and underlying profitability of tech stocks. AOL eventually lost 91%4 of its market value after a failed merger with Time-Warner cable. Meanwhile, valuations of tech stocks (represented by the Nasdaq Index) peaked in early 2000 before seeing 78%5 of its value disintegrate. Fast forward to the end of 2020, you have Tesla, a company whose “profitability” is primarily tied to energy credits, octupling (8x) its stock price to levels many investors deem uncomfortable.
Will TSLA suffer the same fate as AOL and other dotcom counterparts? Obviously 2021 is a different year. The carmaker makes electric-powered cars, not an instant messaging platform. We do acknowledge that historical performance is not indicative of future performance; and that correlation does not equal causation. However, it’s important to remember that those who don’t learn from history are doomed to repeat it.
How Much TSLA Do You REALLY Own?
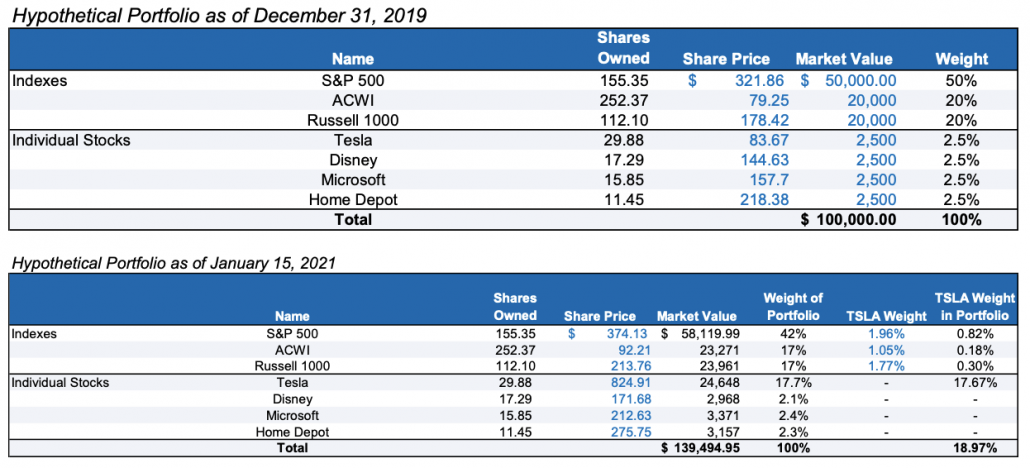
TSLA’s inclusion in the S&P 500 Index raises a new challenge for investors: hidden concentration risk. With TSLA now a part of the NASDAQ, Russell 1000, and widely regarded S&P 500, owning index funds inherently carries TSLA exposure. Borrowing from our friends over at WisdomTree, imagine a scenario where Portfolio A holds broad index funds in addition to a few well-known names.
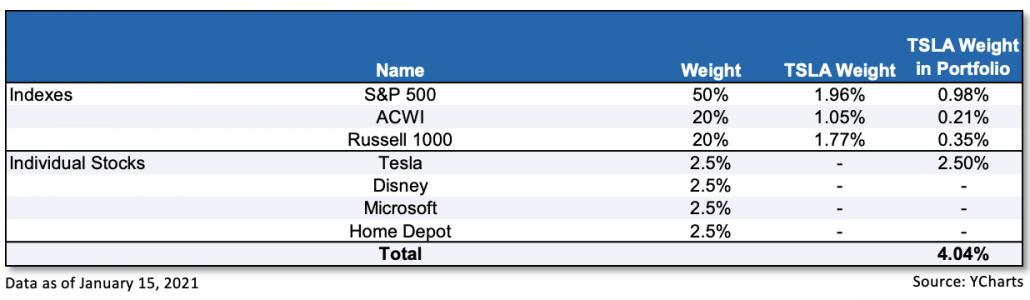
What investors thought was a 2.50% allocation to TSLA is at 4.00%6. I know, I know. 4% doesn’t seem like a big deal. Besides, what investor puts 90% of their equity allocation into only broad U.S. ETFs? (You’d be surprised). The more important point though, is that volatile price action with TSLA can hide how much of the stock you really own.
At the end of 2019, TSLA shares were at $83.67. As of Friday, January 15, 2021 – the stock sits at $824.91 – almost ten times over its stock price just a year ago. Let’s say you owned Portfolio A on December 31, 2019. As of January 15 this year, TSLA would comprise 19% of Portfolio A’s exposure (see Appendix A). Obviously, price appreciation and concentration risk create their own problems (e.g., skewed returns, tax consequences), but when the underlying rationale for that price appreciation is in question by the investment community at large, you could have an even bigger problem on your hands.
Will TSLA Fall Back Down to Earth?
Today, it seems as if TSLA has really shot over the moon, multiplying its stock price ten times in a little over a year. Will the carmaker continue to defy odds throughout 2021? Or, is Tesla a ticking-time bomb waiting to explode?
We at Warren Street Wealth Advisors aren’t equity research moguls here to publish a Buy, Sell, or Hold on this highly debated stock. However, we do acknowledge that no company is immune from idiosyncratic risk. Whether Tesla can stay above the influx of foreign competition (e.g., NIO, Volkswagen), or whether or not valuations are outstretched represent just a few of many risks to the company’s stock price.
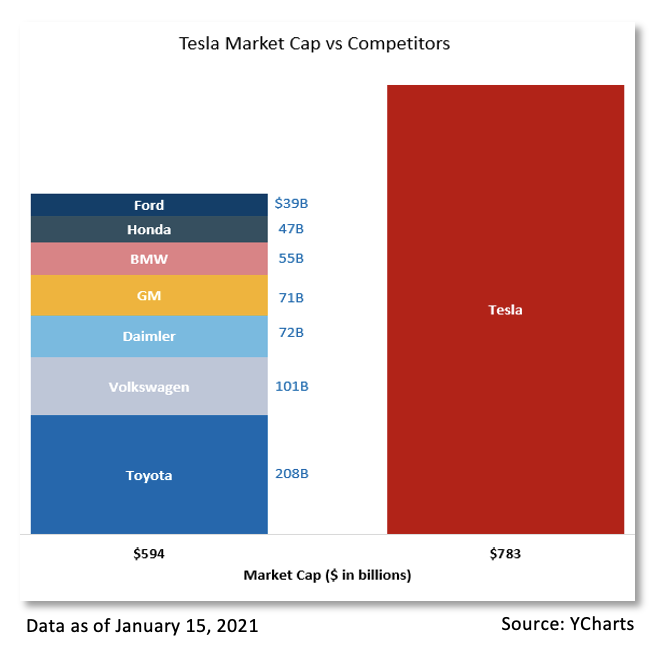
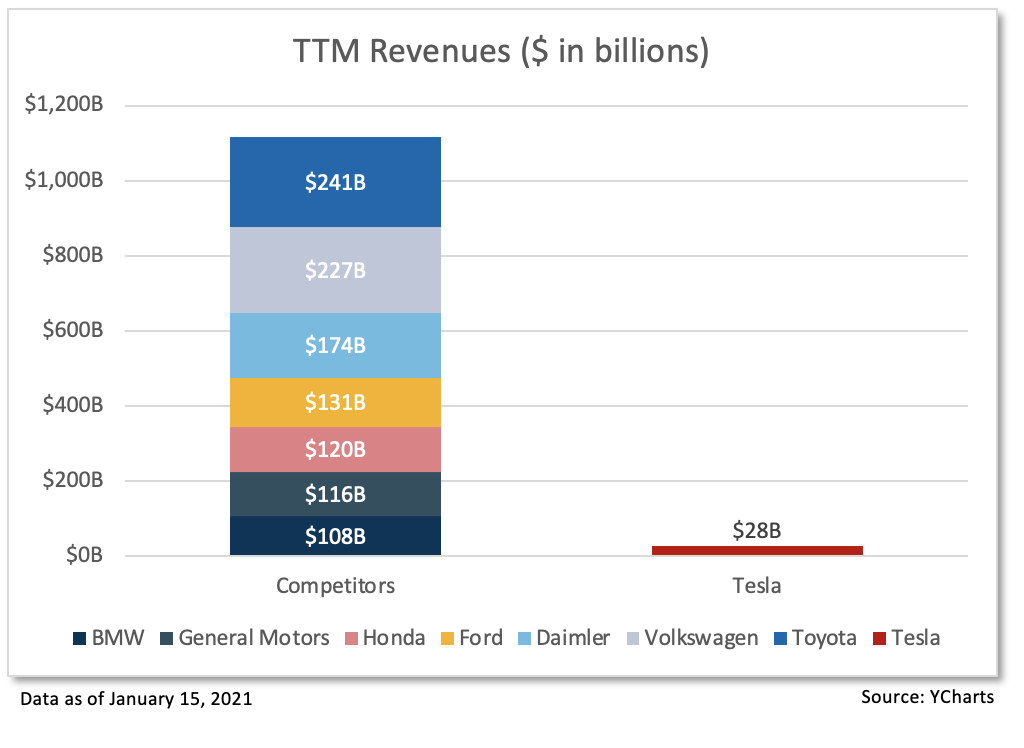
One observation fueling TSLA’s controversy is that despite having a much larger market cap relative to other established vehicle manufacturers (see above), the company only generated $28.2 billion in sales7. Compare this to a combined $1.1 trillion in sales7 for all its auto competitors listed above. How can a company, which does a fraction of its competitors’ sales, be worth more than all of them combined? Again, TSLA isn’t just a car company – it’s thought to be a generational leader driving the next revolution in clean energy; but nevertheless, some food for thought while you’re on the road.
Tesla’s ride sure was wild in 2020, and nobody can guarantee what will happen in 2021. However, as prudent investors, it’s important to not overlook the implications that a high-flying stock can have on client portfolios. We’re not here to argue whether Tesla’s run has just begun or if the stock’s price is dangerously inflated. But if the latter of those two ideas rings true, the world could be shocked when it sees electricity and a bubble come together.
Footnotes:
- YTD total return as of 12/31/2020 sourced to YCharts.
- YTD total return for 12/23/1998 and 12/31/1998 sourced to historicalstockprice.com.
- YTD total return as of 11/16/2020.
- AOL’s market cap plummeted from $226 billion to roughly $20 billion in 2003, sourced to Bezinga.
- NASDAQ percent off high spanning 12/31/1997 to 12/31/2003.
- 4.04% is the summation of multiplying TSLA weight in index by index weight in portfolio.
- Trailing twelve-month figures.
Appendix A
For any questions regarding international investments, emerging markets, or wealth management, please call 714-876-6200 or email phillip@warrenstreetwealth.com.

Phillip Law, Portfolio Analyst
Wealth Advisor, Warren Street Wealth Advisors
Investment Advisor Representative, Warren Street Wealth Advisors, LLC., a Registered Investment Advisor
The information presented here represents opinions and is not meant as personal or actionable advice to any individual, corporation, or other entity. Any investments discussed carry unique risks and should be carefully considered and reviewed by you and your financial professional. Nothing in this document is a solicitation to buy or sell any securities, or an attempt to furnish personal investment advice. Warren Street Wealth Advisors may own securities referenced in this document. Due to the static nature of content, securities held may change over time and current trades may be contrary to outdated publications. Form ADV available upon request 714-876-6200.