2019: A Year for the Record Books
Key Takeaways
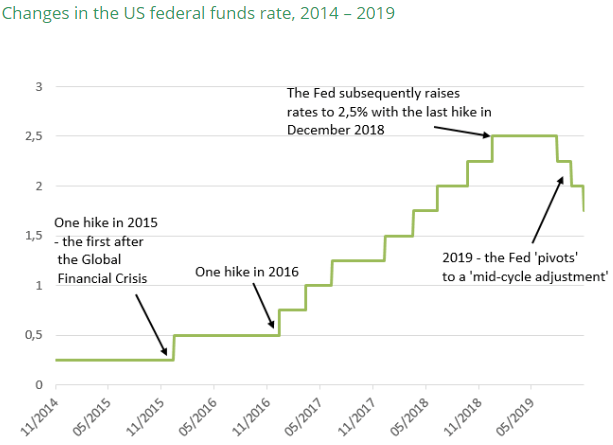
2019 turned out to be one of the best years for the financial markets in recent history. To understand how we got there, it’s helpful to consider where we began. Factset did a very good job of this on its website insight.factset.com: “As we began 2019, the big economic stories were the Fed’s series of interest rate hikes (four in 2018), the ongoing U.S. government shutdown, the December 2018 stock market drop (S&P 500: -9.2%, DJIA: -8.7%), and the escalating U.S.-China trade war. As the year progressed, we saw movement on all fronts.” The bullet points below provide a useful summary:
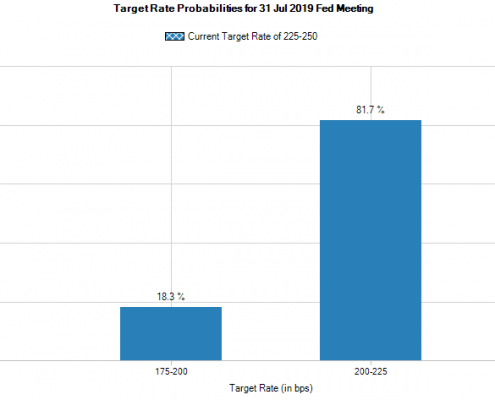
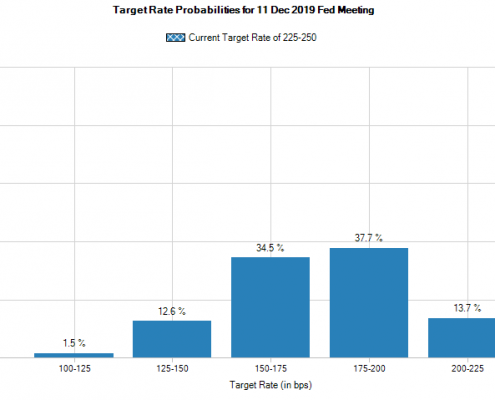
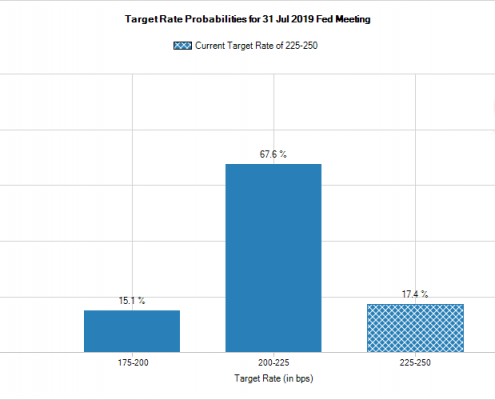
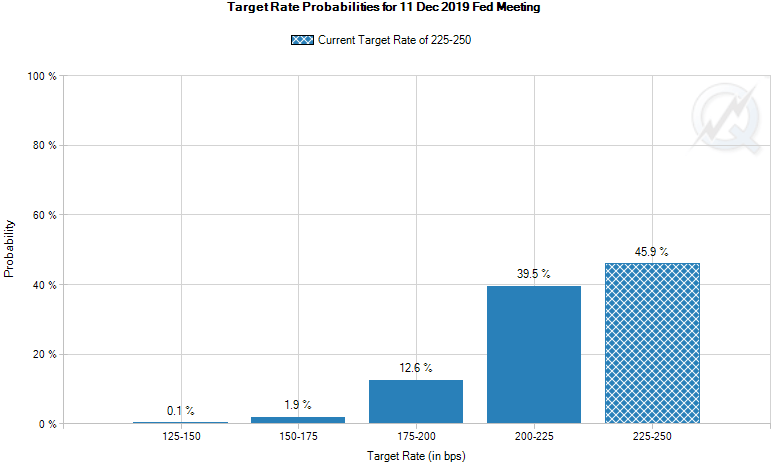
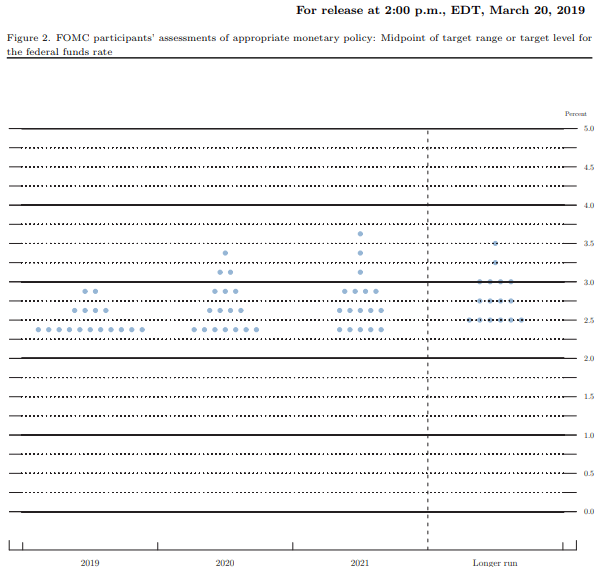
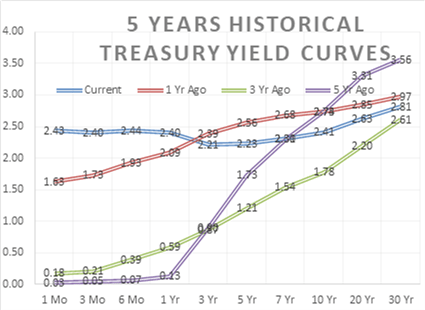
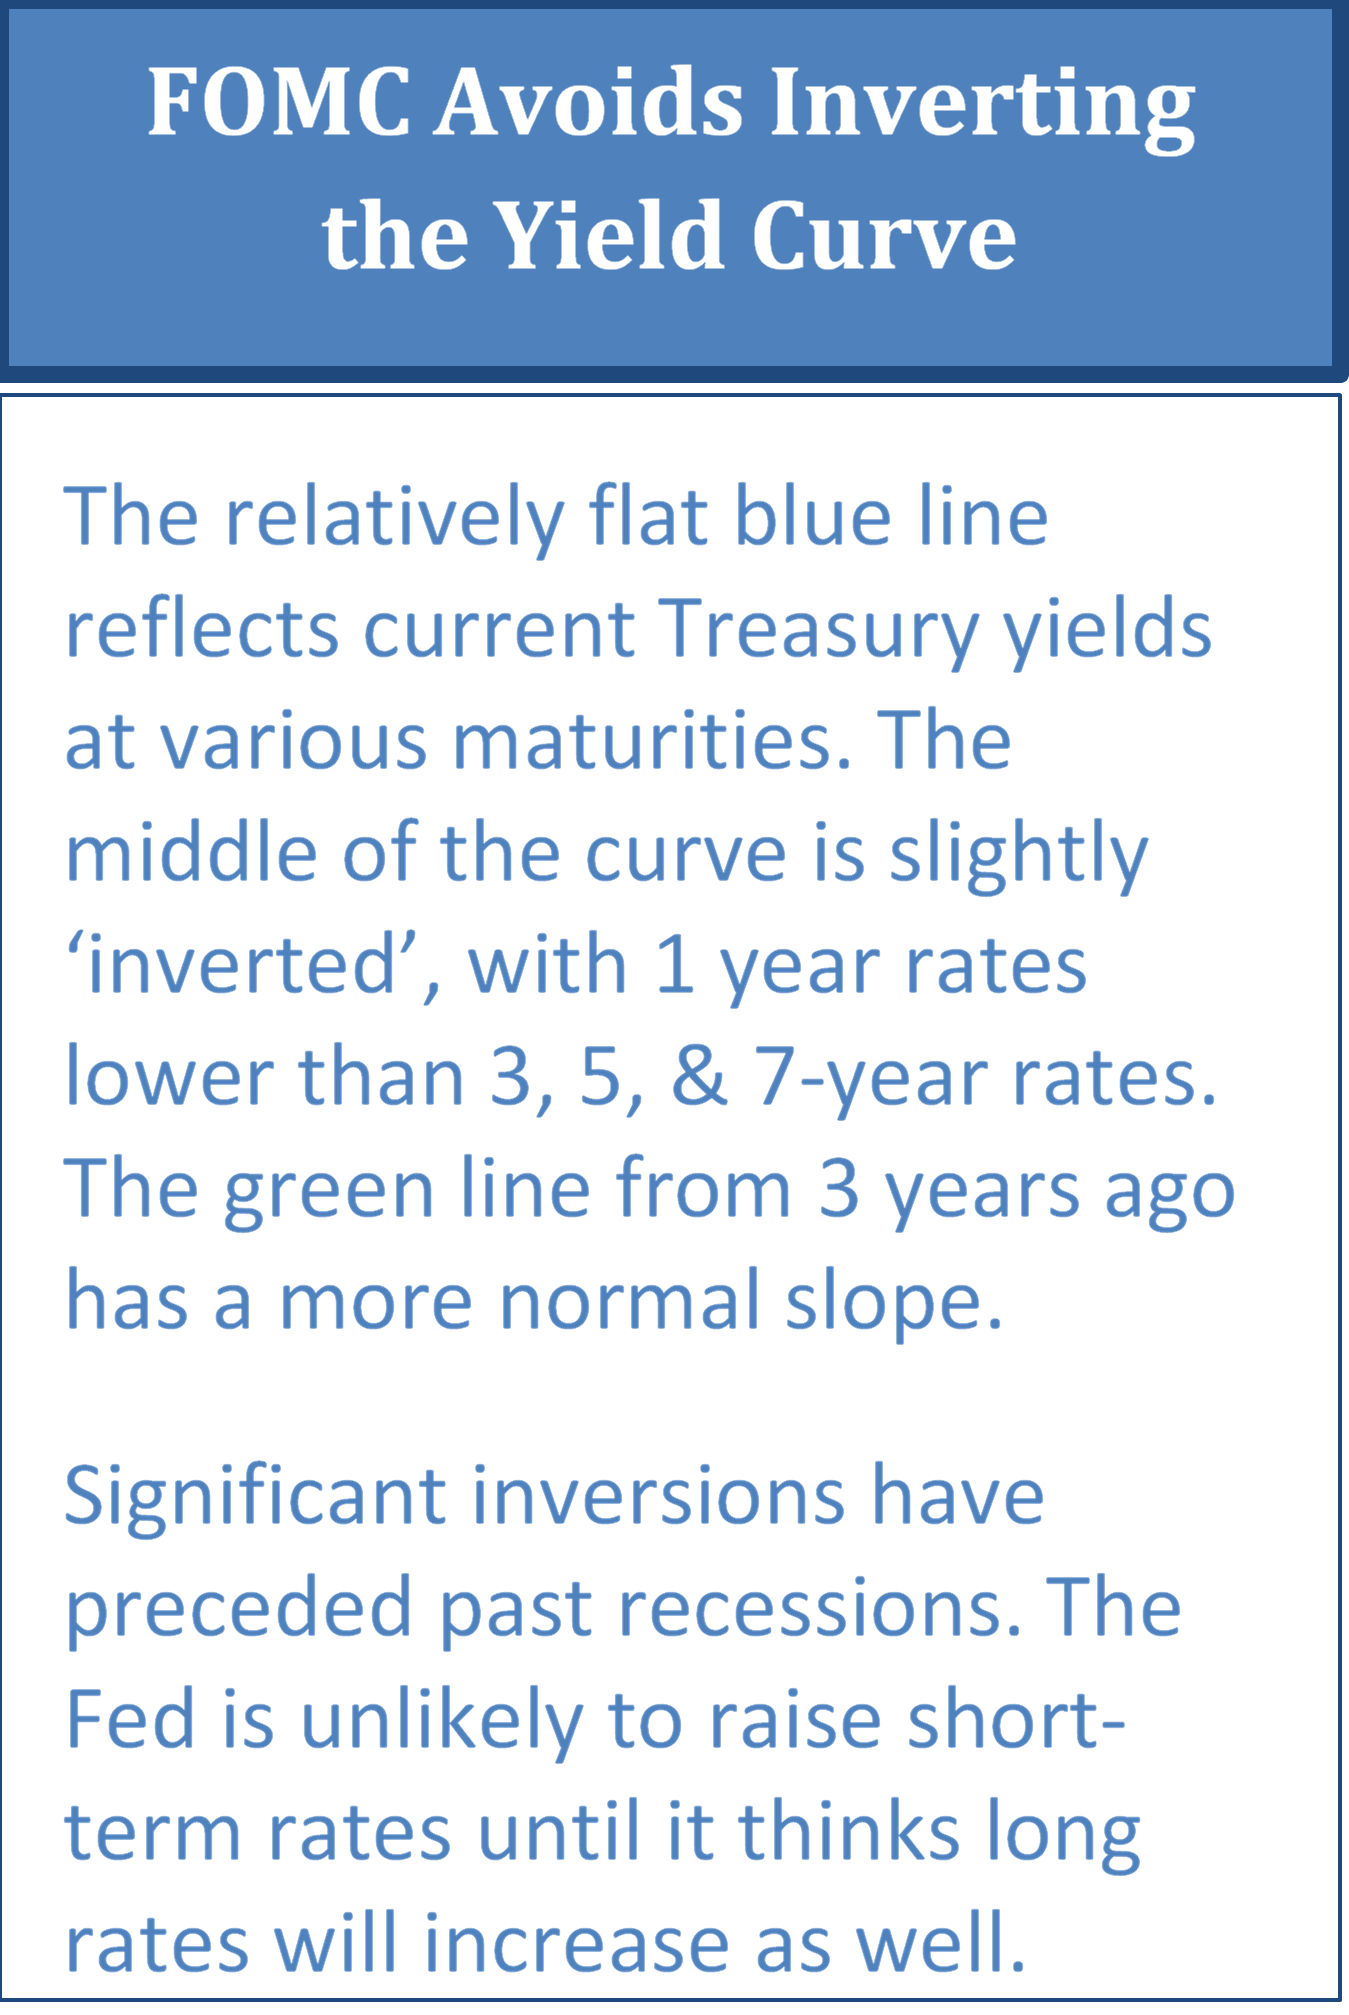
- The Fed’s 2018 interest rate hikes were partially reversed as the FOMC cut rates three times in the second half of the year in reaction to a growing number of signals flashing recession.
- The 35-day U.S. government shutdown, which ended on January 25, 2019, was the longest U.S. government shutdown in history. With many federal agencies closed and federal employees across the country furloughed or working without pay, the Congressional Budget Office estimates that the shutdown cost the economy $11 billion, $3 billion of which was permanently lost.
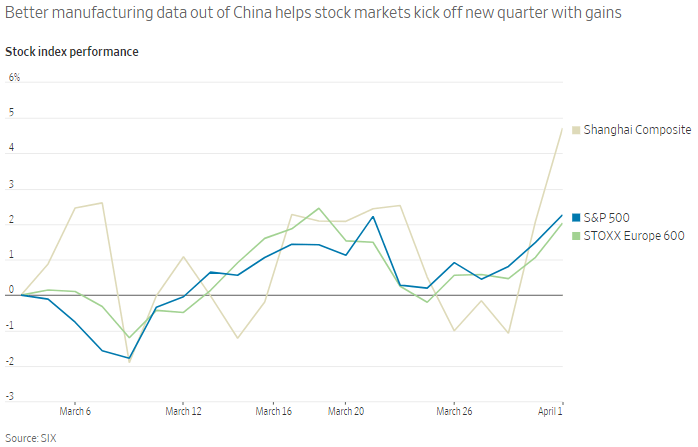
- The ups and downs of U.S.-China trade negotiations sent global stock markets on a roller coaster ride throughout the year. As the year comes to a close, the U.S. has reached a so-called “Phase 1” trade agreement with China that reduces some of the tariffs imposed over the last 18 months and stops the imposition of a new set of tariffs set to go into effect on December 15. For its part, China has agreed to purchase more U.S. agricultural products. While the agreement helps to diffuse global anxiety surrounding the growing trade tensions, it fails to address significant concerns around technology and intellectual property rights. Still, equity markets have responded positively to the news, surging to new highs.
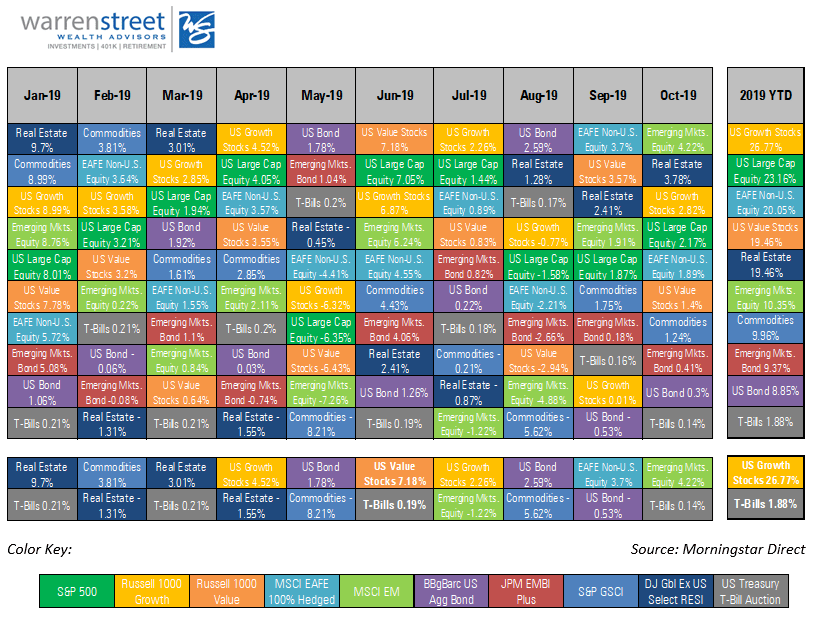
With this context in mind, how did the markets do in 2019?

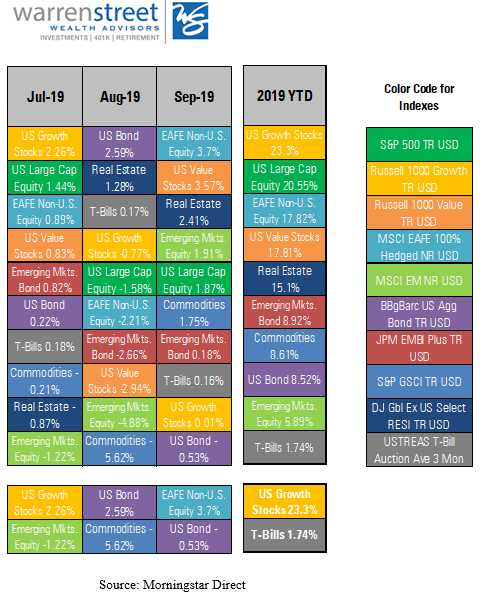
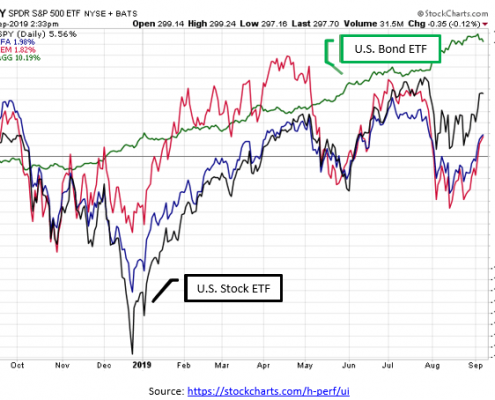
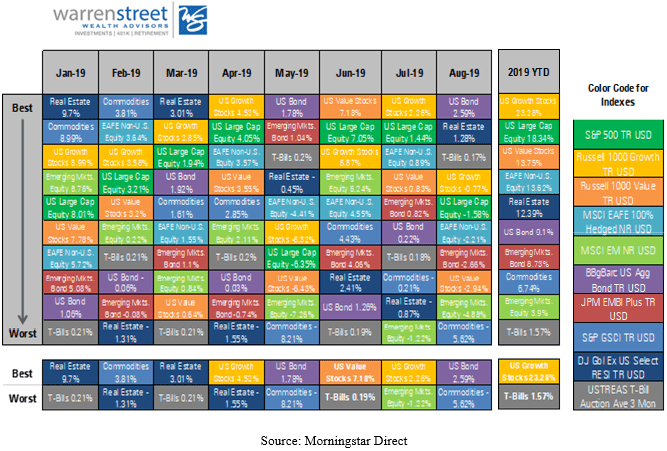
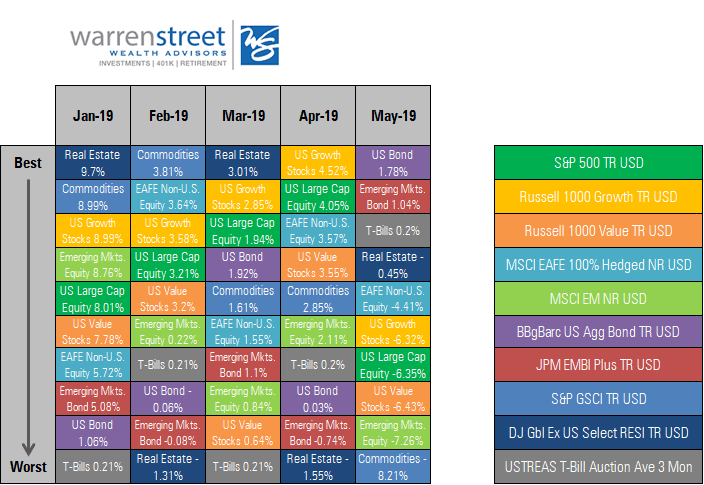
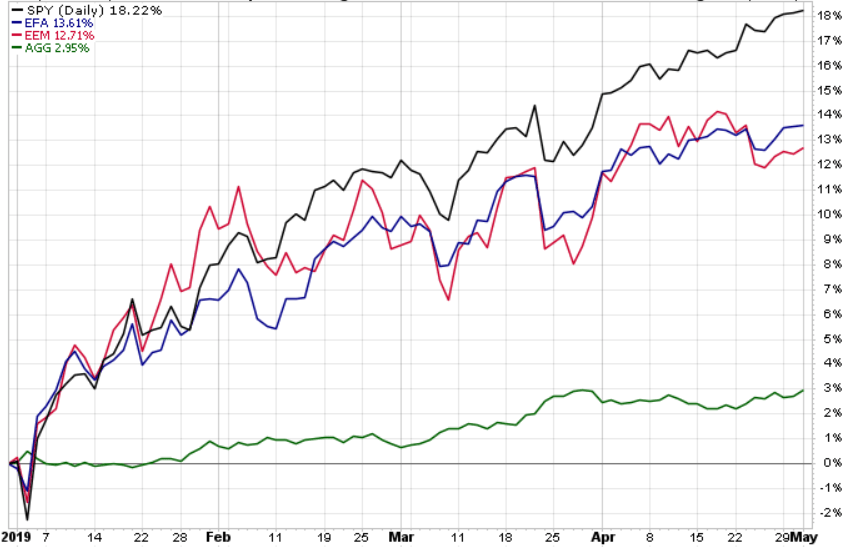
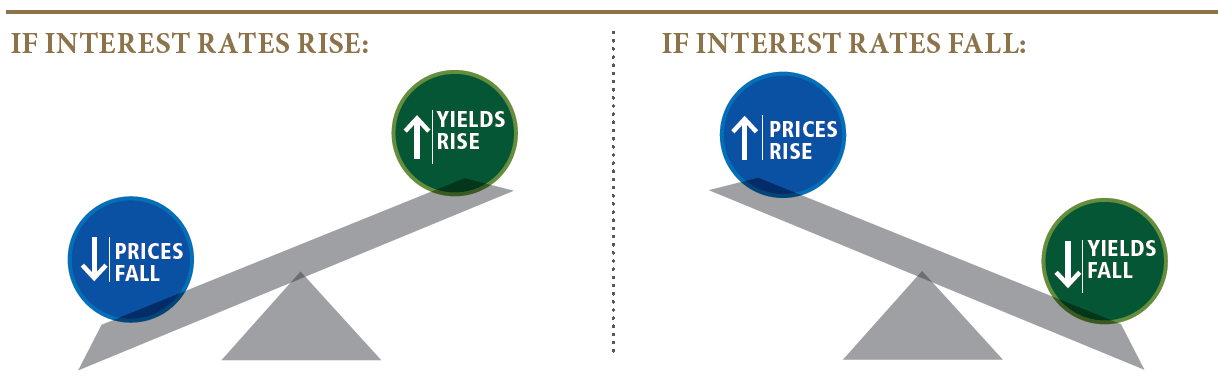
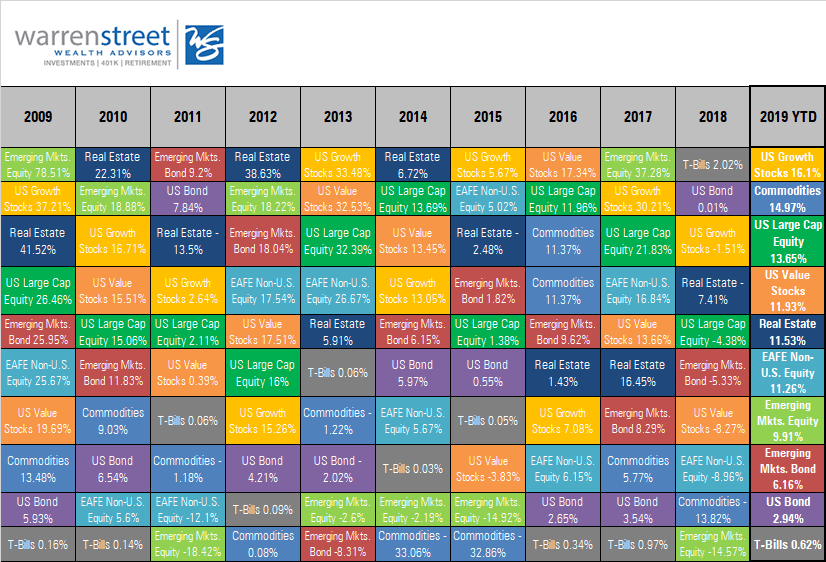
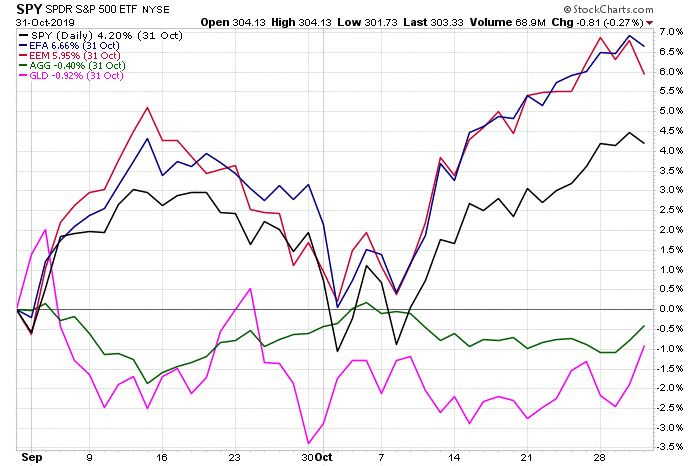
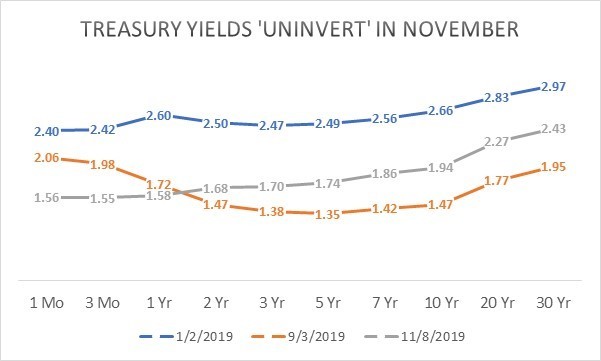
Risk assets powered forward in December. After a rocky ride of positive and negative returns during the year, emerging markets stocks charged to the front of the pack in December. EM Equity crossed the finish line in the middle of the field with a return of 18.4%, about half the return of the winning asset class, U.S. Growth stocks (36.4%). U.S. Large Cap was 2nd at 31.5%, U.S. Value stocks came in 3rd at 26.5%, and International stocks were 4th at 24.63%. Though bonds trailed the field at 8.7%, this is more than twice the 10-year average for the Barclay’s Aggregate Bond Index, which was supercharged by falling Treasury yields as the Fed repeatedly lowered its short-term interest rate target.
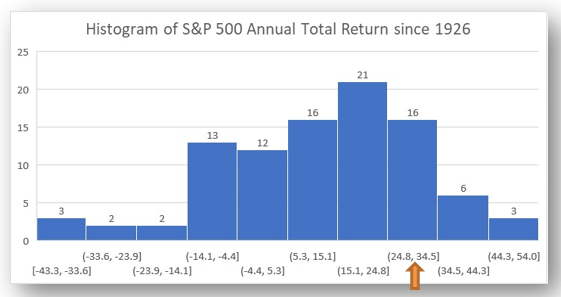
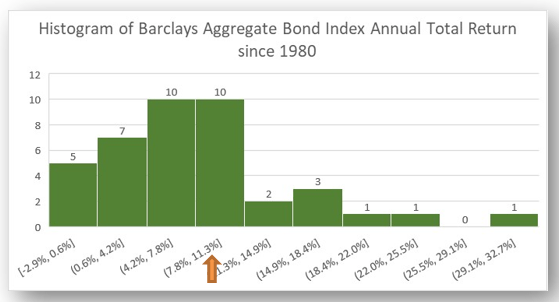
The S&P500 total return for 2019 was the 18th best since 1926, 8th best since 1970, and 4th best since 1990[1]. The Barclays Aggregate bond index had its 13th best year since 1980[2].
What can we expect from the markets in 2020?
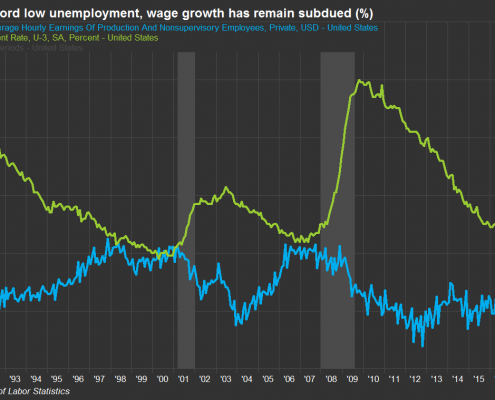
An era of the ‘haves’ and ‘have nots’. Technological innovations from industrial automation to ‘fracking’ to high speed data connections and the ‘internet of things’ has brought the world out of scarcity and into surplus. But this abundance is not felt by all – perhaps not even by most. Those with access to these technologies, either via infrastructure or financial resources, unlock a brave new world of possibilities. Those without such access are left behind. While wages generally have begun to increase, median incomes are not rising fast enough, causing the gap between economic winners and losers to widen. This situation has sparked political protests and dissatisfaction among working-class people around the world. Combined with the uncertain outcome of the presidential election in the U.S., never-ending Brexit negotiations in the U.K., and military conflicts and political posturing around the world, the global economy could stumble if government agents make a serious misstep.
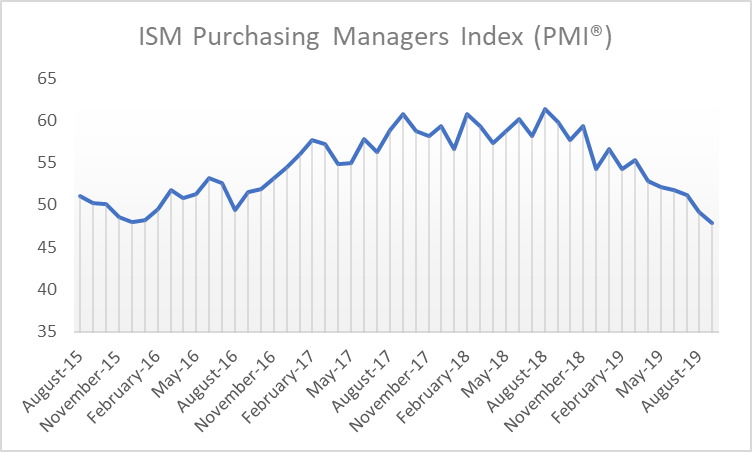
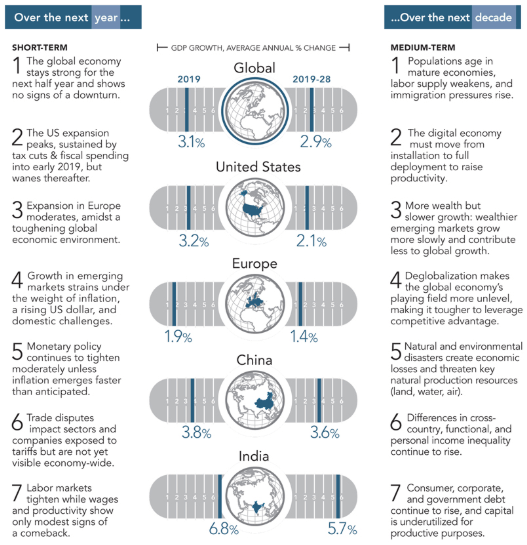
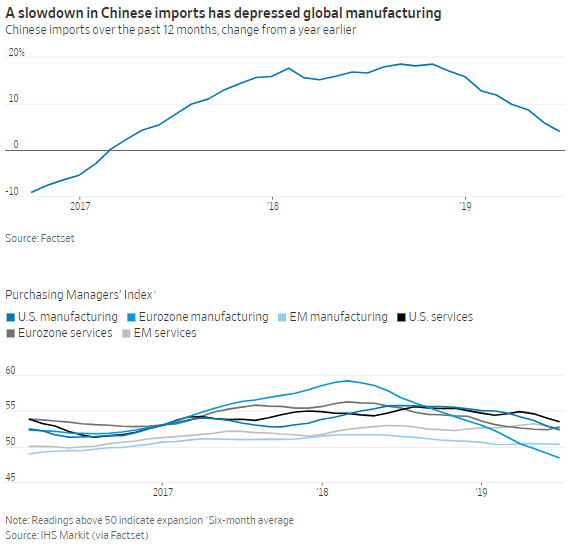
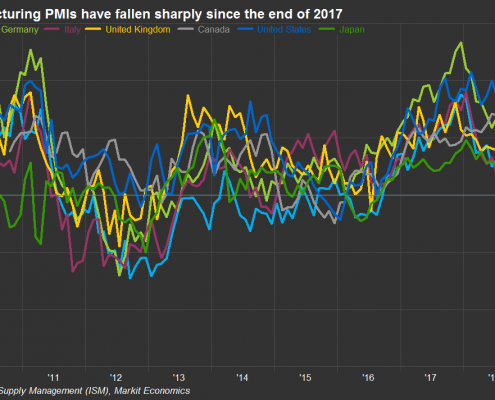
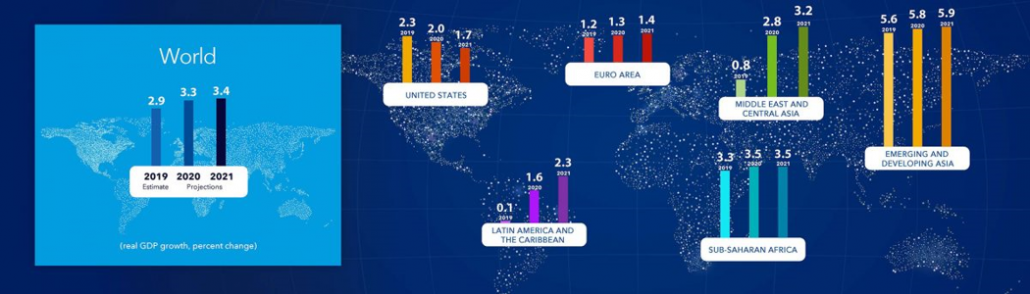
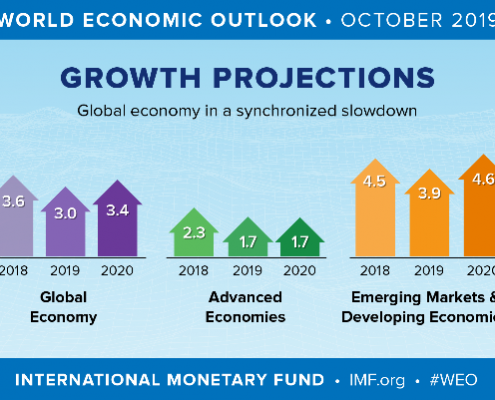
Despite these risks, the IMF continues to forecast stronger global economies in 2020 and beyond. According to the latest update to the IMF World Economic Outlook[3], global growth is forecast to improve from 2.9% in 2019 to 3.3% in 2020 and 3.4% in 2021 due to easing trade tensions, strong labor markets and service sectors, and accommodative monetary policy. IMF economists also see welcome indications that the global slump in manufacturing and trade may have bottomed out.
This positive outlook is contingent on the recovery of less-developed countries currently dealing with stressed political and/or economic conditions: Argentina, Iran, Turkey, Brazil, India, and Mexico. Advanced economies such as Europe and the U.S. are likely to continue to grow less than 2% per year.
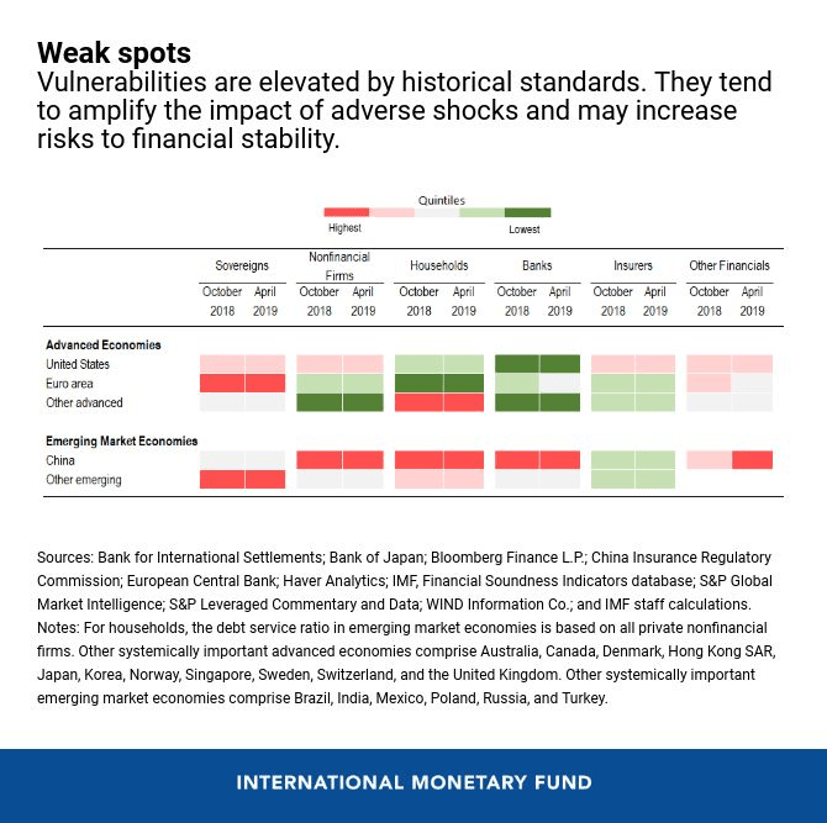
This outlook could change quickly if new trade tensions emerge or social unrest around the world intensifies. The IMF ‘vulnerabilities’ table below reports that the financial condition of sovereign nations is vulnerable to economic shocks. This vulnerability is due in part to a lack of room for fiscal or monetary agents to maneuver given high budget deficits and the very low level of government interest rates in many countries. Businesses and households in developed economies are generally solid, but households in emerging economies remain insecure.
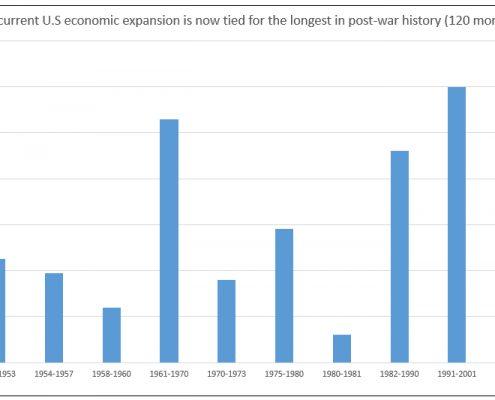
Bottom line: Economic expansions don’t die of old age. U.S. and international economies successfully navigated a year full of social and political tensions and uncertainty, despite being in the late stage of a record-setting expansion. Low interest rates and muted inflation are enabling businesses and households to take on new ventures where they see a suitable potential reward. And unlike the expansion which preceded the financial crisis of 2008-2009, ‘asset bubbles’ and excessive risk-taking have been limited due to the many disruptions experienced during 2019 and the uncertain future outlook.
While risks to this outlook are clear and present, we are cautiously optimistic that policymakers and financial markets will continue to thread the needle between crisis and excess, and that 2020 will be a relatively peaceful and prosperous new year.

Marcia Clark, CFA, MBA
Senior Research Analyst, Warren Street Wealth Advisors
DISCLOSURES
Investment Advisor Representative, Warren Street Wealth Advisors, LLC., a Registered Investment Advisor
The information presented here represents opinions and is not meant as personal or actionable advice to any individual, corporation, or other entity. Any investments discussed carry unique risks and should be carefully considered and reviewed by you and your financial professional. Nothing in this document is a solicitation to buy or sell any securities, or an attempt to furnish personal investment advice. Warren Street Wealth Advisors may own securities referenced in this document. Due to the static nature of content, securities held may change over time and current trades may be contrary to outdated publications.
Form ADV available upon request 714-876-6200
[1] https://www.slickcharts.com/sp500/returns
[2] https://www.thebalance.com/stocks-and-bonds-calendar-year-performance-1980-2013-417028
[3] https://blogs.imf.org/2020/01/20/tentative-stabilization-sluggish-recovery/

 Marcia Clark, CFA, MBA