Market Commentary – December 2018
Market Commentary – December 2018
Key Takeaways
- Though the U.S. stock market closed the year with its first annual loss since 2008 (S&P 500 -4.38%)(1), investors retained the vast majority of gains earned in 2017 (21.83%.) International stocks as measured by the MSCI EAFE(2) index were down -8.96%, giving up just over half of 2017’s gains (16.84%), and the Barclays Aggregate U.S. bond index ended the year flat at +0.01% after a very strong November and December.
- Though market turbulence in the 4th quarter felt extreme, volatility over the year didn’t approach the peaks seen after the Dot Com bubble burst in 2001-2002 or during the financial crisis of 2008-2009.
- Global financial markets tend to exhibit a ‘sector rotation’ pattern of recent losers becoming the next period’s winners. If the pattern holds true, international stocks are poised for a strong year in 2019.
- 2018’s poor performance followed an unusually steady 10-year period of growth. Investors bold enough to put their money at risk after the market plummeted in 2008 were handsomely rewarded. Investors willing to do the same in 2019 may be rewarded once again.

It wasn’t pretty, but the year is finally over and we already see indications of better times ahead in 2019.
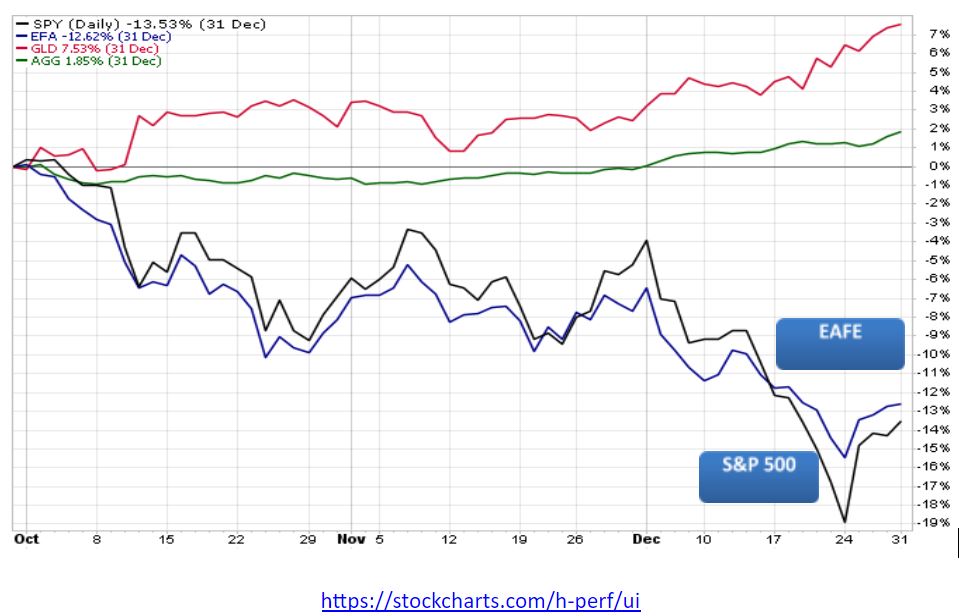
Though the U.S. stock market closed the year with its first annual loss since 2008 (-4.38%) , investors retained the vast majority of gains earned in 2017 (21.83%) and the previous 9 years of recovery post the 2008 financial crisis. Though European stock markets fell behind the U.S. last summer and never caught up, these markets also ended 2018 well ahead of where they started in 2017. International stocks as measured by the MSCI EAFE index were down -8.96% in 2018 compared to +16.84% in 2017, and U.S. bonds ended the year flat after recovering strongly late in the 4th quarter.

Source: https://stockcharts.com/h-perf/ui
Market sectors which lagged in the strong quarters, especially bonds (AGG) and gold (GLD), provided welcome relief during the 4th quarter downturn. International stock markets avoided some of the December tumble and rebounded into January 2019, easing some of the pain from lagging the robust U.S. market earlier in the year.

The return of stock market volatility in the 4th quarter surprised investors, especially compared to an unusually stable 2017.
Volatility in 2018 was more than double that of 2017, though did not approach the peak volatility seen during the financial crisis of 2008-2009 and post the Dot Com bubble/credit crisis in 2001-2002. The pattern seems to be that periods of unusual stability are often followed by a spike in volatility. We know that the past isn’t always reflective of the future, but as Mark Twain is reported to have said: “History doesn’t repeat itself, but it often rhymes.”

Just as periods of stability are often followed by turbulence, extreme market moves are commonly followed by reversion toward the mean (average).
This tendency is illustrated by the two charts below. The first chart shows the drop in the SPY and EFA ETFs in the period between July-November 2011. Notice the jagged ups and downs just after the drop, followed by a fairly steady up-trend through 2013, though not without some negative surprises along the way.

We see a similar pattern in the 4th quarter of 2015 before the start of the bull market of 2016-2017.

And while the downturns are painful, they tend to be relatively brief compared to the recovery period.

- Dot Com bust lasted from early 2000 to early 2003, followed by 5 years of positive returns
- Financial crisis crash lasted from late 2007 to early 2009, followed by 9 years of mostly positive returns
- Less dramatic declines in 2011 and 2015 were followed by 3 years of positive returns
Asset class returns tend to follow a ‘sector rotation’ pattern with prior period winners commonly falling in the rankings in subsequent periods, and prior period losers tending to rise in the rankings.

Source: Morningstar Direct
Though historical context is helpful, we need to face forward when making investment decisions. Following the crowd and expecting history to repeat itself without considering the underlying drivers of returns isn’t likely to be a successful strategy in the coming year.
Though market conditions vary from year to year, the investment team at Warren Street Wealth Advisors believes international stocks in particular have been hit by political and economic ‘headline risk’ more than actual financial distress. Many European companies such as BNP Paribas (one of the largest banks in Europe), Daimler (maker of Mercedes Benz), and Lloyds Banking Group (a leading U.K. financial service firm) are poised for a strong rebound in 2019. In emerging countries, stalwart firms such as Samsung and Taiwan Semiconductor remain solid global players, with disruptors such as Alibaba and Tencent making their presence felt beyond their home base in AsiaPacific.
Another important thing to remember is that the stock market is not the real economy. Fundamental strength in corporate balance sheets should keep the global economy, and the markets, positive in 2019.
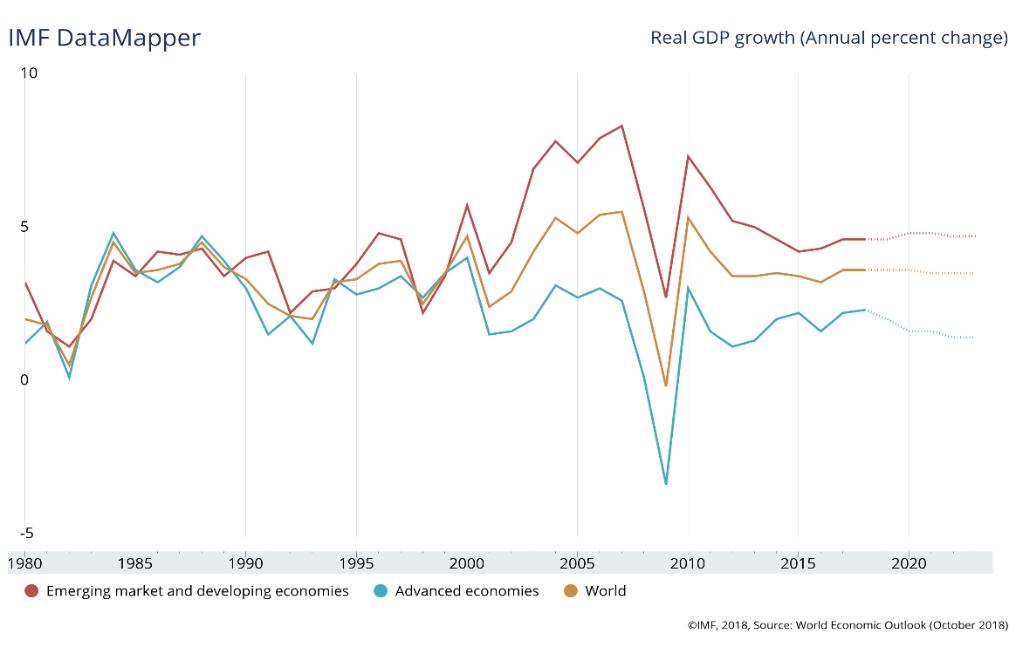
GDP reflects the value of goods and services produced in a country – ultimately, GDP reflects corporate earnings. Robust U.S. GDP growth early in 2017 led to tight labor markets and rising inflation, supporting the Federal Reserve’s plan to ‘normalize’ short-term interest rates(3). Though GDP growth is expected to slow in 2019, the Federal Reserve forecasts a positive growth rate of approximately 2%. Not stellar, but certainly not in recession territory. And not so strong as to require the Fed to increase their pace of raising short-term interest rates, since modest GDP growth is unlikely to spark inflation. The International Monetary Fund is projecting similar modest positive growth for developed nations, and near 5% growth for emerging economies.
![]()
Growth Projection for U.S. GDP

Source: Factset
Growth Projection for the World

Source: International Monetary Fund
Economic fundamentals should ultimately find their way into stock prices, but the markets often become overly optimistic or pessimistic along the way.
As we mentioned in our November commentary, S&P 500 corporate profits were very strong in the 4th quarter of 2018. And for the calendar year, growth in corporate profits was 20.3% due in part to the reduced corporate tax rate(4). This is the highest growth rate we’ve seen since 2010 when profits jumped nearly 40% coming out of the Great Recession of 2008-2009. All 11 sectors of the S&P 500 reported positive growth for the year, with 9 of the 11 sectors reporting double-digit growth.
![]()

You might be surprised to see that Energy companies reported the highest calendar year earnings growth of all the 11 sectors. Despite the 4th quarter fall in oil prices, oil has actually increased when compared against the prior year-end. Materials and Financials also posted strong earnings growth in 2018, a fact not reflected in their December closing stock prices.

As shown in the chart above from Fidelity Research(5), the biggest losers in the S&P 500 were not Technology companies which were grabbing most of the news headlines, but rather Industrials, Financials, Materials, and Energy firms. Industrials and materials were hard hit by concerns over trade tariffs and a slowing, though still strong, pace of new home building(6). Energy equipment and services firms suffered from falling oil prices hurting profit margins. Financial firms also struggled as increasing short-term funding rates squeezed investors’ profit expectations.
Conclusion: Though we can’t predict the future, periods of extreme market movements are often followed by reversion toward the mean. The underlying economic data remains solid and sooner or later investors will incorporate this reality into global stock and bond prices. In the meantime, the investment team at Warren Street Wealth Advisors is watching the data, rebalancing into weakness, and looking forward to a smoother ride in 2019.

 Marcia Clark, CFA, MBA
Senior Research Analyst
Warren Street Wealth Advisors
Warren Street Wealth Advisors, a Registered Investment Advisor. The information contained herein does not involve the rendering of personalized investment advice but is limited to the dissemination of general information. A professional advisor should be consulted before implementing any of the strategies or options presented. Any investments discussed carry unique risks and should be carefully considered and reviewed by you and your financial professional. Past performance may not be indicative of future results. All investment strategies have the potential for profit or loss.
Sources
- All returns retrieved from Morningstar Direct
- EAFE = Europe, Australasia, Far East
- https://insight.factset.com/2017-look-back-2018-predictions-0
- https://insight.factset.com/sp-500-2018-earnings-preview-highest-earnings-growth-in-eight-years
- https://eresearch.fidelity.com/eresearch/markets_sectors/sectors/sectors_in_market.jhtml
- https://tradingeconomics.com/united-states/housing-starts