Portfolio Changes Q2 2017
Global Equity
Decreased stocks across all risk tolerance levels
Global Bonds
Increased bonds across risk tolerance levels
Increased Emerging Market Bonds
Increased Treasury Inflation Protected Securities
Decreased Short Term Corporate Bonds
Decreased Short Term High Yield Bonds
Global Diversifiers
Increased Diversifiers across certain risk tolerance levels
Increased Gold Bullion
Increased Global Real Estate
Decreased Gold Miners
Q2 2017 Synopsis
A friend recently asked me if we should be concerned about how high recent stock market returns have been and my brain immediately defaulted to readying forward thinking conclusions from his sound bite observation.
Had it not been for a sufficient pause to gather my thoughts, I wouldn’t have come up with a snarky response of “you should be more grateful.” We’ve had a phenomenal run these past 8 years or so off recessionary lows, and all along the way, I rarely hear folks stop to pause and give thanks for what the market has yielded to risk takers.
Truthfully, in the near term, recent market price action isn’t incredibly telling of what today or tomorrow hold. Unfortunately, positive returns in perpetuity isn’t a thing in investing, and pricey markets that begin to fatigue don’t bode well for long term investors. This is the key, neither you nor I, nor the smartest men and women in the world know what will happen in the next 3 to 6 months, despite how our minds convince us of such.
At the end of June, Large Cap US Stocks were up 8.99% year to date, Foreign Stocks up 14.28%, Emerging Markets up 18.08%. The numbers have only improved since then and kudos to our patient clients who are starting to reap rewards for holding their nose while we bought foreign assets the last few years. We think these trades have a lot of legs led by continued accommodative central banking efforts and price multiple expansions as investor flows start to confirm what we already saw outside our borders.
This year hasn’t been all roses, we’ve been buying a falling knife in the energy sector, and it has robbed us thus far of what should be outsized outperformance. At the end of June, the Energy Sector was down 14.92%, which has accelerated to approximately 20% at the end of July. We are convinced the fundamentals are as solid as we’ve seen in nearly two decades, and the price action is hopefully due to reverse action soon. Patience!
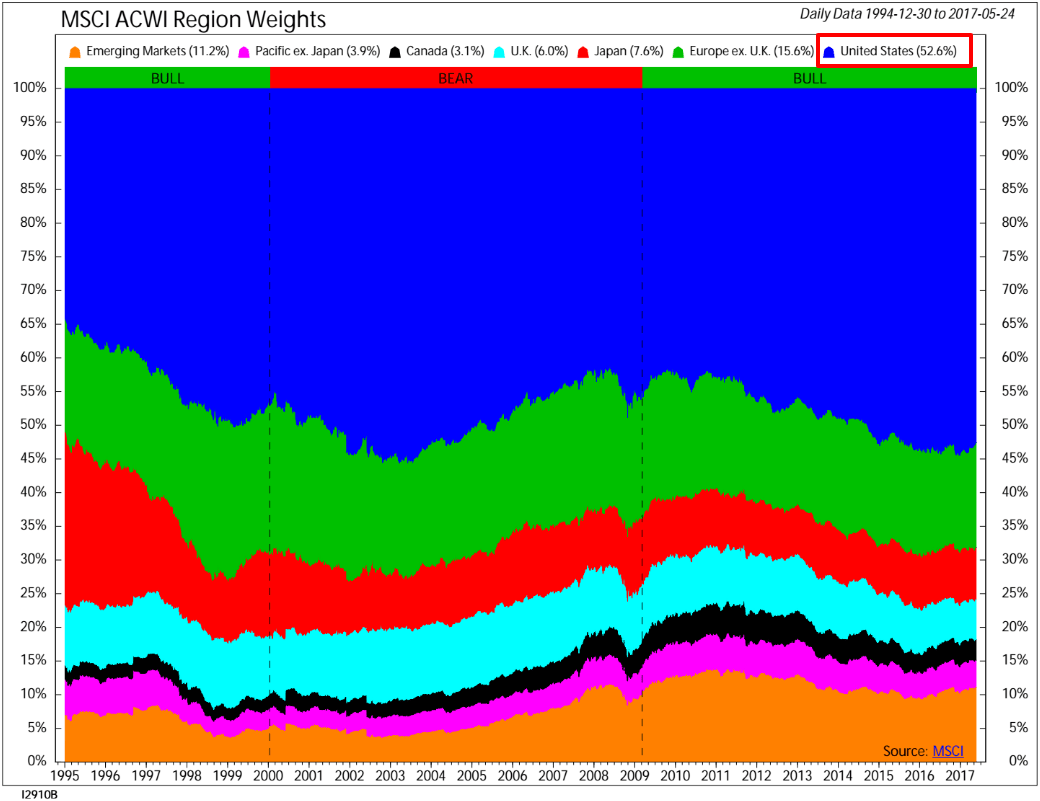
Recent returns play tricks on our brain. If all you saw was year to date performance, you might be apt to think Emerging Market Stocks are expensive relative to historical standards, and that US stocks are the place to be. Contrary to this, US stocks are fully valued or expensive by almost all fundamental valuation metrics. Emerging Markets equities can’t say the same. One interesting nugget I came across, US Stocks are up approximately 120% from pre-recession highs, Emerging Markets are down 30% from their pre-recession highs still, and 20% from post-recession highs.
Much of the above speaks through our client positioning, we are underweight US equities, overweight international and emerging markets, and we raised our defensive positions, namely bonds, across almost all client portfolios. I can’t call a top in US equities, but I hope to have some skin in the game all the way to the top, but not get caught holding the bag when the good times stop rolling.
If I could go back and answer my friend again, I’d say, I’m grateful for the strong returns we’ve had in the past 18 months or so, but I’m focused on owning assets for our clients that might not have produced the same results you’re referring to in recent years. We don’t have a crystal ball, so we’ll own a lot of different assets, and overweight our best ideas. He’ll probably respond “boring”, but hey, most viable processes are just that.
We’d like to thank our clients for allowing us to put this process forward, we are constantly finding new ways to deliver value and improve upon what we do. Without your partnership, none of this is possible.
Respectfully yours,
Blake Street, CFA, CFP®
Co-founder, Chief Investment Officer
Key Indicators for the Quarter
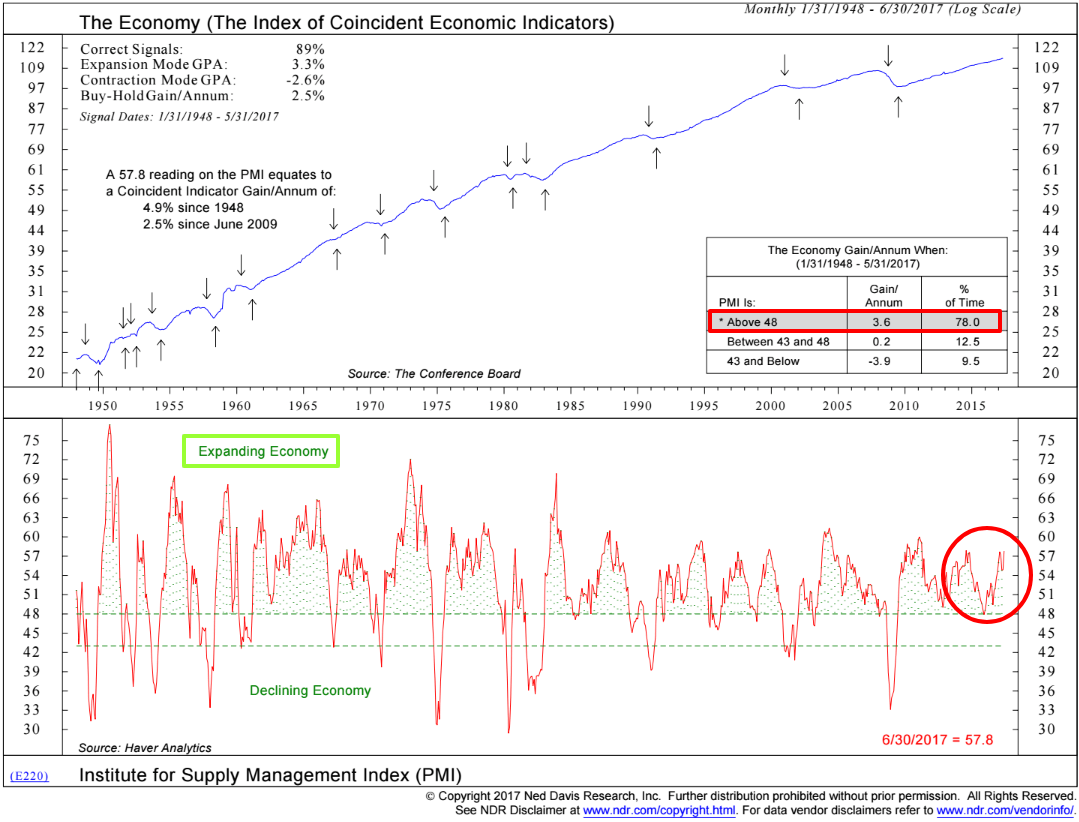
ISM Purchasing Managers Index:
For more info on what ISM PMI is, click here:
It has long been understood that as the economy goes, so do earnings. One of the most reliable indicators of economic health in the United States is ISM PMI. You’ll notice from the red arrow above, a reading north of 48, historically points to an average annual GDP growth rate of 3.6% going back to 1948. If you look at the second half of the chart, you’ll notice two green lines separated the PMI reading into three tranches. In late 2015, we were in danger of a rapid descent from an expanding economy, to a stagnant reading, and what we feared might have been a recessionary reading.
Takeaway:
ISM PMI has firmed and the June 30 reading of 57.8 makes us more comfortable with a fully invested stance.
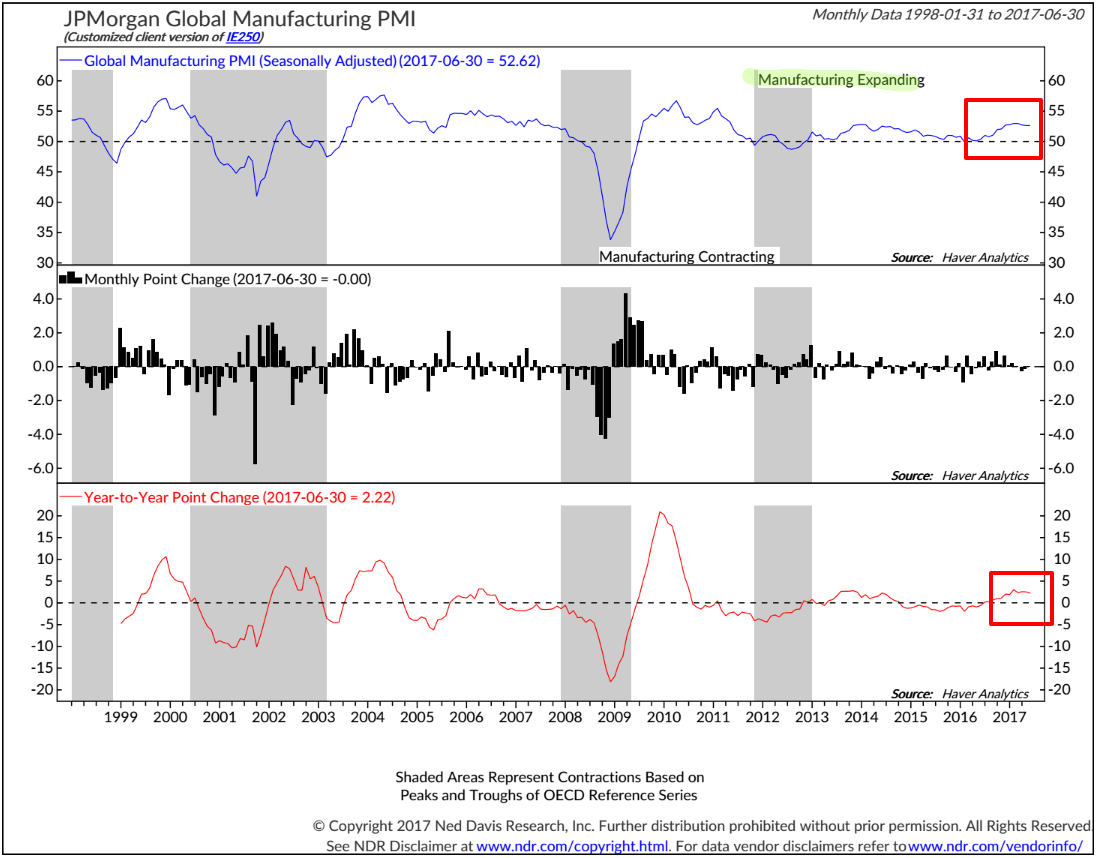
Global Purchasing Managers’ Index
For more info on what Global PMII is, click here:

One thing missing from the global recovery post-2008 is broad based sustained growth across emerging and developed economies. Growth stalled out in early 2014, and we teetered on global recession for a year and a half despite a resilient U.S. market and economic recovery. This pattern has been changing.
Takeaway:
JPMorgan Global Manufacturing PMI is currently in expansionary territory with a reading above 50 with a positive trend. This reinforces our fully invested and globally diversified stance.
Big Mo Composite
For more on Big Mo and what it is, click here:
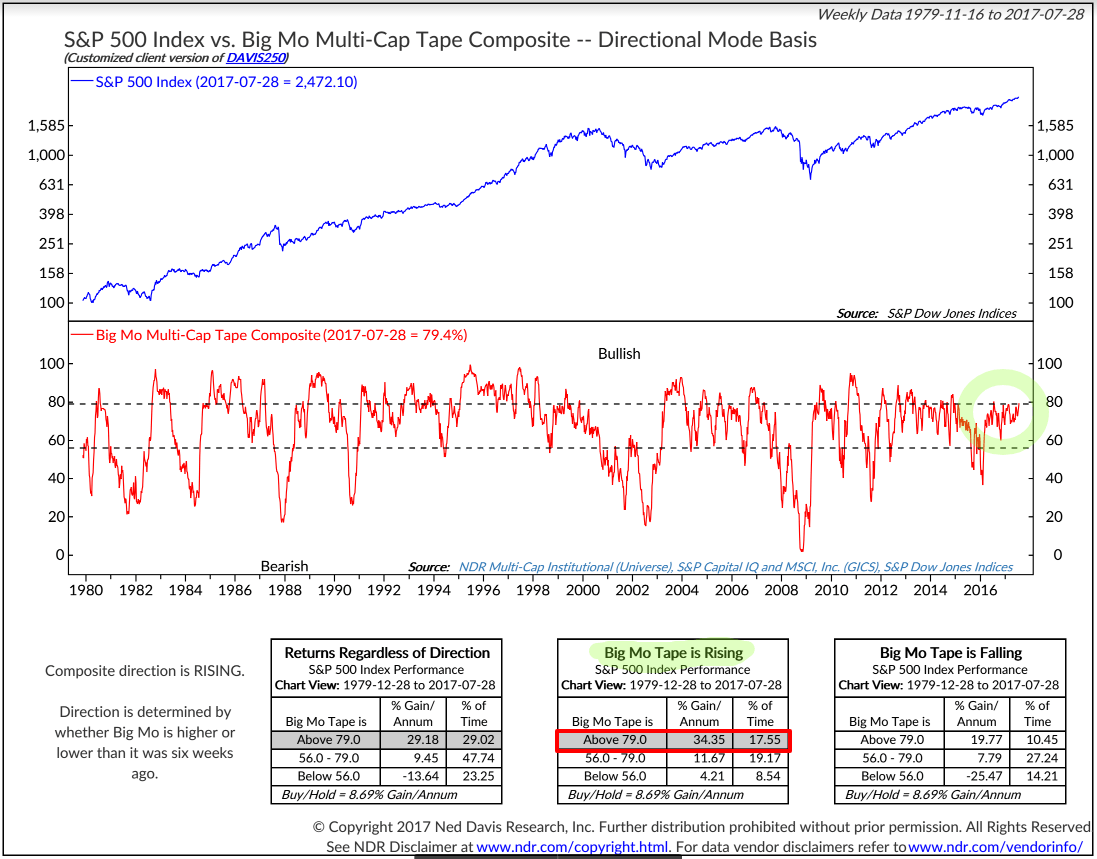
Individual technical indicators can be noisy. Why not put a bunch of them together to try get a more stable reading on the US market? Welcome to Big Mo. Big Mo composites 100 technical indicators into one temperature gauge in the US market and then back tests the readings. You’ll notice the reading is currently at 79.4%. The three boxes point to how the S&P performs in the current range going back to 1979 in different directional patterns. You’ll notice in the red circle, the current reading is rising.
Takeaway:
The S&P500 trend and momentum is positive. It did slip into negative territory for the first time 4 years to end 2015. One more reason we got defensive. Big Mo recently crossed the 79 threshold which typically results in very bullish price action. We moderate this enthusiasm due to extended valuations and the duration of the current bull market cycle.
Cyclically Adjusted Price to Earnings Ratios:
Current market and historical market price levels versus 10 year earnings cycles adjusted for inflation. Currently, large cap and small U.S. stocks are overvalued according to CAPE. Large cap is trading at a CAPE of 28 versus its average of 16 as seen in red. Contrast that with developed international and emerging markets that trade below their historical CAPE norms.
Takeaway:
The price at which you enter a position has much to do with the ultimate outcome of your investment. Since most of our clients are long term focused, we enjoy CAPE for its reliability in forecasting long term returns. According to CAPE, US Stocks are projected to produce low single digit nominal returns, vs. high single digit returns for international and emerging markets stocks over the next 10 to 15 years. CAPE is not a reliable short term metric, so patience is required. These CAPE readings is one reason we are 30% underweight U.S. equity exposure.
Warren Street Wealth Advisors is a Registered Investment Advisor. The information posted here represents opinions and is not meant as personal or actionable advice to any individual, corporation, or other entity. Any investments discussed carry unique risks and should be carefully considered and reviewed by you and your financial professional. Nothing in this commentary is a solicitation to buy, or sell, any securities, or an attempt to furnish personal investment advice. We may hold securities referenced in the above article and due to the static nature of content, those securities held may change over time and trades may be contrary to outdated posts.


