Portfolio Changes Q1 2017
Global Equity
Increase Emerging Markets
Decrease US Mid Cap
Decrease US Small Cap
Global Bonds
Increase US Short Term Treasuries
Increase Treasury Inflation Protected Securities
Decrease High Yield Bonds
Decrease Short Term High Yield Bonds
Increase US Core Bonds
Increase Investment Grade Corporate Bonds
Decrease International Bonds
Global Diversifiers
Increase Gold Bullion
Decrease TIPS
Q1 2017 Synopsis
Thank you for lending me your attention for a moment. We hope our Quarterly Investment Update provides a window into our sentiment for and approach to the global investment landscape as it stands today.
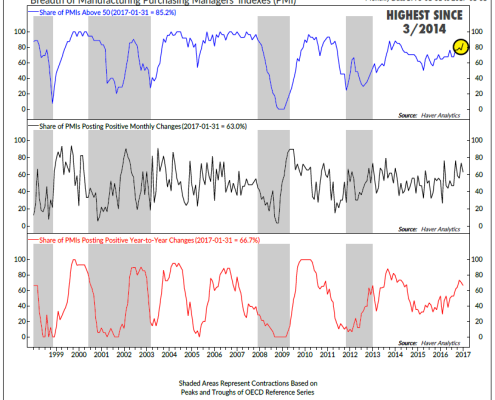
The global economy began the year on a strong note with global manufacturing PMI holding at 52.7 in January, the highest since 2014. Even more impressive is the 85% of OECD countries with PMI readings above the critical threshold of 50, speaking to a wider breadth of countries participating in growth, something we haven’t seen much of since the early stages of recovery since the subprime recession. As always, there are risks to mindful of as well. Some worth mentioning include contested elections across Europe, a potential rise of protectionism in the U.S., and a potential debt crisis in China. On par, we believe the outlook is favorable for global markets in the coming months.
We’re off to a strong start this year, a marked difference from the global markets to start 2016, but a consistent theme to how we finished the last two thirds of 2016. Some of our favorite positions internally that have required a lot of patience over the years are rallying and providing market leadership. This includes emerging markets up 9% YTD, gold up 5.6% YTD, and even developed international stocks up 5% YTD. Some of the above have required significant patience over the years, kudos to you for sticking with us.
The bond side of our portfolios continue to require more attention than ever, mostly because we believe we’re teetering on the edge of of a transition from a secular bull market in bonds that has lasted over 35 years, to an eventual secular bear. There are certain bond sectors that appear less appetizing than others, and it’s our job to over allocate to those with less structural headwinds. Some of our favorites from 2016, specifically High Yield bonds have found their way out of client portfolios, as valuations appear stretched. We continue to favor shorter term paper, which typically carries less interest rate risk.
In addition, we think it pays to be different in bonds so we’ve steadily built our treasury inflation protected securities (TIPS) position. TIPS are a unique issue of Treasuries that have inflation protection built into their price, if rates rise because the economy is growing and we’re experiencing healthy inflation, TIPS should outperform their conventional treasury counterparts. Look for us to continue building this position as the market rewards us.
Post inauguration, we’ve seen significant moves in US equities, stretching valuations for an already stretched asset class. We still believe we’re in the midst of a secular bull market in equities, but we think it’s a global bull, and prefer cheaper valuations abroad. Momentum appears to be building with us, and we aren’t getting rid of our recent winners anytime soon, unless of course data tells us otherwise.
U.S. markets continue to eye President Trump’s impending tax proposals, which are expected to add to net earnings across U.S. businesses, with some trade-offs for potential losses in the ability to deduct interest. Questions remain whether these increased profits will be sustainable. Some fear that tax cuts and massive infrastructure spending will pull growth prematurely forward and lead to lower growth rates down the road coupled with increased debt loads.
Looking forward, we continue to favor assets that will benefit from global reflation themes, with a heavy emphasis on assets that are cheap compared to historic norms. Specifically, we favor international and emerging market equities relative to their U.S. counterparts. We believe we’re in the early innings of being rewarded for not being biased to home country holdings and owning what’s done well in hindsight.
As always, we remain vigilant as stewards of your wealth and deeply value the relationships and trust each of our client’s bestow upon us. If there is anything our office can do to allay fears, educate, or move you closer to your goals, don’t hesitate to reach out. Our team is ready and waiting.
Respectfully yours,
Blake Street, CFA, CFP®
Co-founder, Chief Investment Officer
Key Indicators for the Quarter
ISM Purchasing Managers Index:
For more info on what ISM PMI is, click here:
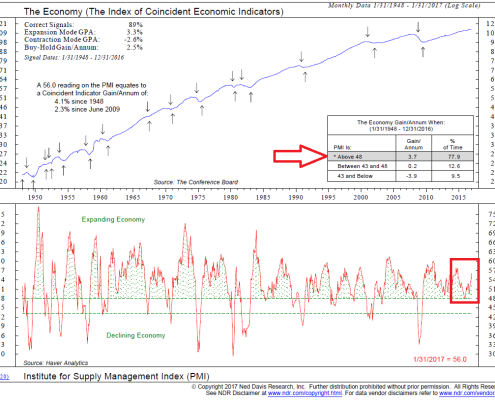
It has long been understood that as the economy goes, so do earnings. One of the most reliable indicators of economic health in the United States is ISM PMI. You’ll notice from the red arrow above, a reading north of 48, historically points to an average annual GDP growth rate of 3.7% going back to 1948. If you look at the second half of the chart, you’ll notice two green lines separated the PMI reading into three tranches. In late 2015, we were in danger of a rapid descent from an expanding economy, to a stagnant reading, and what we feared might have been a recessionary reading.
Takeaway:
ISM PMI has firmed and the January reading of 56 makes us more comfortable with a fully invested stance.
Global Purchasing Managers’ Index
For more info on what Global PMII is, click here:
One thing missing from the global recovery post-2008 is broad based sustained growth across emerging and developed economies. Growth stalled out in early 2014, and we teetered on global recession for a year and a half despite a resilient U.S. market and economic recovery.
Takeaway:
85% of OECD economies are above the critical 50 PMI threshold, data is trending upward as well. This reinforces are fully invested and globally diversified stance.
Big Mo Composite
For more on Big Mo and what it is, click here:
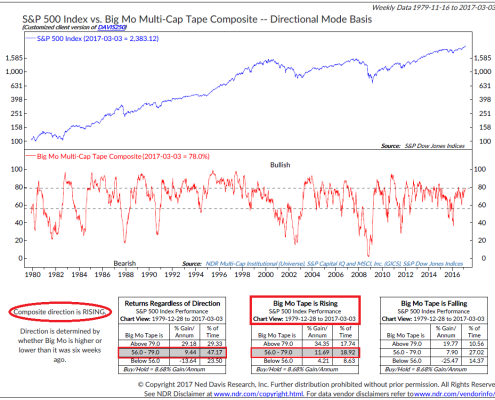
Individual technical indicators can be noisy. Why not put a bunch of them together to try get a more stable reading on the US market? Welcome to Big Mo. Big Mo composites 100 technical indicators into one temperature gauge in the US market and then back tests the readings. You’ll notice the reading is currently at 78%. The three bxes point to how the S&P performs in the current range going back to 1979 in different directional patterns. You’ll notice in the red circle, the current reading is rising.
Takeaway:
While this reading doesn’t make us extremely convicted one way or another, it did slip into negative territory for the first time 4 years to end 2015. One more reason we got defensive. The reading appears to be trending in a more optimistic direction.
High Yield Bonds
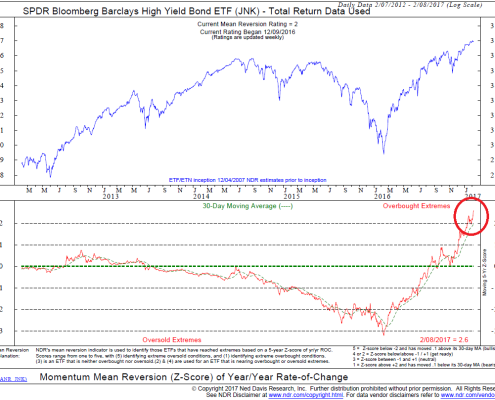
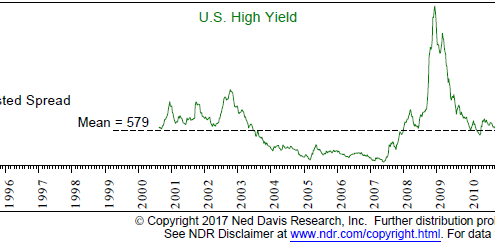
One of the common ways to evaluate bonds is via credit spreads. In simple terms this is how much you are compensated for taking additional risk beyond a “risk free” asset. You’ll notice in the red circle on the bottom of this graph, high yield bonds currently yield 3.73% above their treasury counterparts. Compared to the average of 5.79% back to 1990. High yield ran far and fast in 2016. It currently flashes a Z-Score of -2.6 as seen in the top red circle, measured by a 5-year rate of change. It’s over two standard deviations above its average, more simply, very overbought.
Takeaway:
With any asset, when things deviate too far from the average, we eye a reversion to the mean. This is as much to do with valuations as it is does with psychology. We also like to own risk assets when the compensation for doing so is perceived to be above average. For these reasons, we don’t like high yield bonds and have removed direct exposure from the portfolio.
Cyclically Adjusted Price to Earnings Ratios:
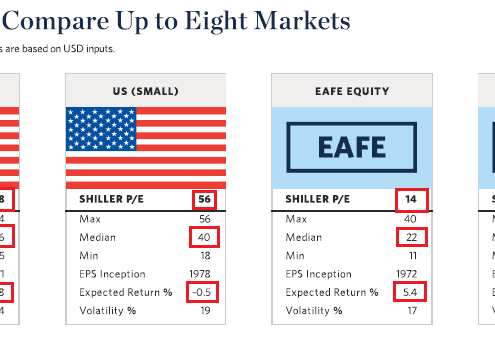
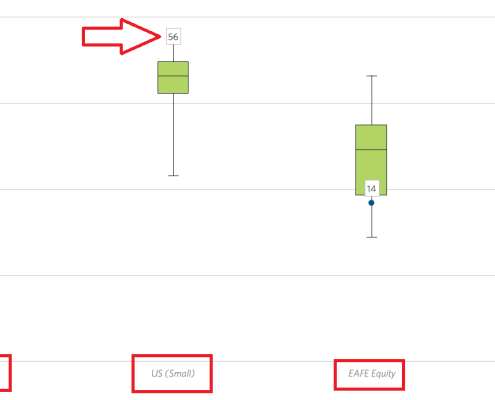
Current market and historical market price levels versus 10 year earnings cycles adjusted for inflation. Currently, large cap and small U.S. stocks are overvalued according to CAPE. Large cap is trading at a CAPE of 28 versus its average of 16 as seen in red. Contrast that with developed international and emerging markets that trade below their historical CAPE norms.
Takeaway:
The price at which you enter a position has much to do with the ultimate outcome of your investment. Since most of our clients are long term focused, we enjoy CAPE for its reliability in forecasting long term returns. According to CAPE, US Stocks are projected to produce low single digit nominal returns, vs. high single digit returns for international and emerging markets stocks over the next 10 to 15 years. CAPE is not a reliable short term metric, so patience is required. These CAPE readings is one reason we are 30% underweight U.S. equity exposure.
Warren Street Wealth Advisors is a Registered Investment Advisor. The information posted here represents opinions and is not meant as personal or actionable advice to any individual, corporation, or other entity. Any investments discussed carry unique risks and should be carefully considered and reviewed by you and your financial professional. Nothing in this commentary is a solicitation to buy, or sell, any securities, or an attempt to furnish personal investment advice. We may hold securities referenced in the above article and due to the static nature of content, those securities held may change over time and trades may be contrary to outdated posts.
