Portfolio Changes
Trade Date – January 19, 2018
Global Equity
Increase Emerging Markets
Increase Developed International Stocks
Decrease US Large Cap
Decrease US Mid Cap
Decrease US Small Cap
Global Bonds
Increase US Short Term Corporate Bonds
Increase Developed International Bonds
Increase Treasury Inflation Protected Securities
Removed Emerging Market Bonds
Global Diversifiers
Increase Treasury Inflation Protected Securities
Removed Real Estate
Moving into 2018…
The year 2017 proved to be another incredibly favorable year for investors, especially those who were able to stomach an avalanche of noise from pundits and peers while sticking to their long term investment plan. We were pleased with our results from conservative to aggressive clients alike, given a lot of the feedback we’ve received, our clients were too. We appreciate that kind of thing, believe it or not, we don’t get too many adda boys/girls but we certainly get flack when the things go wrong. I don’t mean that as a plea for compliments, especially given the fact so much happens in the investing world outside our control. We’re implementing a process on your behalf that we implement for ourselves, never perfect, but always striving.
Last year our clients were well rewarded for holding large amounts of international equities (up on average 25.10%)¹ and emerging market equities (up on average 37.28%)² and punished for holding anything energy sector related, especially one long time manager we use Ivy Energy (down 12.98%)³. We fared really well on our bond side of the portfolio as well, all of our discretionary clients bond holdings bested the bond market average (up 3.71%)⁴. US Stocks also provided another shot in the arm producing double digit returns (up on average 20.97%)⁵. Gold holders fared well (12.81%⁶ on average), while Real Estate lagged (up 4.91%)⁷.
Looking forward, we approach securities markets with considerable caution. Not that we anticipate the bottom falling out, but rather the more extended a bull market gets, and the more extended valuations become, the more apprehensive we are. Usually our DNA forces us to behave the other way, we fall prey to FOMO (fear of missing out) and begin to feel like these returns are the new normal and come to expect them regardless of current conditions. Charles Schwab posted a write-up last week about how retail investors are finally beginning to funnel back into the stock market, talk about fashionably late!
An important thing to keep in mind is that markets are driven by so many factors, some even unseeable, that no man or machine can possibly predict what the near future holds. We can only make decisions based on the data that informs us, while hopefully taming our DNA and biases. It’s therein we have to balance being fearful and greedy. It’s impossible to be completely polarized one way or the other and be right, consistently anyway.
I often hear folks remark, markets are at a high, we should get out. I’ve heard this ad-nauseum since 2013, and the market has virtually doubled since then. If you compared valuations (in this case CAPE ratios) of the S&P500 currently with the tech bubble of the late 90’s, the market appreciated roughly another 100% from current levels to its peak. What am I trying to convey here? Markets being rich doesn’t necessarily mean doom is here, it actually can mean a lot of good things are happening. It’s important to be mindful of systemic problems that can undermine this health, eg: IPOs based on nothing, sub-prime lending and securitization, etc.
The S&P500 produced 71 record highs last year, imagine how many groundhog days that produced for folks that were convinced an all time high is death knell? Historically, there have been 16 years that have produced north of 35 record highs, you might also be surprised to find out the year to follow such historic feats produced an average of 7.5% returns. Pretty good if you ask me.
You’ll be hard pressed to find many folks that truly have been able to invest through bull cycles, hold until the top, exit at the perfect time, and have the data to back it up. I live and breathe this stuff and I never see it, but I do hear from the best and the brightest sharing their experiences and learning from their bumps and bruises. It’s from that I shape our process.
We will continue to stay invested as long economic data remains strong, and economies continue to grow. If we spot something systemic that could set the markets back a significant degree, we will act. If markets take a breath, we’ll likely hold, or buy into the weakness. In the meantime, we’ll continue reducing our exposure to the most extended markets, and continue to add to those we think will be in your best interests over the next 5, 10, and 15 years. After all, we plan on keeping you all longer than that!
As always, our team truly values the trust and partnership each and every client bestows upon us. It is a privilege to navigate both good times and bad on your behalf, although one may be easier than the other. If for any reason you want to dive deeper into how we’re allocating your nest eggs, why we’re doing it that way, and what we see ahead, don’t hesitate to reach out!
Respectfully yours,
Blake Street, CFA, CFP®
¹ https://www.etfreplay.com/etf/efa.aspx
² https://www.etfreplay.com/etf/eem.aspx
³ http://performance.morningstar.com/fund/performance-return.action?t=IEYYX
⁴ https://www.etfreplay.com/etf/agg.aspx
⁵ https://www.etfreplay.com/etf/gld.aspx
⁶ https://www.etfreplay.com/etf/gld.aspx
⁷ https://www.etfreplay.com/etf/vnq.aspx
Key Indicators for the Quarter
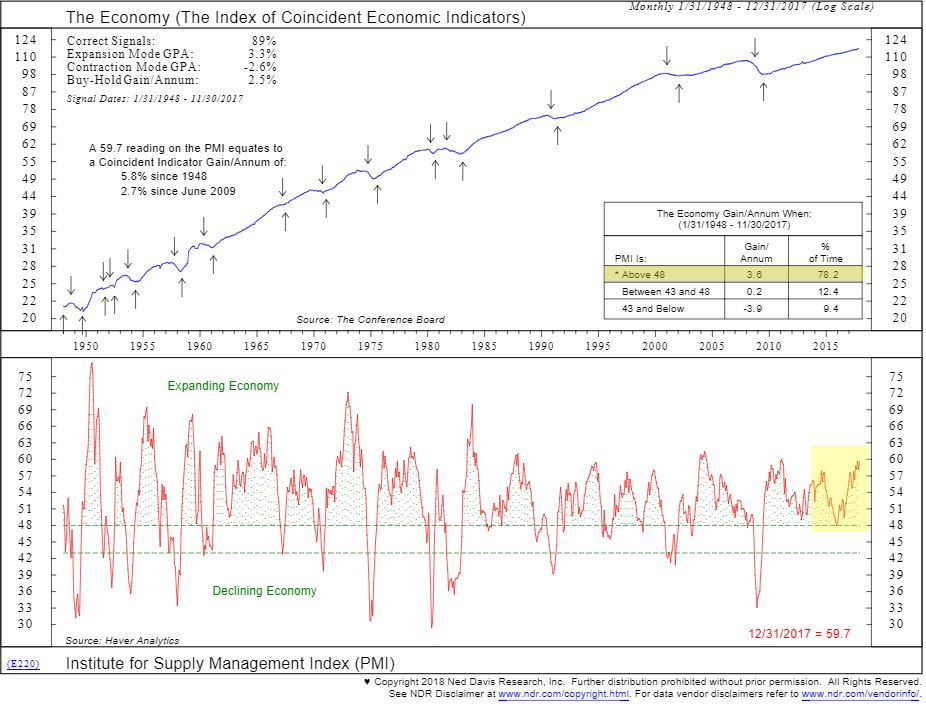
ISM Purchasing Managers Index:
It has long been understood that as the economy goes, so do earnings. One of the most reliable indicators of economic health in the United States is ISM PMI. You’ll notice from the red arrow above, a reading north of 48, historically points to an average annual GDP growth rate of 3.6% going back to 1948. If you look at the second half of the chart, you’ll notice two green lines separated the PMI reading into three tranches. In late 2015, we were in danger of a rapid descent from an expanding economy, to a stagnant reading, and what we feared might have been a recessionary reading.
Takeaway:
ISM PMI is flashing continued strength and the December 31 reading of 59.7 makes us more comfortable with a fully invested stance.
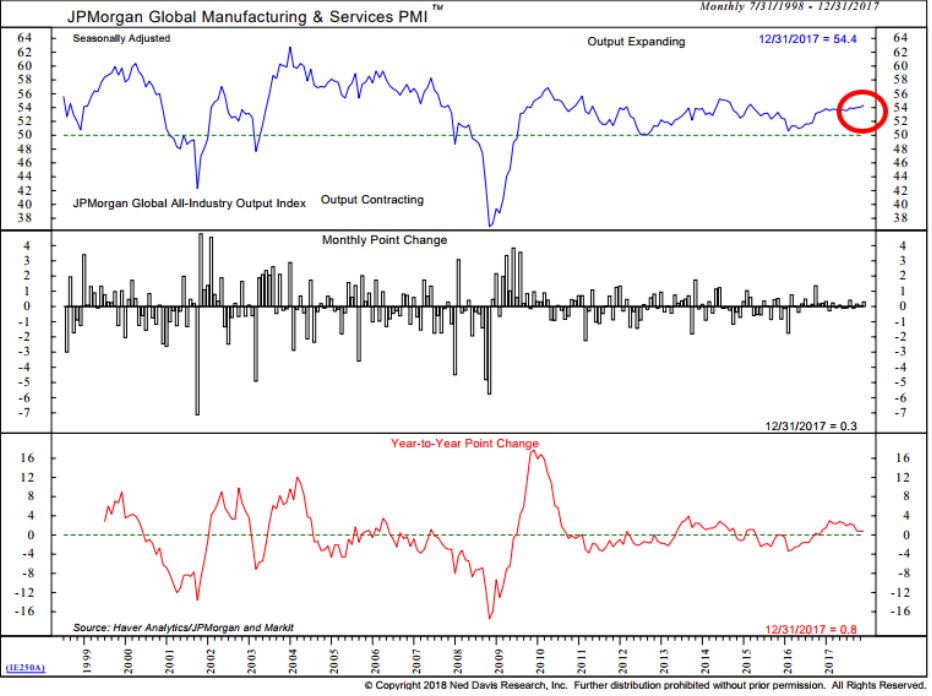
Global Purchasing Managers’ Index
One thing missing from the global recovery post-2008 is broad based sustained growth across emerging and developed economies. Growth stalled out in early 2014, and we teetered on global recession for a year and a half despite a resilient U.S. market and economic recovery. Since early 2016, global output has continued to accelerate with broad based participation.
Takeaway:
JPMorgan Global Manufacturing PMI is currently in expansionary territory with a reading at 54.4, and 90% of OECD countries reporting readings above 50. This reinforces our fully invested and globally diversified stance.
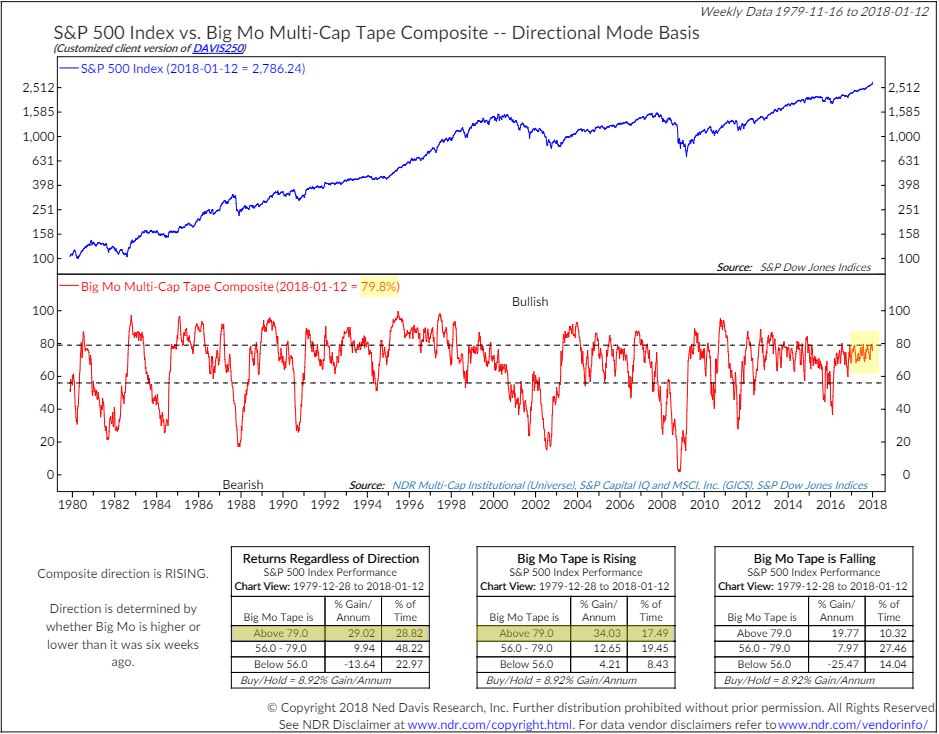
Big Mo Composite
Individual technical indicators can be noisy. Why not put a bunch of them together to try get a more stable reading on the US market? Welcome to Big Mo. Big Mo composites 100 technical indicators into one temperature gauge in the US market and then back tests the readings. You’ll notice the reading is currently at 79.8%. The three boxes point to how the S&P performs in the current range going back to 1979 in different directional patterns. You’ll notice in the highlighted area, the current reading is rising.
Takeaway:
The S&P500 trend and momentum is positive. It did slip into negative territory for the first time 4 years to end 2015. One more reason we got defensive. Big Mo crossed the 79 threshold in the middle of 2017 and very bullish price action ensued, as the mode would expect. We moderate this enthusiasm due to extended valuations and the duration of the current bull market cycle.
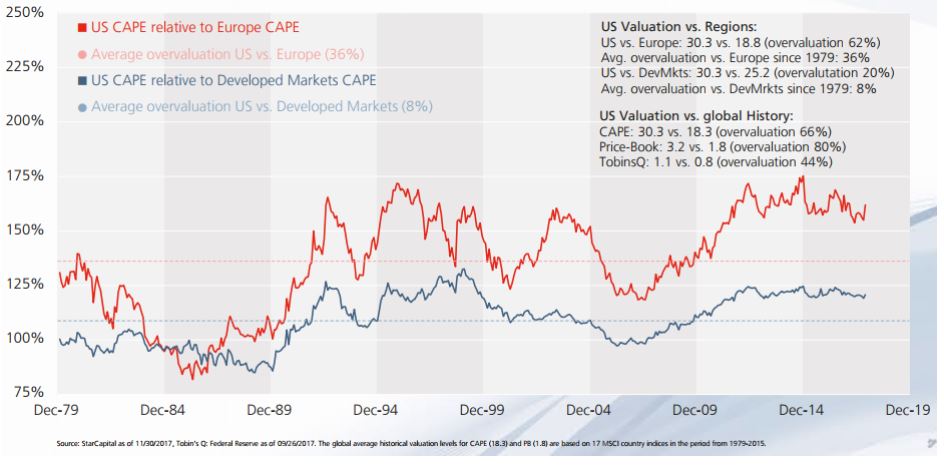
Cyclically Adjusted Price to Earnings Ratios:
US equities are as expensive relative European equities as they ever have been as measured by CAPE ratios. They are hitting similar levels relative to Developed International markets as a whole. There are structural differences between US equities, Developed International, and Emerging Markets which should lead to different valuations and their averages. Comparing the spread over time between those values is instructive in trying to determine where we expect forward return leadership to come from.
Takeaway:
The price at which you enter a position has much to do with the ultimate outcome of your investment. Since most of our clients are long term focused, we enjoy CAPE for its reliability in forecasting long term returns. According to CAPE, US Stocks are projected to produce low single digit nominal returns, vs. high single digit returns for international and emerging markets stocks over the next 10 to 15 years. CAPE is not a reliable short term metric, so patience is required. These CAPE readings is one reason we are roughly 38% underweight U.S. equity exposure.
Warren Street Wealth Advisors is a Registered Investment Advisor. The information posted here represents opinions and is not meant as personal or actionable advice to any individual, corporation, or other entity. Any investments discussed carry unique risks and should be carefully considered and reviewed by you and your financial professional. Past performance may not be indicative of future results. All investment strategies have the potential for profit or loss. Changes in investment strategies, contributions or withdrawals may materially alter the performance, strategy, and results of your portfolio. Historical performance results for investment indexes and/or categories, generally do not reflect the deduction of transaction and/or custodial charges or the deduction of an investment-management fee, the incurrence of which would have the effect of decreasing historical performance results.Economic factors, market conditions, and investment strategies will affect the performance of any portfolio and there are no assurances that it will match or outperform any particular benchmark. Nothing in this commentary is a solicitation to buy, or sell, any securities, or an attempt to furnish personal investment advice. We may hold securities referenced in the blog and due to the static nature of content, those securities held may change over time and trades may be contrary to outdated posts.


