April 2019 Market Commentary
April 2019 Market Commentary
Key Takeaways
-
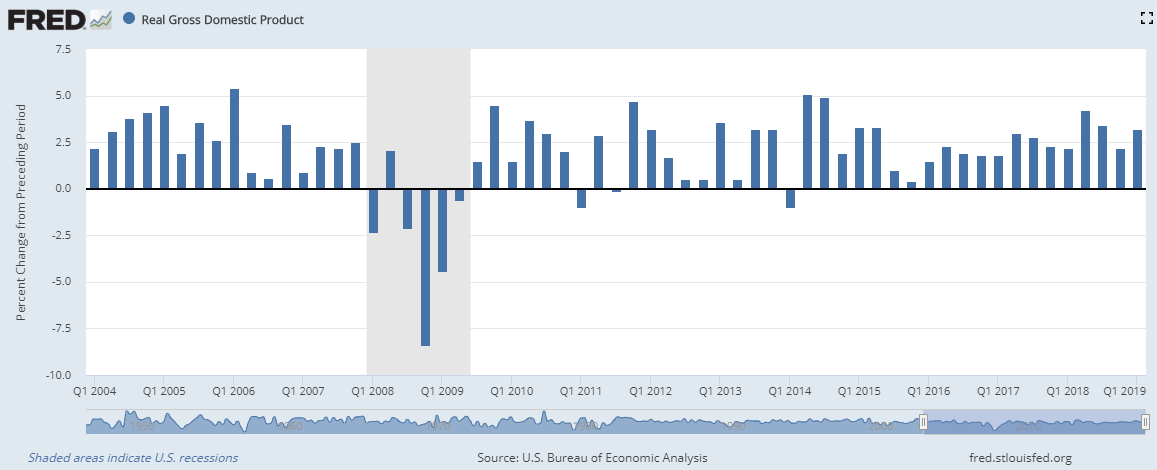
- 1st quarter GDP beat expectations at 3.2%, due in part to increasing net exports and inventories
- The U.S. stock market reached new highs as economic data and corporate earnings were stronger than expected, though stock prices of companies with disappointing results have been punished
- Despite slowing GDP in China and continuing budgetary and political challenges throughout Europe, economic growth overseas remains modestly positive
- The Conference Board’s Leading Economic Indicators Index® increased in February and March, though is expected to weaken slightly going forward; new home sales and job growth beat expectations
- Though central banks are on hold for now, interest rate ‘normalization’ will resume when inflation gains traction, which could happen later this year due to tight labor markets and rising commodity prices
- Conclusion: Enjoy the party! Global stock markets have had a good run so far, and recent earnings announcements and economic data suggest a positive environment for the rest of the year.
The death of the U.S. economy has been greatly exaggerated.

1st quarter GDP beat expectations at 3.2%, due in part to increases in net exports and inventories. This strong growth came despite the consensus view earlier in the year that the U.S. economy was nearing a recession. In fact, the U.S. economy is still benefiting from several sources of stimulus such as low interest rates, 2017 corporate tax cuts, and deregulation. While it’s unlikely we’ll see such strong GDP numbers going forward, there’s no sign yet that these supportive factors have fully played themselves out.
Time to celebrate! The U.S. economy is not dead!
The strong GDP growth was also reflected in the U.S. stock market. As of April 26, 77% of S&P 500 companies reporting actual earnings during the 1st quarter of 2019 were higher than expected. The chart below compares projected quarterly corporate earnings (gray bar) to actual earnings (blue bar) over the past few years. Actual earnings surpassed estimated earnings in the 4th quarter of 2018 and are looking to do the same in the 1st quarter of 2019. Add to this the size of the positive surprise so far in 2019 being larger than the historical average, and you have the U.S. stock market hitting new highs in April.
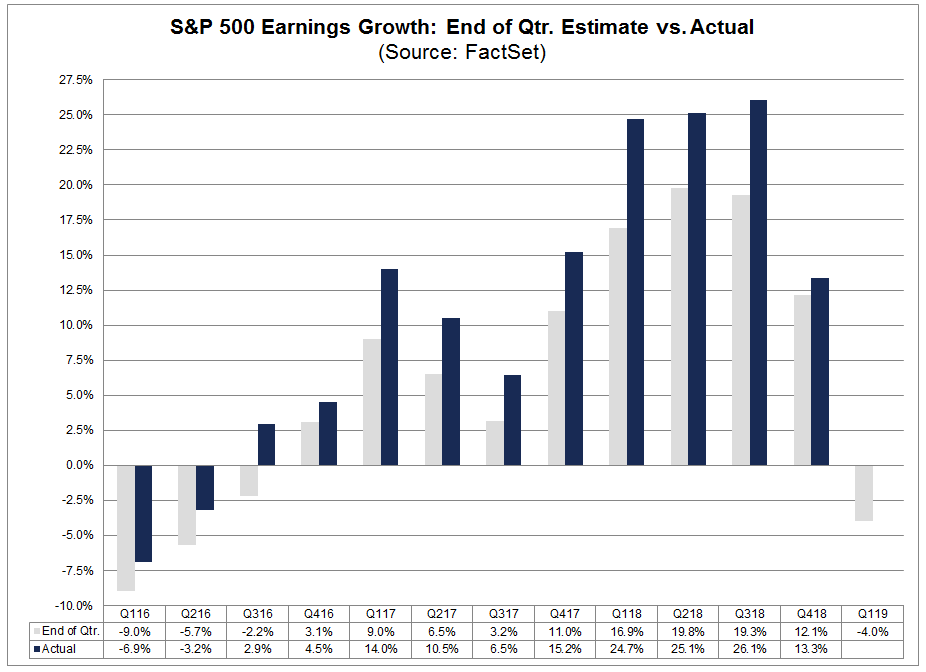
But it isn’t all roses and sunshine. The U.S. stock market has rewarded upward earnings surprises for sure, but has been unusually harsh with companies reporting disappointing earnings. According to the Wall Street Journal, the stock price of companies reporting actual earnings below estimates has fallen an average of 3.5% in the two days before and after their earnings announcement, compared to a historical average decline of only 2.5%. Investors don’t seem convinced that corporate profits are going to continue to grow.
One indicator of this lack of trust in the strength of the economy is very low bond yields. Despite decent earnings growth and high stock prices, the yield on the 10-year Treasury bond remains very low at about 2.5%, barely above inflation. The fact that investors are willing to buy bonds at this very low yield indicates skepticism about where the global economy is headed and how quickly we’re likely to get there.
Countries outside the U.S. are also facing economic uncertainty. Europe continues to struggle with trade tariffs and political unrest, and tensions between the U.S. and China remain unsettled. The U.K. hasn’t yet figured out how to exit the European Union gracefully, Italy missed its budget deficit target (again), and business sentiment in Germany is falling.
One bright spot is stronger-than-expected first quarter growth in China. But international investors are now worried that Chinese authorities will slow the pace of policy easing and the economy will fall back. While Europe and the U.K. seem to be navigating their challenges well enough, heaven help us if the expected resolution of the U.S.-China trade talks gets derailed! Given the uncertain state of global economies, skittish investors may run for the sidelines at the slightest negative news about escalating trade tensions.
But don’t let me be a ‘Debbie Downer’! Global stock markets are doing great so far this year.
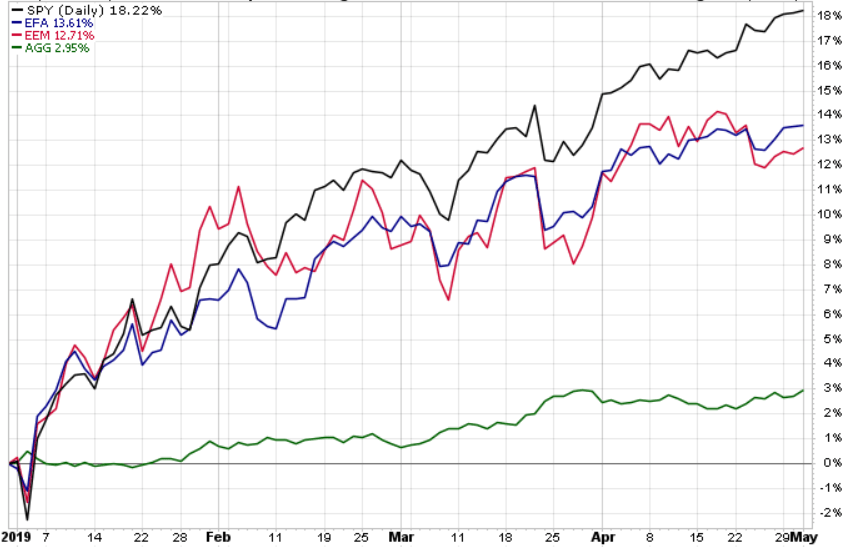
If the year ends with no more gains than we already have, the S&P 500 return for the first four months of 2019 will be in the top third of historic returns for an entire year. As you can see in the graph below, developed and emerging global markets are also having a good run in 2019 (blue and red lines). Even bond market returns are positive, as shown by the green line at the bottom of the graph.
https://stockcharts.com/h-perf/ui
There is one cautionary note on the U.S. stock market, however: higher-than-average stock valuations. According to Factset, the forward 12-month Price/Earnings ratio for S&P 500 companies has risen to 16.8. This is higher than both the 15-year and 10-year average, and a signal that the market may not have much more room to run.
So far, so good…but for how long?
In mid-April the Conference Board announced its Leading Economic Indicators Index® (LEI) for the 1st quarter of 2019. The LEI posted a gain of 0.4% in March after increasing 0.1% in February, primarily due to strength in the labor markets, improved consumer outlook, and better-than-expected financial conditions. Eight out of the 10 LEI factors were positive in March, with 2 factors holding steady (average weekly manufacturing hours and building permits.) New home sales also rose unexpectedly in March, the third gain in a row. The three-month average sales rate is close to its best since December 2007.
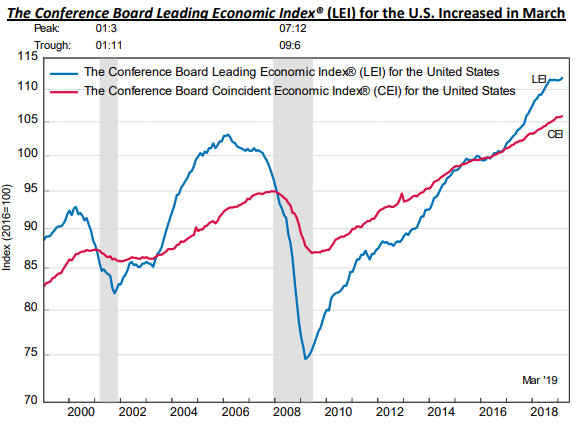
Despite the recent strength in economic data, the trend in the LEI is leveling out, suggesting the U.S. economy will slow toward its long-term potential growth rate of about 2% by year end. This trend is reflected in the reduced pace of home price appreciation in March and a slight drop in labor participation.
The Fed echoed this ‘slow growth’ story in the statement released after the May 1st FOMC meeting. The committee highlighted a slowdown in household spending and business investment, as well as inflation below its 2% target, but indicated this weakness was probably “transient” and short term rates were appropriate at the current level.
All in all, the data continue to support the conclusion we’ve been talking about since late 2018 – the U.S. economy is slowing, but a recession is not imminent. In fact, the surprise that might spook investors later this year isn’t recession, but inflation.
With stronger than expected economic data so far in 2019, is inflation around the corner?
The tight labor market and increasing commodity prices might catch up with us later this year. As shown on the graph below, the cost of personal consumption has fallen recently but ticked up again in March (blue line). The Employee Compensation Index increased 0.7% for the quarter, though the 12-month growth rate slowed a bit (red line.) And the job report released in early May reported non-farm payrolls up 263,000, while the unemployment rate fell to 3.6%, the lowest level since 1969. It’s reasonable to expect higher wages to boost consumer purchases going forward, which may enable businesses to pass the increased labor cost on to consumers.
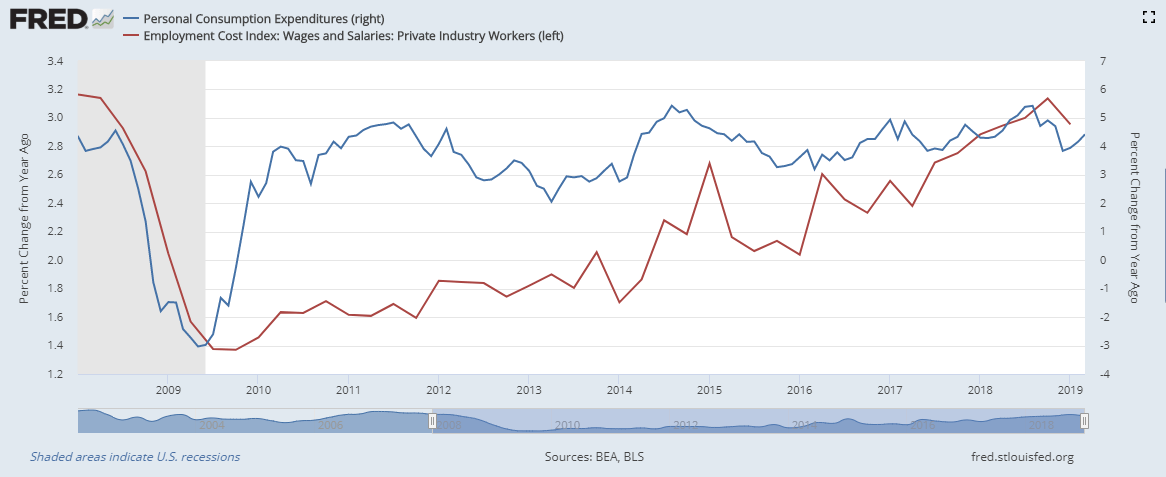
If you add increasing commodity prices such as oil (red line) and copper (blue line) to the rising wage trend, we may finally see the increase in inflation many of us have been watching for during the past few years of the economic recovery.

What is the end result? If commodity prices remain high and sales of goods and services absorb price pressure from increased labor and input costs (inflation), the Fed may have to revisit its mission to ‘normalize’ interest rates to keep the U.S. economy from overheating later this year. Market participants aren’t expecting this. Investors tend to react badly when caught by surprise, so we’re keeping a close watch on the data in the hope of being one step ahead of the crowd when the time comes to head for the exits.
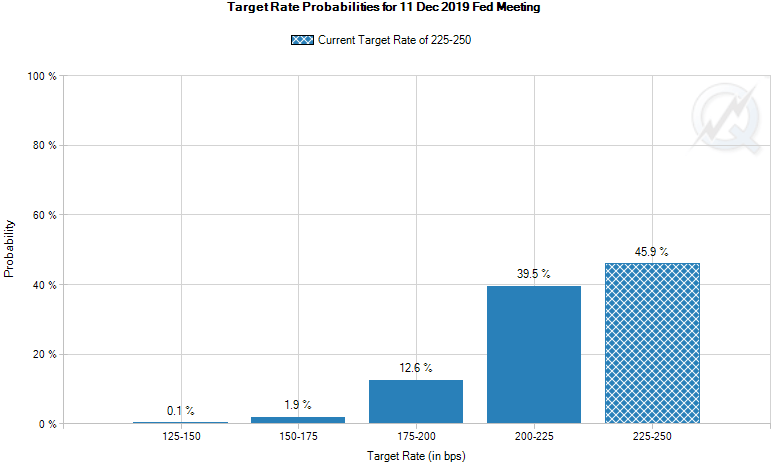
Source: https://www.cmegroup.com/trading/interest-rates/countdown-to-fomc.html
Conclusion: Enjoy the ride! (for now)
While we can’t predict when the party will end, that’s no reason not to enjoy ourselves in the meantime. A higher proportion of people are participating in the workforce than at any time since the 2008-2009 recession. Wages are rising, political tensions are easing, corporate profits aren’t as bad as feared, and interest rates remain low. What’s not to like?!
Just keep an eye out for warning lights as we get closer to the end of the year.
ASSET CLASS and SECTOR RETURNS as of APRIL 2019
Source: Morningstar Direct
Source: S&P Dow Jones Indices
 Marcia Clark, CFA, MBA
Senior Research Analyst
Warren Street Wealth Advisors
Warren Street Wealth Advisors, a Registered Investment Advisor. The information contained herein does not involve the rendering of personalized investment advice but is limited to the dissemination of general information. A professional advisor should be consulted before implementing any of the strategies or options presented. Any investments discussed carry unique risks and should be carefully considered and reviewed by you and your financial professional. Past performance may not be indicative of future results. All investment strategies have the potential for profit or loss.
DISCLOSURES
Investment Advisor Representative, Warren Street Wealth Advisors, LLC., a Registered Investment Advisor
The information presented here represents opinions and is not meant as personal or actionable advice to any individual, corporation, or other entity. Any investments discussed carry unique risks and should be carefully considered and reviewed by you and your financial professional. Nothing in this document is a solicitation to buy or sell any securities, or an attempt to furnish personal investment advice. Warren Street Wealth Advisors may own securities referenced in this document. Due to the static nature of content, securities held may change over time and current trades may be contrary to outdated publications.
Form ADV available upon request 714-876-6200
