
Periodic Table of Investing
Periodic Table of Investing
Dust off your memories of high school chemistry and think of your investment returns and your investment risks as two separate and distinct members of the periodic table. Certain elements (in this case, securities) are prone to interact when mixed, while others may remain neutral. Each element (security) will always have its own separate and unique profile and characteristics.
Starting with carbon, one of the world’s most important elements, I’d equate carbon to U.S. stocks. Regardless of age, every investor we work with has likely benefited from or utilized this element and will continue to do so in some capacity going forward.
Argon, the world’s least reactive element, tends to be more akin to Treasury Bonds or cash, not responding negatively to volatility much, if at all.
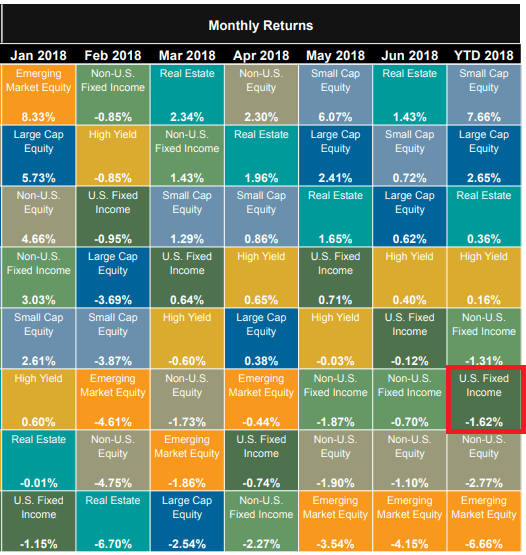
I’m far from the first person to think of investments in this way, in-fact there is deep history in what many refer to as the “Callan Chart” or “Periodic Table of Returns”. Below you’ll see a large majority of the world’s major asset classes and their returns relative to zero:
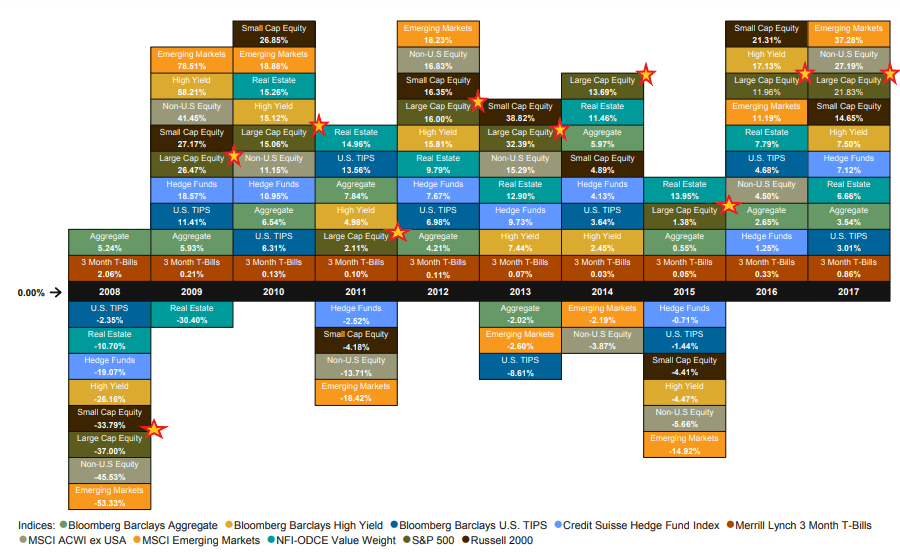
https://www.callan.com/periodic-table/
The most striking thing from this chart is that after a disastrous 2008 for everything except U.S. Bonds (argon), the only asset class that is yet to have a negative year is Large Cap ($10B+) U.S. Stocks (starred).
Winners and Losers
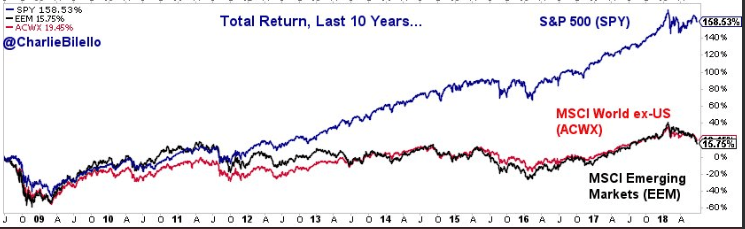
Charlie Bilello via Twitter
This freedom from negative returns and the compounding of large year-to-year gains has led to outsized outperformance from Large U.S. stocks. Over the last 10 years, Large U.S. stocks have produced cumulative total returns of 158%. Developed Foreign Country stocks have produced 19% and Emerging Markets only 16%.
Two takeaways from this are: the power of compounding positive returns but even more important is the force of losses and the time it takes to make them up. In addition, one recurring theme of study and practice in investing is that asset prices move in cycles. While U.S. outperformance seems like an unbreakable cycle, it’s just a matter of time.
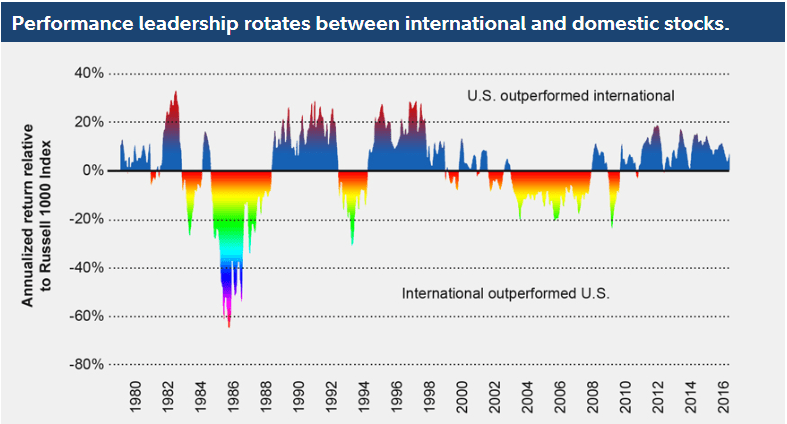
Trading Places
Take a look below at how U.S. and international stock market leadership has traded off over time. Most recently international stocks outperformed from 2003-2009, and the U.S. finds itself on its longest stretch of outperformance since 1979.
We have been incrementally positioning our clients’ portfolios for this eventual inflection since 2015. Last year we looked right, this year thus far we look wrong. Personally, I just consider myself patient as I wait for a multi-year trend to unfold.
Whether it’s high prices and valuation concerns or much of the low hanging fruit in our U.S. economic recovery is out of the way, we have a firm conviction in our posture of reducing U.S. stock market exposure. Having said that, we do not have a proverbial crystal ball, therefore we diversify and avoid throwing all of our eggs into the international basket.
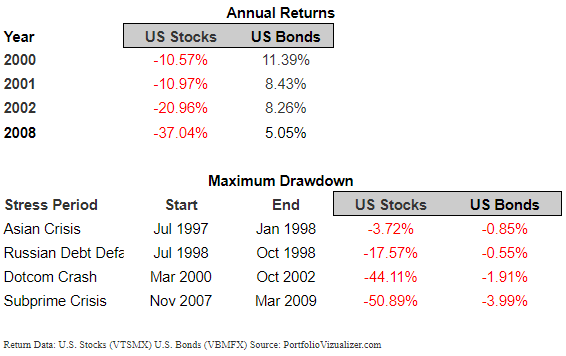
Don’t Give up on Bonds
In addition, we haven’t given up on bonds, which have been tough to own this year, with U.S. Bonds down on average -1.62%.
https://www.callan.com/periodic-table/
It’s important to keep in mind how bonds have performed during down years for the stock market, something that is potentially in the cards this far into an extended bull market.
One does not need to own the entire U.S. bond market via an index fund or otherwise. We currently prefer shorter term bonds, typically corporate bonds, and even in some cases inflation protected bonds. With a recent uptick in short-term government bonds, they aren’t nearly as painful to hold as in years past when yields hovered near zero. The 2-year treasury currently yields 2.829%, at the time of writing this article.
Late Cycle Playbook
With a backdrop of rising inflation globally, rising rates here in the U.S., accommodative monetary policy globally, and stretched valuations in U.S. equity markets, we continue to prefer assets that tend to outperform late in the economic cycle and when the factors above are present.
These assets include:
- International and Emerging Market stocks
- Industrials, Metals, Energy
- Shorter Term Bonds, TIPS
Signing Off
While we realize this year has been far less exciting than the last, we remain firm in our convictions on how we want to combine elements from the “Periodic Table of Returns” moving forward. We stand at the ready to buy into recent market weakness and will not capitulate to chasing what has done well. We appreciate your continued trust and patience while we navigate through what’s been an unstable first half of 2018. Don’t hesitate to contact our office should you have any questions or concerns about how we are approaching your investments.
Respectfully yours,
Blake Street, CFA, CFP®
 Blake Street, CFA, CFP®
Chief Investment Officer
Founding Partner
Warren Street Wealth Advisors
Blake Street is an Investment Advisor Representative of Warren Street Wealth Advisors, a Registered Investment Advisor. Information contained herein does not involve the rendering of personalized investment advice, but is limited to the dissemination of general information. A professional advisor should be consulted before implementing any of the strategies or options presented.
Any investments discussed carry unique risks and should be carefully considered and reviewed by you and your financial professional. Past performance may not be indicative of future results. All investment strategies have the potential for profit or loss. Changes in investment strategies, contributions or withdrawals may materially alter the performance, strategy, and results of your portfolio. Historical performance results for investment indexes and/or categories, generally do not reflect the deduction of transaction and/or custodial charges or the deduction of an investment-management fee, the incurrence of which would have the effect of decreasing historical performance results. Economic factors, market conditions, and investment strategies will affect the performance of any portfolio and there are no assurances that it will match or outperform any particular benchmark. Nothing in this commentary is a solicitation to buy, or sell, any securities, or an attempt to furnish personal investment advice. We may hold securities referenced in the blog and due to the static nature of content, those securities held may change over time and trades may be contrary to outdated posts.


