Market Commentary – December 2018

Market Commentary – December 2018

Key Takeaways

  • Though the U.S. stock market closed the year with its first annual loss since 2008 (S&P 500 -4.38%)(1), investors retained the vast majority of gains earned in 2017 (21.83%.) International stocks as measured by the MSCI EAFE(2) index were down -8.96%, giving up just over half of 2017’s gains (16.84%), and the Barclays Aggregate U.S. bond index ended the year flat at +0.01% after a very strong November and December.
  • Though market turbulence in the 4th quarter felt extreme, volatility over the year didn’t approach the peaks seen after the Dot Com bubble burst in 2001-2002 or during the financial crisis of 2008-2009.
  • Global financial markets tend to exhibit a ‘sector rotation’ pattern of recent losers becoming the next period’s winners. If the pattern holds true, international stocks are poised for a strong year in 2019.
  • 2018’s poor performance followed an unusually steady 10-year period of growth. Investors bold enough to put their money at risk after the market plummeted in 2008 were handsomely rewarded. Investors willing to do the same in 2019 may be rewarded once again.


It wasn’t pretty, but the year is finally over and we already see indications of better times ahead in 2019.

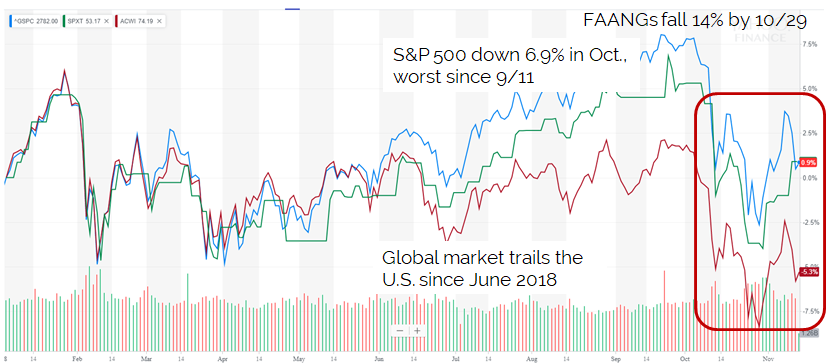
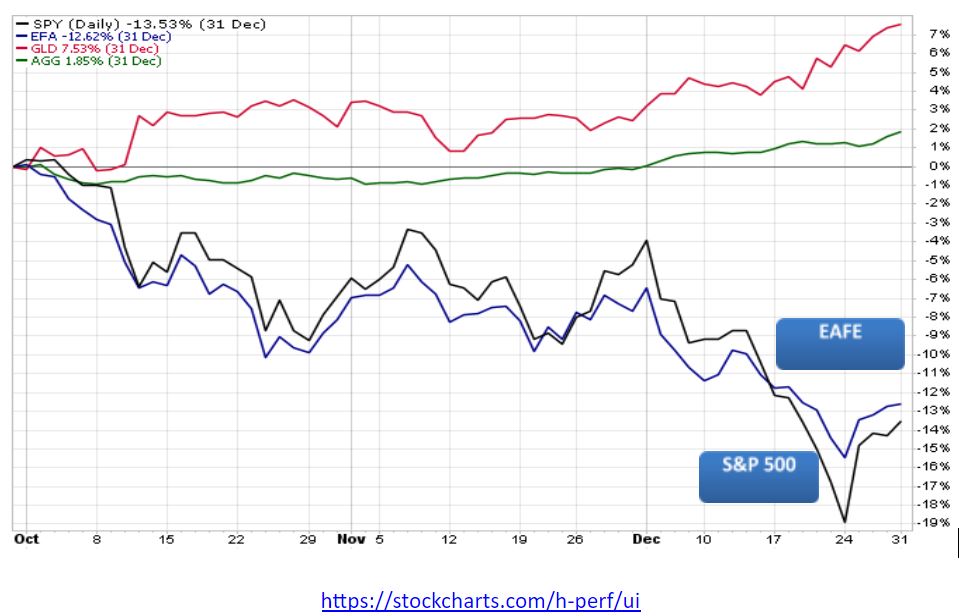
Though the U.S. stock market closed the year with its first annual loss since 2008 (-4.38%) , investors retained the vast majority of gains earned in 2017 (21.83%) and the previous 9 years of recovery post the 2008 financial crisis. Though European stock markets fell behind the U.S. last summer and never caught up, these markets also ended 2018 well ahead of where they started in 2017. International stocks as measured by the MSCI EAFE index were down -8.96% in 2018 compared to +16.84% in 2017, and U.S. bonds ended the year flat after recovering strongly late in the 4th quarter.

Source: https://stockcharts.com/h-perf/ui

Market sectors which lagged in the strong quarters, especially bonds (AGG) and gold (GLD), provided welcome relief during the 4th quarter downturn. International stock markets avoided some of the December tumble and rebounded into January 2019, easing some of the pain from lagging the robust U.S. market earlier in the year.

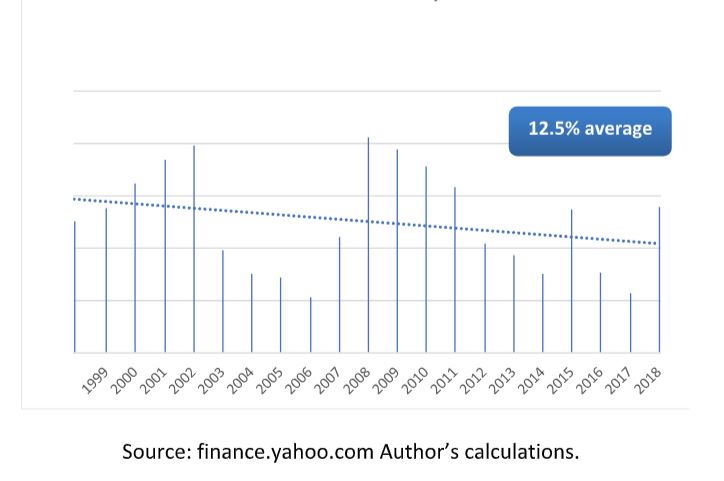
The return of stock market volatility in the 4th quarter surprised investors, especially compared to an unusually stable 2017.

Volatility in 2018 was more than double that of 2017, though did not approach the peak volatility seen during the financial crisis of 2008-2009 and post the Dot Com bubble/credit crisis in 2001-2002. The pattern seems to be that periods of unusual stability are often followed by a spike in volatility. We know that the past isn’t always reflective of the future, but as Mark Twain is reported to have said: “History doesn’t repeat itself, but it often rhymes.”

Just as periods of stability are often followed by turbulence, extreme market moves are commonly followed by reversion toward the mean (average).

This tendency is illustrated by the two charts below. The first chart shows the drop in the SPY and EFA ETFs in the period between July-November 2011. Notice the jagged ups and downs just after the drop, followed by a fairly steady up-trend through 2013, though not without some negative surprises along the way.

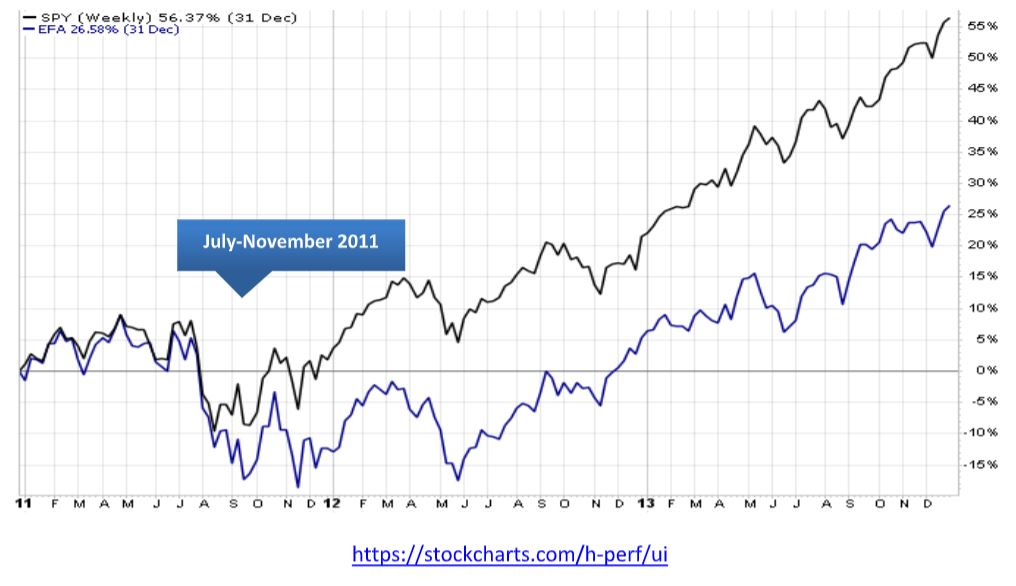
We see a similar pattern in the 4th quarter of 2015 before the start of the bull market of 2016-2017.

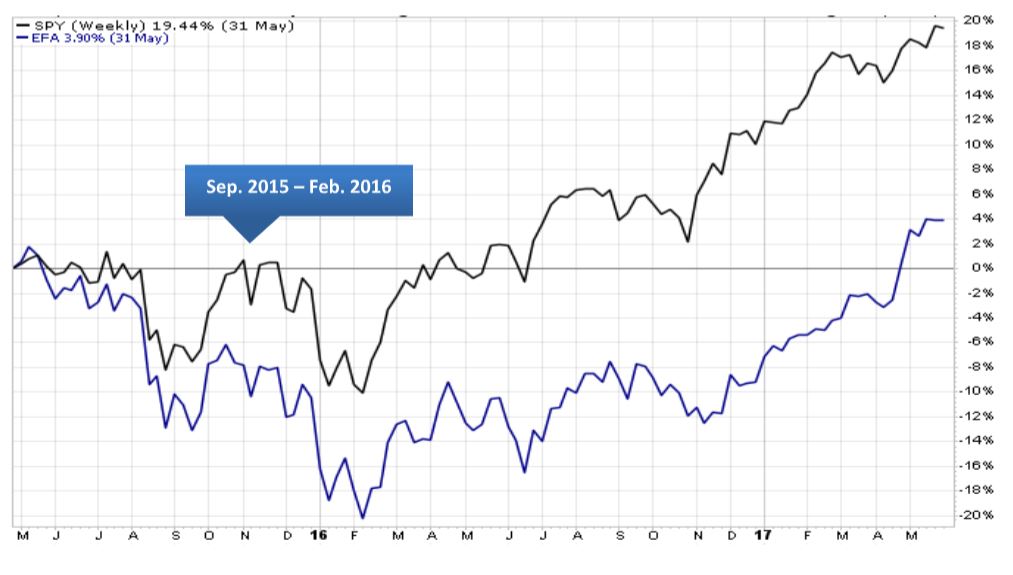
And while the downturns are painful, they tend to be relatively brief compared to the recovery period.


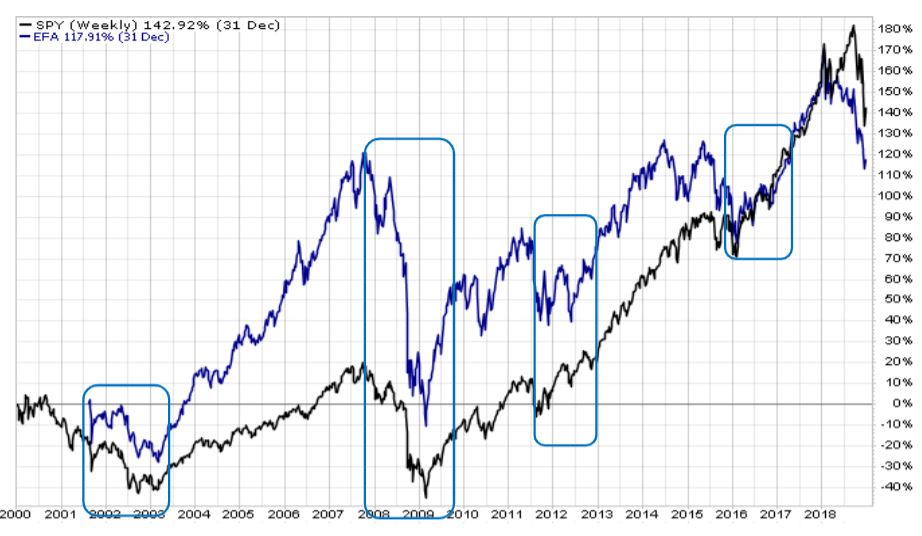
  • Dot Com bust lasted from early 2000 to early 2003, followed by 5 years of positive returns
  • Financial crisis crash lasted from late 2007 to early 2009, followed by 9 years of mostly positive returns
  • Less dramatic declines in 2011 and 2015 were followed by 3 years of positive returns

Asset class returns tend to follow a ‘sector rotation’ pattern with prior period winners commonly falling in the rankings in subsequent periods, and prior period losers tending to rise in the rankings.

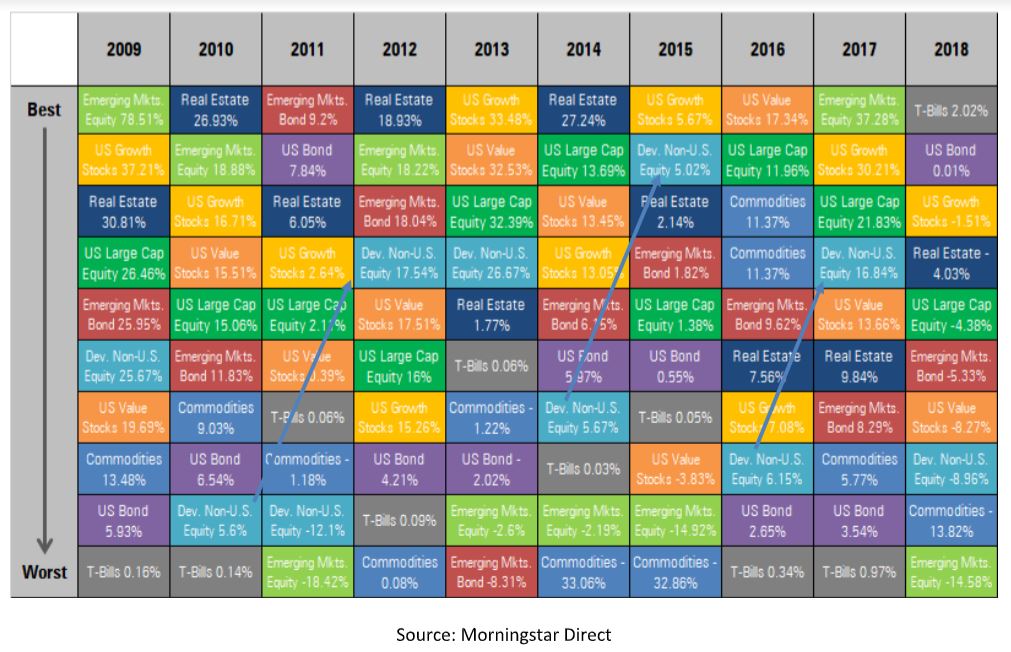
Source: Morningstar Direct

Though historical context is helpful, we need to face forward when making investment decisions. Following the crowd and expecting history to repeat itself without considering the underlying drivers of returns isn’t likely to be a successful strategy in the coming year.

Though market conditions vary from year to year, the investment team at Warren Street Wealth Advisors believes international stocks in particular have been hit by political and economic ‘headline risk’ more than actual financial distress. Many European companies such as BNP Paribas (one of the largest banks in Europe), Daimler (maker of Mercedes Benz), and Lloyds Banking Group (a leading U.K. financial service firm) are poised for a strong rebound in 2019. In emerging countries, stalwart firms such as Samsung and Taiwan Semiconductor remain solid global players, with disruptors such as Alibaba and Tencent making their presence felt beyond their home base in AsiaPacific.

Another important thing to remember is that the stock market is not the real economy. Fundamental strength in corporate balance sheets should keep the global economy, and the markets, positive in 2019.

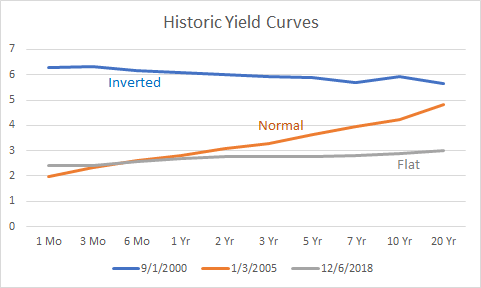
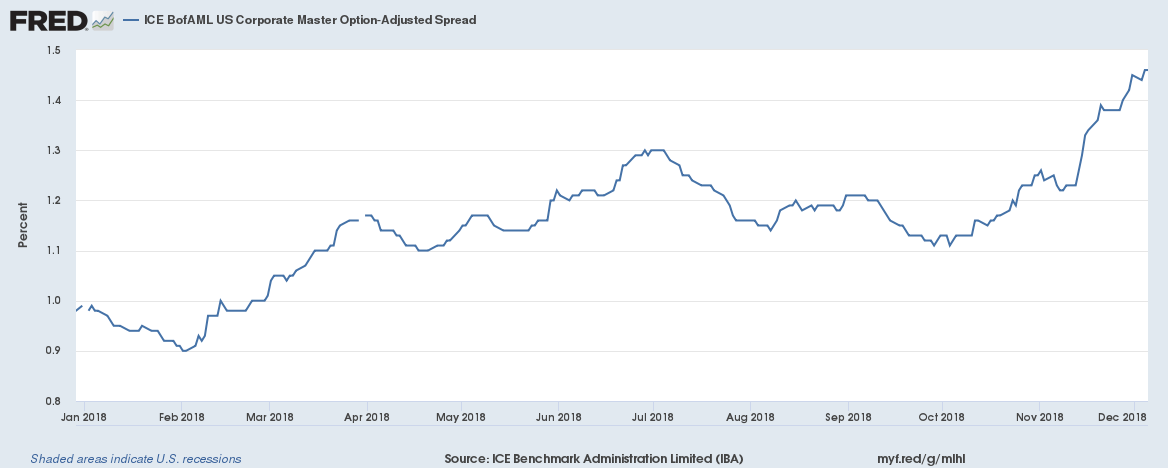
GDP reflects the value of goods and services produced in a country – ultimately, GDP reflects corporate earnings. Robust U.S. GDP growth early in 2017 led to tight labor markets and rising inflation, supporting the Federal Reserve’s plan to ‘normalize’ short-term interest rates(3). Though GDP growth is expected to slow in 2019, the Federal Reserve forecasts a positive growth rate of approximately 2%. Not stellar, but certainly not in recession territory. And not so strong as to require the Fed to increase their pace of raising short-term interest rates, since modest GDP growth is unlikely to spark inflation. The International Monetary Fund is projecting similar modest positive growth for developed nations, and near 5% growth for emerging economies.


Growth Projection for U.S. GDP

Source: Factset


Growth Projection for the World

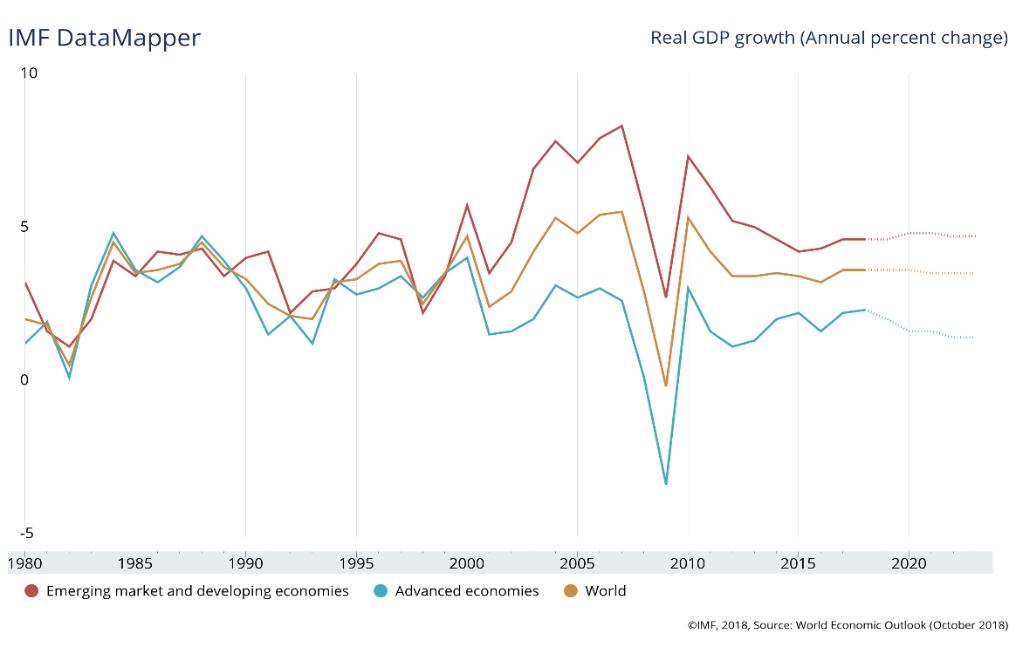
Source: International Monetary Fund


Economic fundamentals should ultimately find their way into stock prices, but the markets often become overly optimistic or pessimistic along the way.

As we mentioned in our November commentary, S&P 500 corporate profits were very strong in the 4th quarter of 2018. And for the calendar year, growth in corporate profits was 20.3% due in part to the reduced corporate tax rate(4). This is the highest growth rate we’ve seen since 2010 when profits jumped nearly 40% coming out of the Great Recession of 2008-2009. All 11 sectors of the S&P 500 reported positive growth for the year, with 9 of the 11 sectors reporting double-digit growth.


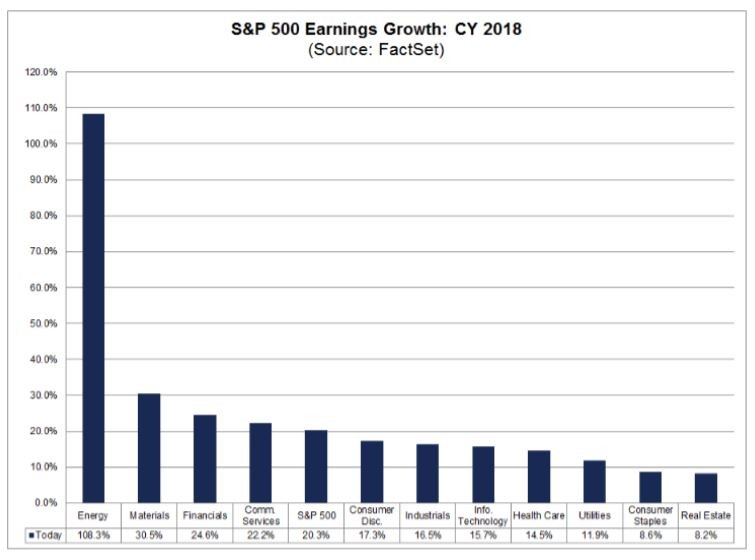
You might be surprised to see that Energy companies reported the highest calendar year earnings growth of all the 11 sectors. Despite the 4th quarter fall in oil prices, oil has actually increased when compared against the prior year-end. Materials and Financials also posted strong earnings growth in 2018, a fact not reflected in their December closing stock prices.

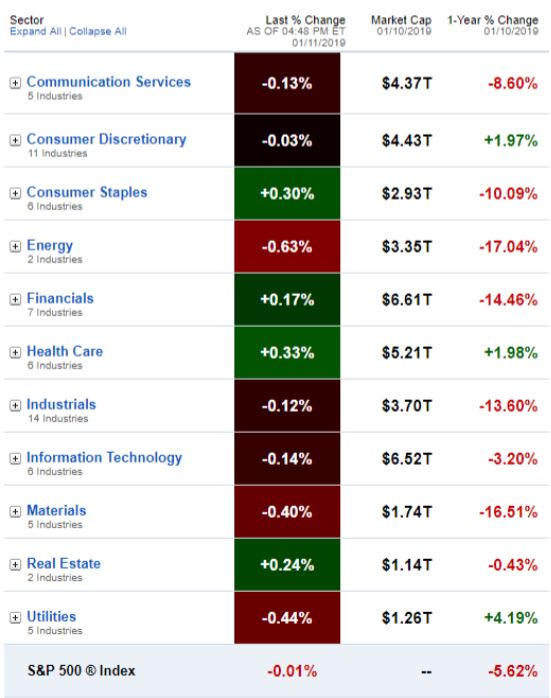
As shown in the chart above from Fidelity Research(5), the biggest losers in the S&P 500 were not Technology companies which were grabbing most of the news headlines, but rather Industrials, Financials, Materials, and Energy firms. Industrials and materials were hard hit by concerns over trade tariffs and a slowing, though still strong, pace of new home building(6). Energy equipment and services firms suffered from falling oil prices hurting profit margins. Financial firms also struggled as increasing short-term funding rates squeezed investors’ profit expectations.

Conclusion: Though we can’t predict the future, periods of extreme market movements are often followed by reversion toward the mean. The underlying economic data remains solid and sooner or later investors will incorporate this reality into global stock and bond prices. In the meantime, the investment team at Warren Street Wealth Advisors is watching the data, rebalancing into weakness, and looking forward to a smoother ride in 2019.


Marcia Clark, CFA, MBA
Senior Research Analyst
Warren Street Wealth Advisors

Warren Street Wealth Advisors, a Registered Investment Advisor. The information contained herein does not involve the rendering of personalized investment advice but is limited to the dissemination of general information. A professional advisor should be consulted before implementing any of the strategies or options presented. Any investments discussed carry unique risks and should be carefully considered and reviewed by you and your financial professional. Past performance may not be indicative of future results. All investment strategies have the potential for profit or loss. 


Sources

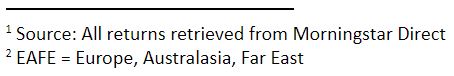
  1. All returns retrieved from Morningstar Direct
  2. EAFE = Europe, Australasia, Far East
  3. https://insight.factset.com/2017-look-back-2018-predictions-0
  4. https://insight.factset.com/sp-500-2018-earnings-preview-highest-earnings-growth-in-eight-years
  5. https://eresearch.fidelity.com/eresearch/markets_sectors/sectors/sectors_in_market.jhtml
  6. https://tradingeconomics.com/united-states/housing-starts


What is a Roth Conversion?

What is a Roth Conversion?

According to Investopedia, “a Roth IRA conversion is a reportable movement of assets from a Traditional IRA, SEP or SIMPLE IRA to a Roth IRA, which is a taxable event. A Roth conversion can be advantageous for individuals with large traditional IRA accounts who expect their future tax bills to stay at the same level or grow at the time they plan to start withdrawing from their tax-advantaged account, as a Roth IRA allows for tax-free withdrawals of qualified distributions.”

To simplify this down, you are taking assets from a qualified account, such as the traditional IRA,  paying the income taxes owed on the amount now, and moving them into a Roth IRA to capitalize on the tax-free income on eligible withdrawals.

Why would someone do this?

If someone feels that their tax liability is going to increase in the future, this provides a way for tax diversification. For example, if you are in a low tax bracket currently and have a large sum of your assets in qualified accounts, then it may make sense to convert the funds assuming you have the cash on hand to cover the tax liability.

Taking advantage of your low tax basis now (maybe even specific to the most recent tax reform) could allow you to control your RMDs (required minimum distributions) in the future or allow you to leave money more efficiently to your heirs, especially if your income tax rate is lower than theirs.

Who would be someone that would want to do this?

There are a couple different scenarios that this strategy might be useful in.

One is a retiree who is going to have no earned income and has plenty of assets for a successful retirement. If their asset base is large enough to not worry about income, chances are they may run into Required Minimum Distributions in the future. To control this, they could convert money now and limit their tax exposure during the RMD years. Additionally, if they plan to leave money to their heirs, this is an opportunity to leave it for them income tax-free.

A second scenario might include someone who is not in retirement, but perhaps they had a lower than normal income year, has a long time horizon until retirement, and has qualified assets they would rather have in a Roth. In our “younger than retirement age” scenario, their financial plan might dictate they would retire prior to the 59.5 age mark. This conversion would allow them to tap into their basis before 59.5.

In all instances, if someone has qualified assets, a lower than normal current tax environment, and the cash to complete the conversion, then it is something to be considered for financial planning purposes.

Additionally, there are some nuanced rules regarding how long someone must wait to access these funds known as the “5-year rule”. You can learn more about the finer details around that issue here: https://www.kitces.com/blog/understanding-the-two-5-year-rules-for-roth-ira-contributions-and-conversions/

How does one convert their traditional IRA funds to Roth?

This can be a tricky process since timelines and amounts might need to be tracked for the “5-year rule”, so we recommend speaking with your personal financial planner and/or accountant to make sure that this might be a good fit for you and your plan.

Overall, the Roth conversion can be a good strategy assuming that all the important variables line up in regards to tax rates, timing, and cash on hand. However, a Roth conversion should be considered on a case-by-case basis and may not be right for everyone. With it being a tricky strategy to execute, make sure you consult your financial advisor or account for a smooth process.


Cary Warren Facer, Founding Partner

Warren Street Wealth Advisors


Warren Street Wealth Advisors, a Registered Investment Advisor. The information contained herein does not involve the rendering of personalized investment advice but is limited to the dissemination of general information. A professional advisor should be consulted before implementing any of the strategies or options presented. Any investments discussed carry unique risks and should be carefully considered and reviewed by you and your financial professional. Past performance may not be indicative of future results. All investment strategies have the potential for profit or loss. Warren Street Wealth Advisors are not Certified Public Accountants and all tax-related matters should be vetted and acted on with your personal tax counsel.


End-of-the-Year Money Moves

End-of-the-Year Money Moves

Here are some things you might want to do before saying goodbye to 2018.  

What has changed for you in 2018? Did you start a new job or leave a job behind? Did you retire? Did you start a family? If notable changes occurred in your personal or professional life, then you will want to review your finances before this year ends and 2019 begins.

Even if your 2018 has been relatively uneventful, the end of the year is still a good time to get cracking and see where you can plan to save some taxes and/or build a little more wealth.  

Do you practice tax-loss harvesting? That is the art of taking capital losses (selling securities worth less than what you first paid for them) to offset your short-term capital gains. If you fall into one of the upper tax brackets, you might want to consider this move, which directly lowers your taxable income. It should be made with the guidance of a financial professional you trust. (1)  

In fact, you could even take it a step further. Consider that up to $3,000 of capital losses in excess of capital gains can be deducted from ordinary income, and any remaining capital losses above that can be carried forward to offset capital gains in upcoming years. When you live in a high-tax state, this is one way to defer tax. (1)

Do you want to itemize deductions? You may just want to take the standard deduction for 2018, which has ballooned to $12,000 for single filers and $24,000 for joint filers because of the Tax Cuts & Jobs Act. If you do think it might be better for you to itemize, now would be a good time to get the receipts and assorted paperwork together. While many miscellaneous deductions have disappeared, some key deductions are still around: the state and local tax (SALT) deduction, now capped at $10,000; the mortgage interest deduction; the deduction for charitable contributions, which now has a higher limit of 60% of adjusted gross income; and the medical expense deduction. (2,3)

Could you ramp up 401(k) or 403(b) contributions? Contribution to these retirement plans lower your yearly gross income. If you lower your gross income enough, you might be able to qualify for other tax credits or breaks available to those under certain income limits. Note that contributions to Roth 401(k)s and Roth 403(b)s are made with after-tax rather than pre-tax dollars, so contributions to those accounts are not deductible and will not lower your taxable income for the year. They will, however, help to strengthen your retirement savings. (4)

Are you thinking of gifting? How about donating to a qualified charity or non-profit organization before 2018 ends? In most cases, these gifts are partly tax deductible. You must itemize deductions using Schedule A to claim a deduction for a charitable gift. (5)

If you donate publicly traded shares you have owned for at least a year, you can take a charitable deduction for their fair market value and forgo the capital gains tax hit that would result from their sale. If you pour some money into a 529 college savings plan on behalf of a child in 2018, you may be able to claim a full or partial state income tax deduction (depending on the state). (2,6)

Of course, you can also reduce the value of your taxable estate with a gift or two. The federal gift tax exclusion is $15,000 for 2018. So, as an individual, you can gift up to $15,000 to as many people as you wish this year. A married couple can gift up to $30,000 in 2018 to as many people as they desire. (7)

While we’re on the topic of estate planning, why not take a moment to review the beneficiary designations for your IRA, your life insurance policy, and workplace retirement plan? If you haven’t reviewed them for a decade or more (which is all too common), double-check to see that these assets will go where you want them to go, should you pass away. Lastly, look at your will to see that it remains valid and up-to-date.   

Should you convert all or part of a traditional IRA into a Roth IRA? You will be withdrawing money from that traditional IRA someday, and those withdrawals will equal taxable income. Withdrawals from a Roth IRA you own are not taxed during your lifetime, assuming you follow the rules. Translation: tax savings tomorrow. Before you go Roth, you do need to make sure you have the money to pay taxes on the conversion amount. A Roth IRA conversion can no longer be recharacterized (reversed). (8)

Can you take advantage of the American Opportunity Tax Credit? The AOTC allows individuals whose modified adjusted gross income is $80,000 or less (and joint filers with MAGI of $160,000 or less) a chance to claim a credit of up to $2,500 for qualified college expenses. Phase-outs kick in above those MAGI levels. (9)

See that you have withheld the right amount. The Tax Cuts & Jobs Act lowered federal income tax rates and altered withholding tables. If you discover that you have withheld too little on your W-4 form so far in 2018, you may need to adjust your withholding before the year ends. The Government Accountability Office projects that 21% of taxpayers are withholding less than they should in 2018. Even an end-of-year adjustment has the potential to save you some tax. (10)

What can you do before ringing in the New Year? Talk with a financial or tax professional now rather than in February or March. Little year-end moves might help you improve your short-term and long-term financial situation.


Justin D. Rucci, CFP®
Wealth Advisor
Warren Street Wealth Advisors

Justin is an Investment Advisor Representative of Warren Street Wealth Advisors, a Registered Investment Advisor. The information contained herein does not involve the rendering of personalized investment advice but is limited to the dissemination of general information. A professional advisor should be consulted before implementing any of the strategies or options presented.

This material was prepared by MarketingPro, Inc., and does not necessarily represent the views of the presenting party, nor their affiliates. This information has been derived from sources believed to be accurate. Please note – investing involves risk, and past performance is no guarantee of future results. The publisher is not engaged in rendering legal, accounting or other professional services. If assistance is needed, the reader is advised to engage the services of a competent professional. This information should not be construed as investment, tax or legal advice and may not be relied on for avoiding any Federal tax penalty. This is neither a solicitation nor recommendation to purchase or sell any investment or insurance product or service, and should not be relied upon as such. All indices are unmanaged and are not illustrative of any particular investment.

Any investments discussed carry unique risks and should be carefully considered and reviewed by you and your financial professional. Past performance may not be indicative of future results. All investment strategies have the potential for profit or loss. Changes in investment strategies, contributions or withdrawals may materially alter the performance, strategy, and results of your portfolio. Historical performance results for investment indexes and/or categories, generally do not reflect the deduction of transaction and/or custodial charges or the deduction of an investment-management fee, the incurrence of which would have the effect of decreasing historical performance results. Economic factors, market conditions, and investment strategies will affect the performance of any portfolio and there are no assurances that it will match or outperform any particular benchmark. Nothing in this commentary is a solicitation to buy, or sell, any securities, or an attempt to furnish personal investment advice. We may hold securities referenced in the blog and due to the static nature of the content, those securities held may change over time and trades may be contrary to outdated posts.


Citations

1 – nerdwallet.com/blog/investing/just-how-valuable-is-daily-tax-loss-harvesting/ [4/16/18]
2 – marketwatch.com/story/how-to-game-the-new-standard-deduction-and-3-other-ways-to-cut-your-2018-tax-bill-2018-10-15 [10/15/18]
3 – hrblock.com/tax-center/irs/tax-reform/3-changes-itemized-deductions-tax-reform-bill/ [10/10/18]
4 – investopedia.com/articles/retirement/06/addroths.asp [2/2/18]
5 – investopedia.com/articles/personal-finance/041315/tips-charitable-contributions-limits-and-taxes.asp [10/1/18]
6 – savingforcollege.com/article/how-much-is-your-state-s-529-plan-tax-deduction-really-worth [9/27/18]
7 – fool.com/retirement/2018/06/28/5-things-you-might-not-know-about-the-estate-tax.aspx [6/28/18]
8 – marketwatch.com/story/how-the-new-tax-law-creates-a-perfect-storm-for-roth-ira-conversions-2018-03-26 [9/15/18]
9 – fool.com/investing/2018/03/17/your-2018-guide-to-college-tuition-tax-breaks.aspx [3/17/18]
10 – money.usnews.com/money/personal-finance/taxes/articles/2018-10-16/should-you-adjust-your-income-tax-withholding [10/16/18]

Market Commentary – November 2018

Market Commentary – November 2018

Key Points:

  • Global markets remained volatile despite more clarity about the geopolitical landscape and economic outlook
  • 78% of S&P 500 companies reported positive earnings surprises. A survey of large corporations indicated an expectation for EPS to slow somewhat in 2019 from the current high levels.
  • The U.S. stock market is not rewarding positive surprises as much as usual and is punishing negative surprises more than usual, resulting in lower lows and not-as-high highs as might be expected.
  • The Fed’s mission to bring short-term rates to more ‘normal’ levels is narrowing the difference between short- and longer-term interest rates (a ‘flat’ or ‘inverted’ Treasury yield curve.) Muted inflation expectations and investor ‘flight to quality’ is keeping demand for long-term bonds high, putting downward pressure on yields. Neither of these factors indicates a recession is imminent.
  • Conclusion: The U.S. economy isn’t going into a recession, it’s just taking a bit of a breather. The stock market will eventually recognize this and stabilize, but it may take a few more months.

Finally! A month of positive returns for the global financial markets.

Uncertainty eased a bit in November as midterm elections were completed with no big surprises, talks of trade wars continued without significant escalation, and Fed Chairman Jerome Powell indicated interest rates were nearing a neutral point. What a relief! Not that the month was pretty, it was far from it, but at least we ended up higher than where we started.

Of course, there are still things to worry about. According to the World Bank¹, energy-related commodities dropped 15.4% in November as OPEC and other oil-producing countries failed to limit supply. European banks and automakers continued to struggle amid news of the German financial giant Deutsche Bank being accused of money laundering. Here in the U.S., General Electric is battling CEO drama, debt issues, and anemic revenues. General Motors announced plans to close some of their factories. These events are certainly worth keeping an eye on but aren’t likely to kick the feet out from under global economies.

So if the economy is doing OK, why is the stock market so jittery?

When all is said and done, stock prices should reflect expectations of future profits. According to a recent article published by FactSet², the most commonly reported factor negatively impacting corporate earnings in the 4th quarter wasn’t trade tariffs or rising interest rates like we’ve heard from market commentators, but rather the strength of the U.S. dollar. The next most mentioned factor was the rising costs of raw materials and labor. Despite these headwinds, corporate profits have been strong.

impact factors

We also were told earlier in the year that the markets were ‘fully valued’ or ‘expensive’ relative to historical norms. One positive outcome of the market corrections in October, November, and early December is that stock prices are now well within the normal range for fair value.

According to FactSet’s ‘Earnings Insight’ report published November 30, 2018³:

  • 78% of S&P 500 companies reported a positive EPS surprise and 61% reported a positive sales surprise
  • The blended earnings growth rate for the S&P 500 is 25.9%. If 25.9% is the actual growth rate for the quarter, it will mark the highest earnings growth since Q3 2010.
  • All eleven sectors have higher growth rates than the 3rd quarter due to positive EPS surprises and upward revisions to EPS estimates.
  • 68 S&P 500 companies have issued negative EPS guidance and 31 S&P 500 companies have issued positive EPS guidance
  • The forward 12-month P/E ratio for the S&P 500 is 15.6, below the 5-year average (16.4) but above the 10-year average (14.6)

sp500 earnings

All this data means that U.S. corporations are doing fine. We recognize that many companies are forecasting slower growth in 2019 but slower growth from a robust pace doesn’t mean the economy is falling off a cliff. In fact, the U.S. has never had a recession when corporate profits are growing. What we’re seeing in the market is a disconnect between reality and expectations, with wary investors sitting on the sidelines instead of jumping in to ‘buy the dip’. The volatility in the U.S. stock market is not due to deteriorating fundamentals, but rather to investors not rewarding positive surprises as much as usual (fewer buyers), and punishing negative surprises more than usual (more sellers.)

  • Companies reporting positive earnings surprises have seen their stock price rise by only +0.1% in the two days prior to and after the announcement, relative to the 5-year average gain of +1.0%
  • Companies posting negative earnings surprises have seen their stock price slump by -3.1% in the same timeframe, compared to the 5-year average of -2.5%

eps and price change

OK, maybe the stock market is overreacting. But what’s this we hear about the ‘inverted yield curve’ forecasting that a recession is imminent?

A ‘yield curve’ is a graphical depiction of market-based yield-to-maturity for bonds with different maturity dates. The curve is usually upwardly sloping, meaning that lenders and investors require higher returns the longer they have to wait to get their money back. Over the past year, the difference between the 10-year and 2-year Treasury yields has been getting smaller and smaller, causing the yield curve to ‘flatten’. If short-term bond yields become higher than longer-term yields – an ‘inverted’ yield curve – investors interpret this as a signal of a coming recession.

yield curves

Source: treasury.gov

What you don’t hear in the news is that yield curve inversion has preceded recessions by up to 2 years, which isn’t much of a prediction. When you add the observation that there have been more yield curve inversions than recessions, perhaps we should take a closer look at the ‘cause’ of the yield curve inversion before we jump to the ‘effect’.

Let’s start by refreshing our memory on the definition of a recession:

  • GDP (Gross Domestic Product) is the value of goods and services produced in the U.S.
  • A recession is two quarters of negative GDP growth

By definition then, corporate profits have to slow substantially for GDP growth to become negative. Right now employment is strong, wages are growing, and corporate profits are solid. As long as people have jobs, they tend to buy stuff. As long as people buy stuff, corporations will be profitable. If corporations are profitable, GDP growth should remain positive. Given everything we see in regard to the current macroeconomic environment, the investment team at Warren Street Wealth Advisors expects slow and steady growth to continue at least through summer of 2019, and probably longer. As long we can dodge potential catastrophes caused by weather, wars, or geopolitical events, there’s no reason for the U.S. economy to fall into a recession.

So if the economy isn’t going to stall, what’s with the inverted yield curve?

There’s nothing mysterious about why short-term rates are going up – the Fed is pushing short-term interest rates back to ‘normal’ levels. The question then revolves around why long-term rates aren’t going up as much.

Long-term Treasury rates aren’t set by the Fed, but by the willingness of investors and businesses to borrow and lend. This willingness is driven by 1) economic growth, 2) inflation expectations, and 3) risk appetites.

    1. We’ve already talked about economic growth being solid but not outstanding, so no need for long-term rates to rise significantly in response to business demand for funds
    2. Inflation is hovering around 2%, just where the Fed wants it, so current yields are sufficient to protect purchasing power
    3. The biggest reason for the current inversion is probably related to risk appetites

What kind of risk am I talking about? Market risk.

With the wide swings in the stock market in recent months, we’ve seen a ‘flight to quality’ away from stocks and toward the safety of Uncle Sam. More demand for Treasury bonds leads to higher prices, and when bond prices rise, yields fall. With short-term rates moving up due to Fed actions and long-term rates staying low due to market forces, the yield curve flattens. It isn’t recessionary, it’s just simple supply and demand. In fact, if you look at corporate bond yields instead of Treasuries, longer-term yields have indeed been rising as the Fed increases short-term rates.

corporate sprea

There’s really only one conclusion to draw from the available evidence. The U.S. economy isn’t going into a recession, it’s just taking a bit of a breather.

While the markets adjust to this new reality, investors are getting tired of enduring the huge swings in stock prices. When investors stay on the sidelines and stop ‘buying the dips’, stock prices have trouble finding a floor. Hence the tendency for the market to fall by hundreds of points on news headlines, whether the information impacts long-term profits or not. What should we do now? The investment team at Warren Street Wealth Advisors is buckling our seatbelts and holding on tight as we speed toward a turbulent year-end close. We’re confident that the fundamental strength of U.S. and global economies will win out eventually, but it may take another few months for the markets to reward our patience.

In the meantime, we’re here for you! Call or stop by any time to share your questions, concerns, or suggestions.


Which of the following yields curves is best characterized as ‘inverted’? (Focus on the upper line on each chart)

chart 1 chart 2


Marcia Clark, MBA, CFA
Senior Research Analyst
Warren Street Wealth Advisors

Warren Street Wealth Advisors, a Registered Investment Advisor. The information contained herein does not involve the rendering of personalized investment advice but is limited to the dissemination of general information. A professional advisor should be consulted before implementing any of the strategies or options presented. Any investments discussed carry unique risks and should be carefully considered and reviewed by you and your financial professional. Past performance may not be indicative of future results. All investment strategies have the potential for profit or loss. 


¹ http://www.worldbank.org/en/research/commodity-markets
² https://insight.factset.com/what-factors-may-have-a-negative-impact-on-revenue-and-earnings-growth-in-q4
³ https://www.factset.com/hubfs/Resources%20Section/Research%20Desk/Earnings%20Insight/EarningsInsight_113018.pdf
⁴ https://www.wsj.com/articles/stocks-stage-recovery-after-dow-drops-over-700-points-1544075565
⁵ https://www.wsj.com/articles/stocks-stage-recovery-after-dow-drops-over-700-points-1544075565
Quiz Answer: Chart #2

Word on the Street – November 27th – December 1st

Word on the Street – November 27th – December 1st

Another brief conversation with our CIO on current events in the investing world…

A sit down with Blake Street, CFA, CFP® to discuss some current events in the news, their impact on investors, and his sentiment on some issues. Enjoy…

Trade War talks are still present as people were worried about the G20 meeting. Since our last conversation, where do you think we are now with the trade talks?

Blake Street: Specific to the US and China, much remains to be seen. At this point, we are still on the light end of threatened tariffs with escalation due here soon without further intervention. In recent days, the President has new motivation to come up with some type of remedy to re-instill confidence in the markets. One way would be to calm US & China trade tensions and get global growth back on track. It remains to be seen if this is the case. As we have seen in the recent past, sometimes these summits result in a lot of talk and no action. The G20 Summit resulted in a “truce” or “ceasefire” of sorts between the US & China, however, very little clarity has been provided and an arrest of the CFO of Huawei, China’s largest tech company, this morning (12/6/2018) could further inflame tensions.

General Motors seems to have suffered greatly due to the tariffs, among other things. Do you think that this is going to be a reoccurring theme for some US companies, or is this just a casualty of war?

B.S.: I don’t know if you can say they suffered greatly, but they are doing what every company should do which is look out for their long-term interests. They have spotted changes in their own market landscape that require a change in where they produce their products and what products they produce for consumers. Tariffs have certainly hurt their bottom line by increasing certain input costs and while this seems obvious in hindsight, a lot of industries from automotive manufacturers to agricultural producers have been harmed by trade tensions and tariffs.

Oil prices are down again as well. How with this impact both consumers at the pump and investors? What do you think the long-term trend will be?

B.S.: Consumers during the holiday season will benefit by keeping more money in their pocket. However, falling crude prices can also come with other adverse impacts such as slowing economies and weak investment markets. Historically, 30% declines in crude oil prices have correlated strongly to short-term bear markets, not always a recession.

Personally, I think the most recent selloff is overdone, and we will return to higher oil prices in the not too distant future. Case and point, I don’t think that demand has dropped off in a meaningful way, and we have not seen the type of supply buildups reminiscent of 2015, the last time we saw oil prices collapse.

On Wednesday (11/28/2018), Jerome Powell, Chair of the Federal Reserve, came out and said that the Fed Funds rate is approaching neutral. This news was a stark contrast to his October statements. What does this mean for the market as we approach 2019?

B.S.: Investors and markets alike were appeased to hear that we may be due for fewer rate hikes than initially priced in. Foreign markets have also been dealing with adverse effects of a strengthening US dollar and rising US interest rates. Markets overseas breathed a sigh of relief to hear of a potentially more accommodative Fed policy.

In my mind, an even bigger question mark is how the Fed continues to handle the unwinding of its balance sheet in the coming years. I’m also slightly concerned with President Trump’s recent politicization of the Fed. At the end of the day, Fed Chair Jerome Powell has a job to do, and it is not solely to provide octane to investment markets at the President’s request. I expect the Fed to remain focused on their traditional mandate and to shirk Presidential pressures.


Warren Street Wealth Advisors, a Registered Investment Advisor. The information contained herein does not involve the rendering of personalized investment advice but is limited to the dissemination of general information. A professional advisor should be consulted before implementing any of the strategies or options presented. Any investments discussed carry unique risks and should be carefully considered and reviewed by you and your financial professional. Past performance may not be indicative of future results. All investment strategies have the potential for profit or loss. 


Case Study: Start Retirement on Vacation

Case Study – Start Retirement on Vacation

Learn how we helped a client retire early, without penalty, move out-of-state, and get their desired income level by constructing a strong financial plan.

When most people think of working with a financial advisor for retirement, people think about investment management strategies. Having someone whom they could trust and feel confident in handling their money. Believe us, having trust and confidence in someone to handle your money correctly is a big piece of the puzzle when choosing an advisor.

However, a good financial advisor brings more to the table than their investment strategy. They should bring some financial planning knowledge that can help you retire smoothly and utilize as much of your retirement benefits as possible, and that is exactly what we want to share in this case study.

We worked with a client who planned on retiring towards the end of the year. They had done a great job saving, had plenty of assets to retire, and they were counting down the days to their December retirement date.

It was hard to not get wrapped up in their excitement because it is such an exhilarating time, but we wanted to make sure we had done all the due diligence on their benefits package. During our research, we learned how their vacation time worked which gave our client an incredible start to
retirement.

At this particular job, vacation time was reset as of the first of the year, so on January 1st, our client earned 6 weeks of paid vacation time. If you retire with vacation days left over, then you will get paid based off of how much of that time you “accrued”. For example, if you worked 6 months out of the year, then you would be able to get one-half of the unused vacation time paid out.

With our client planning on retiring so close to the new year, we advised them to delay their retirement a couple weeks, take vacation time the first 6 weeks of the new year, and be able to enjoy the full value of the benefit. The client even gets to collect a couple of paychecks to start their retirement.

By doing a bit of digging, we were able to get them more benefit than they had believed available and a great start to retirement. You want an advisor who is competent when it comes to building an investment strategy, but you also want to make sure your advisor is looking into every avenue possible to get you the benefits you have earned.

It would have been easy to tell the client to go ahead and retire, but it’s not about doing what is easy for the client.

It is about doing what is right and in the client’s best interest.


Any investments discussed carry unique risks and should be carefully considered and reviewed by you and your financial professional. Past performance may not be indicative of future results. All investment strategies have the potential for profit or loss. Changes in investment strategies, contributions or withdrawals may materially alter the performance, strategy, and results of your portfolio. Historical performance results for investment indexes and/or categories, generally do not reflect the deduction of transaction and/or custodial charges or the deduction of an investment-management fee, the incurrence of which would have the effect of decreasing historical performance results. Economic factors, market conditions, and investment strategies will affect the performance of any portfolio and there are no assurances that it will match or outperform any particular benchmark. Nothing in this commentary is a solicitation to buy, or sell, any securities, or an attempt to furnish personal investment advice. We may hold securities referenced in the blog and due to the static nature of the content, those securities held may change over time and trades may be contrary to outdated posts.


Social Security Gets Its Biggest Boost in Years

Social Security Gets Its Biggest Boost in Years

Seniors will see their retirement benefits increase by an average of 2.8% in 2019.

Social Security will soon give seniors their largest “raise” since 2012. In view of inflation, the Social Security Administration has authorized a 2.8% increase for retirement benefits in 2019. (1)

This is especially welcome, as annual Social Security cost-of-living adjustments, or COLAs, have been irregular in recent years. There were no COLAs at all in 2010, 2011, and 2016, and the 2017 COLA was 0.3%. This marks the second year in a row in which the COLA has been at least 2%. (2)

Not every retiree will see their benefits grow 2.8% next year. While affluent seniors will probably get the full COLA, more than 5 million comparatively poorer seniors may not, according to the Senior Citizens League, a lobbying group active in the nation’s capital. (1)

Why, exactly? It has to do with Medicare’s “hold harmless” provision, which held down the cost of Part B premiums for select Medicare recipients earlier in this decade. That rule prevents Medicare Part B premiums, which are automatically deducted from monthly Social Security benefits, from increasing more than a Social Security COLA in a given year. (Without this provision in place, some retirees might see their Social Security benefits effectively shrink from one year to the next.) (1)

After years of Part B premium inflation being held in check, the “hold harmless” provision is likely fading for the above-mentioned 5+ million Social Security recipients. They may not see much of the 2019 COLA at all. (1)

Even so, the average Social Security beneficiary will see a difference. The increase will take the average individual monthly Social Security payment from $1,422 to $1,461, meaning $468 more in retirement benefits for the year. An average couple receiving Social Security is projected to receive $2,448 per month, which will give them $804 more for 2019 than they would get without the COLA. How about a widower living alone? The average monthly benefit is set to rise $38 per month to $1,386, which implies an improvement of $456 in total benefits for 2019. (1)

Lastly, it should be noted that some disabled workers also receive Social Security benefits. Payments to their households will also grow larger next year. Right now, the average disabled worker enrolled in Social Security gets $1,200 per month in benefits. That will rise to $1,234 per month in 2019. The increase for the year will be $408. (1)


Justin D. Rucci, CFP®
Wealth Advisor
Warren Street Wealth Advisors

Justin is an Investment Advisor Representative of Warren Street Wealth Advisors, a Registered Investment Advisor. The information contained herein does not involve the rendering of personalized investment advice but is limited to the dissemination of general information. A professional advisor should be consulted before implementing any of the strategies or options presented.

This material was prepared by MarketingPro, Inc., and does not necessarily represent the views of the presenting party, nor their affiliates. This information has been derived from sources believed to be accurate. Please note – investing involves risk, and past performance is no guarantee of future results. The publisher is not engaged in rendering legal, accounting or other professional services. If assistance is needed, the reader is advised to engage the services of a competent professional. This information should not be construed as investment, tax or legal advice and may not be relied on for avoiding any Federal tax penalty. This is neither a solicitation nor recommendation to purchase or sell any investment or insurance product or service, and should not be relied upon as such. All indices are unmanaged and are not illustrative of any particular investment.

Any investments discussed carry unique risks and should be carefully considered and reviewed by you and your financial professional. Past performance may not be indicative of future results. All investment strategies have the potential for profit or loss. Changes in investment strategies, contributions or withdrawals may materially alter the performance, strategy, and results of your portfolio. Historical performance results for investment indexes and/or categories, generally do not reflect the deduction of transaction and/or custodial charges or the deduction of an investment-management fee, the incurrence of which would have the effect of decreasing historical performance results. Economic factors, market conditions, and investment strategies will affect the performance of any portfolio and there are no assurances that it will match or outperform any particular benchmark. Nothing in this commentary is a solicitation to buy, or sell, any securities, or an attempt to furnish personal investment advice. We may hold securities referenced in the blog and due to the static nature of the content, those securities held may change over time and trades may be contrary to outdated posts.


Citations
1 – fool.com/retirement/2018/10/26/heres-what-the-average-social-security-beneficiary.aspx [10/26/18]
2 – tinyurl.com/y9spspqe [8/31/18]

Market Commentary – October 2018

Market Commentary – October 2018

Another wicked October!

First, we had the Panic of 1907, then Black Tuesday in 1929 (and Thursday and Monday), and Black Monday in October 1987, but October 2018 was indeed a month for the record books. With a negative return of -6.94%, it was the third worst October since 1987, and the 19th worst month in over 30 years. (For the curious among you, October 1987 the S&P 500 lost -21.76%, the worst single month decline since January 1987. The second worst October was 2008 at -16.94%.)

Why does the market hate October?! (or is it the other way around?)

Source: https://ycharts.com and https://finance.yahoo.com. Author’s calculations

Some of the worst days in the stock market actually happened in September: the 9/11 attacks and 2008 financial meltdown, for example. More often than not October has been a transition month, representing a buying opportunity for long-term investors able to endure some turbulence in exchange for future profits.

But more on that later…

Here’s the question for this past October: If the economic data was strong, why was the stock market so bad?

  • Wage growth came in at $27.30 up from $26.47 in October 2017, an annual growth rate of 3.1%, the highest in 9 years
  • Unemployment is hovering at 3.7%
  • Inflation remains low, falling from a recent high of 2.8% in July to 2.3% in September

What’s not to like?

Market commentators have plenty of possible answers for why global stock markets dropped off a cliff in October: escalating talk of trade wars, possibility that central banks will increase interest rates too high and stall the global economic recovery, uncertainty about the outcome of the U.S. midterm elections, high stock valuations, political disruptions in Europe, and others.

Source: https://finance.yahoo.com

While all these are legitimate concerns, none of them were new to October. Why did investors react so strongly?

To better understand the U.S. market landscape, let’s take a minute to review where we’ve been so we have more perspective on where we might be going.

Recent Tailwinds

  • Strong U.S. economy and improving economies worldwide
  • Tax cuts and strong corporate profits
  • Low interest rates

Possible Headwinds

  • Global trade wars and a slowing Chinese economy
  • Democratic House of Representatives may push back business-friendly legislation
  • Ballooning government debt

So yes, there are things to worry about, but on balance, the worries don’t seem to warrant the precipitous drop in stock prices. Our best guess why October was so painful? The cause most likely lies with investor behavior, not fundamentals…


No matter what the reason for October’s fall, what really matters are the decisions we make now that the market has stabilized. Is it time to sell before the next shoe falls? Or buy and ride the rebound…assuming there is a rebound?

Each investor has to decide for themselves how much risk they can handle in pursuit of returns, but at Warren Street Wealth we’re holding on tight and buying into the weakness.

As outlined in a recent article in the Wall Street Journal¹:

  • U.S. equities are trading at the lowest P/E ratio of the year and corporate earnings are solid
    • S&P 500 is trading at 16 times forward earnings, near the long-term average
    • Risk premium is 4.6%, indicating 1.4% higher expected returns than the long-term average
    • Given the strong economy, the equity risk/reward tradeoff is fair
  • International markets look cheap relative to the U.S.
    • Despite current political challenges, economic foundations are stable and growing across much of the globe
    • European stocks are trading at 12 times forward earnings, significantly lower than the long-term average of 16 times
    • Emerging Market equities are trading at 11 times future earnings, compared to the long-term average of 13 times

All that being said, nobody likes to see negative numbers, investment professionals least of all.

As one of our clients told me the other day, “No matter the explanation, down is bad. The only thing that helps is up.” Our job at Warren Street Wealth Advisors is to honestly evaluate our investment decisions, make course corrections when needed, and hold the line otherwise. It’s been a rough market in the U.S. and even worse internationally, but the value is clearly there. We’re staying the course and watching for opportunities to buy into markets that have been beaten down unnecessarily. We don’t know how long it will take for these cheaper sectors to recover, but we want to be there when it happens. We hope you’ll be there with us.

Quiz Question:

Referring to the average monthly returns in the table, if you invested $1,000 in the S&P 500 when the market opened in January and earned the average monthly return compounded monthly, you would end the year with $1,090 or a 9% return.

Formula: $1,000 * (1 + .83%) * (1 + .38%) * … * (1 + 1.86%)

If you had an additional $1,000 to invest and knew what the future monthly returns would be, when should you buy more stocks to maximize your dollar-weighted return?

Rule of thumb: Buy low, Sell high

A. March and April   B. May and July  C. August and September  D. December


Marcia Clark, MBA, CFA
Senior Research Analyst
Warren Street Wealth Advisors

Warren Street Wealth Advisors, a Registered Investment Advisor. The information contained herein does not involve the rendering of personalized investment advice but is limited to the dissemination of general information. A professional advisor should be consulted before implementing any of the strategies or options presented. Any investments discussed carry unique risks and should be carefully considered and reviewed by you and your financial professional. Past performance may not be indicative of future results. All investment strategies have the potential for profit or loss. 

¹ https://www.wsj.com/articles/stock-market-bulls-re-emerge-after-bruising-selloff-1541768401

Taking a Loan from Your Retirement Plan = Bad Idea

Taking a Loan from Your Retirement Plan = Bad Idea

Why you should refrain from making this move.

Thinking about borrowing money from your 401(k), 403(b), or 457 account? Think twice about that because these loans are not only risky but injurious to your retirement planning.

A loan of this kind damages your retirement savings prospects. A 401(k), 403(b), or 457 should never be viewed like a savings or checking account. When you withdraw from a bank account, you pull out cash. When you take a loan from your workplace retirement plan, you sell shares of your investments to generate cash. You buy back investment shares as you repay the loan. (1)

In borrowing from a 401(k), 403(b), or 457, you siphon down invested retirement assets, leaving a smaller account balance that experiences a smaller degree of compounding. In repaying the loan, you will likely repurchase investment shares at higher prices than in the past – in other words, you will be buying high. None of this makes financial sense. (1)

Most plan providers charge an origination fee for a loan (it can be in the neighborhood of $100), and of course, they charge interest. While you will repay interest and the principal as you repay the loan, that interest still represents money that could have remained in the account and remained invested. (1,2)

As you strive to repay the loan amount, there may be a financial side effect. You may end up reducing or suspending your regular per-paycheck contributions to the plan. Some plans may even bar you from making plan contributions for several months after the loan is taken. (3,4)

Your take-home pay may be docked. Most loans from 401(k), 403(b), and 457 plans are repaid incrementally – the plan subtracts X dollars from your paycheck, month after month, until the amount borrowed is fully restored. (1)

If you leave your job, you will have to pay 100% of your 401(k) loan back. This applies if you quit; it applies if you are laid off or fired. Formerly, you had a maximum of 60 days to repay a workplace retirement plan loan. The Tax Cuts & Jobs Act of 2017 changed that for loans originated in 2018 and years forward. You now have until October of the year following the year you leave your job to repay the loan (the deadline is the due date of your federal taxes plus a 6-month extension, which usually means October 15). You also have a choice: you can either restore the funds to your workplace retirement plan or transfer them to either an IRA or a workplace retirement plan elsewhere. (2)

If you are younger than age 59½ and fail to pay the full amount of the loan back, the I.R.S. will characterize any amount not repaid as a premature distribution from a retirement plan – taxable income that is also subject to an early withdrawal penalty. (3)

Even if you have great job security, the loan will probably have to be repaid in full within five years. Most workplace retirement plans set such terms. If the terms are not met, then the unpaid balance becomes a taxable distribution with possible penalties (assuming you are younger than 59½. (1)

Would you like to be taxed twice? When you borrow from an employee retirement plan, you invite that prospect. You will be repaying your loan with after-tax dollars, and those dollars will be taxed again when you make a qualified withdrawal of them in the future (unless your plan offers you a Roth option). (3,4)

Why go into debt to pay off debt? If you borrow from your retirement plan, you will be assuming one debt to pay off another. It is better to go to a reputable lender for a personal loan; borrowing cash has fewer potential drawbacks.   

You should never confuse your retirement plan with a bank account. Some employees seem to do just that. Fidelity Investments says that 20.8% of its 401(k) plan participants have outstanding loans in 2018. In taking their loans, they are opening the door to the possibility of having less money saved when they retire. (4)

Why risk that? Look elsewhere for money in a crisis. Borrow from your employer-sponsored retirement plan only as a last resort.


Justin D. Rucci, CFP®
Wealth Advisor
Warren Street Wealth Advisors

Justin is an Investment Advisor Representative of Warren Street Wealth Advisors, a Registered Investment Advisor. The information contained herein does not involve the rendering of personalized investment advice but is limited to the dissemination of general information. A professional advisor should be consulted before implementing any of the strategies or options presented.

This material was prepared by MarketingPro, Inc., and does not necessarily represent the views of the presenting party, nor their affiliates. This information has been derived from sources believed to be accurate. Please note – investing involves risk, and past performance is no guarantee of future results. The publisher is not engaged in rendering legal, accounting or other professional services. If assistance is needed, the reader is advised to engage the services of a competent professional. This information should not be construed as investment, tax or legal advice and may not be relied on for avoiding any Federal tax penalty. This is neither a solicitation nor recommendation to purchase or sell any investment or insurance product or service, and should not be relied upon as such. All indices are unmanaged and are not illustrative of any particular investment.

Any investments discussed carry unique risks and should be carefully considered and reviewed by you and your financial professional. Past performance may not be indicative of future results. All investment strategies have the potential for profit or loss. Changes in investment strategies, contributions or withdrawals may materially alter the performance, strategy, and results of your portfolio. Historical performance results for investment indexes and/or categories, generally do not reflect the deduction of transaction and/or custodial charges or the deduction of an investment-management fee, the incurrence of which would have the effect of decreasing historical performance results. Economic factors, market conditions, and investment strategies will affect the performance of any portfolio and there are no assurances that it will match or outperform any particular benchmark. Nothing in this commentary is a solicitation to buy, or sell, any securities, or an attempt to furnish personal investment advice. We may hold securities referenced in the blog and due to the static nature of the content, those securities held may change over time and trades may be contrary to outdated posts.


Citations
1 – gobankingrates.com/retirement/401k/borrowing-401k/ [10/7/17]
2 – forbes.com/sites/ashleaebeling/2018/01/16/new-tax-law-liberalizes-401k-loan-repayment-rules/ [1/16/18]
3 – cbsnews.com/news/when-is-it-ok-to-withdraw-or-borrow-from-your-retirement-savings/ [1/31/17]
4 – cnbc.com/2018/06/26/the-lure-of-a-401k-loan-could-mask-its-risks.html [6/26/18]

Word on the Street – A Conversation with Marcia Clark, CFA, MBA

Word on the Street – A Conversation with Marcia Clark, CFA, MBA

A sit down with our Senior Research Analyst to discuss the US market, international markets, and how we are approaching both for investors.

For this Word on the Street, I sat down with Marcia Clark to discuss a recent report that stated leading economic indicators in the US are positive. Marcia and I discussed what this report means for investors and how it relates to our stance at Warren Street.

Enjoy.

Yesterday (October 18th), Blake shared a report that talked about long-term economic indicators looking good in the US. However, we have heard a lot from Blake on investing overseas in international and emerging markets. If the US looks so good, then why are we doing this?

M.C.: Even though indicators [in the US] are strong right now, we are still in an established economy, and it’s not possible for a huge economy like ours to grow as quickly as a smaller and more dynamic one. Smaller economies tend to grow faster than developed economies because they have to build out infrastructure to support new businesses. This infrastructure improves productivity which in turn drives economic growth. Since 2000, emerging economies have grown about twice as fast as developed economies.

How long will this period of US strength continue, and how long will we have to wait for emerging markets to have another boom?

M.C.: The US is currently experiencing one of the longest expansions in our history. While we’re grateful for the stable growth, we know this can’t go on forever. It’s extremely difficult to know when the end is coming or how bad it’s going to be, so what do we do? We hope for the best but prepare for the worst. To make an analogy – most of us don’t expect a house fire, but we still carry insurance. In the investment business, it’s wise to look over all markets to find the best opportunities and spread out the economic risk. 

When we spoke about the report that Blake shared, you said, “when the US gets sick, the world sneezes.” If the US is not sick at the moment, why does the rest of the world seem to be dragging this year?

M.C.: When we say the US isn’t sick, how are we measuring that? Most people look at the S&P 500 and say the US is doing great compared to global averages, but if we take out the huge technology companies such as Google, Amazon, and Netflix, the US market isn’t that much further ahead. Many other countries experienced a “Great Recession” fallout in 2008-2009 far worse than the US, leaving them behind the US on the economic recovery timeline, particularly in regards to unemployment. Add to that the continuing struggle of European countries to integrate thousands of refugees from wars and conflicts in the Middle East and you can see why Europe and its neighbors are having a tougher time than the US.

Some people say that emerging markets are not a great value right now. If that is true, then why are we continuing to add to our position with them?

M.C.  The US is largely insulated from many global challenges, but at the same time, the US is so well developed that there aren’t a ton of market-changing innovation opportunities here either. So, we look overseas. The first thing to understand about emerging market economies is that they are not a homogenous group. For example, you wouldn’t compare emerging economies in peripheral Europe to those in Africa or South America. When we look to add exposure in a diverse sector like EM, we investigate active asset managers with a track record of identifying the best risk-reward trade-off in that broad landscape.

So what you are saying is, when we talk about adding emerging market exposure, we are not getting all of the emerging market economies. What does Warren Street look at for their emerging market exposure?

M.C.: We aren’t investing directly in these countries, so we don’t have a country-by-country economic forecast. However, the fund managers we use do this full-time. Some even send members of their investment teams to these emerging countries to understand the political landscape, the sentiment of the population, and the vibrancy of the economy. Our job is to vet these managers thoroughly, check their track record across different economic cycles, and review their current country allocation against our thoughts on world conditions. From there, we then choose the best manager for the job.

Taking a step back to a previous question, what happens when the US does finally get sick? What happens to world economies in that landscape? Similar to your quote, I have heard “when the US gets sick, the world gets the flu.”

M.C.: It is true that the US impact on other countries is stronger than their impact on us, but the US economy is fairly insulated because we buy and sell so much within our own borders. In times when the US is struggling, other nations step up their trading with each other and muddle through until the US economy bounces back. As we talked about earlier, there are plenty of differences between the economic environment in the US and elsewhere – developed countries have done better than us plenty of times in the past. Remember that less developed countries are even less correlated with the US than developed nations. So when the US is sick, oftentimes the best place to look is smaller nations that are building their own economies in their own regions.

Taking a look back at the US economy, if the outlook is good, then why don’t we add more to the US stock market?

M.C.: Our job at Warren Street Wealth is to keep you safe and help you grow your assets. Even the most successful investors don’t have a crystal ball. They don’t get it right every time, so diversification is the only “free lunch” – we would be foolish not to take advantage of it.

The US is only about 40% of the world market. If we only invested in the US, we are closing ourselves off to an additional 60% of opportunities available to us. That just seems silly. Good stuff is happening all around the world, so let’s reach out and find it.

What do you say to the investor that only believes in the US stock market?

M.C.: For investors with a very long time horizon without the need to draw on their funds unexpectedly, the US stock market might be your only investment. But most of us don’t have the luxury of leaving our money in the market for 40 years and weathering all the storms that come our way. As fiduciaries of your assets, we have an obligation to protect your assets and help you achieve your long-term financial goals. We may not capture 100% of the upside, but we are confident that we are going to keep you from experiencing 100% of the bad times.

Anything else you would like to share?

M.C.: The world is a very big place, and sometimes we don’t know what exciting things are happening on the opposite side of the planet. Being open-minded about where you send your capital could unlock amazing things in other places.

Lastly, there is a fantastic set of information on the global economy that can be found at the IMF’s website: Real GDP by Country


Cary Warren Facer
Founding Partner
Warren Street Wealth Advisors

Warren Street Wealth Advisors, a Registered Investment Advisor. The information contained herein does not involve the rendering of personalized investment advice but is limited to the dissemination of general information. A professional advisor should be consulted before implementing any of the strategies or options presented. Any investments discussed carry unique risks and should be carefully considered and reviewed by you and your financial professional. Past performance may not be indicative of future results. All investment strategies have the potential for profit or loss.