August market commentary

In an uncertain market environment, which is better?

The U.S. stock market feasts on recession fears before regaining its risk appetite in late August

Key Takeaways

  • President Trump added, then delayed, another tariff on Chinese goods, exacerbating trade tensions and concerns about the strength of the global economy. As talks with China resume, Britain’s new prime minister attempts to achieve a ‘hard Brexit’, and the Eurozone PMI index falls into contraction territory.
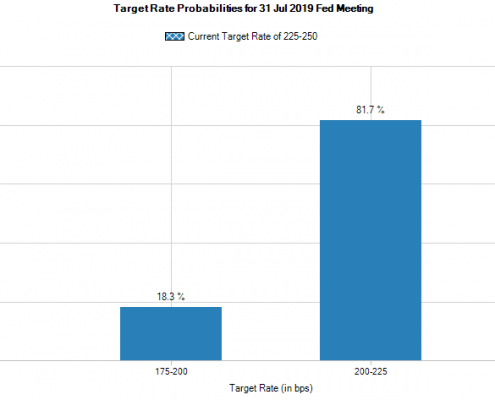
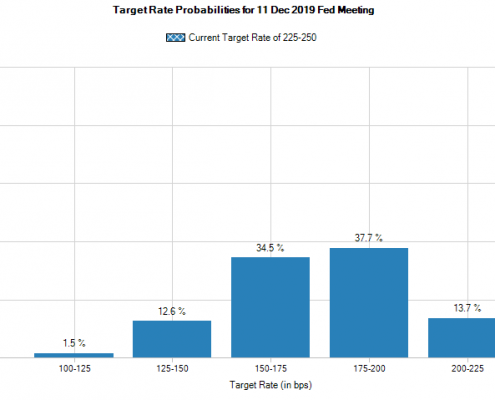
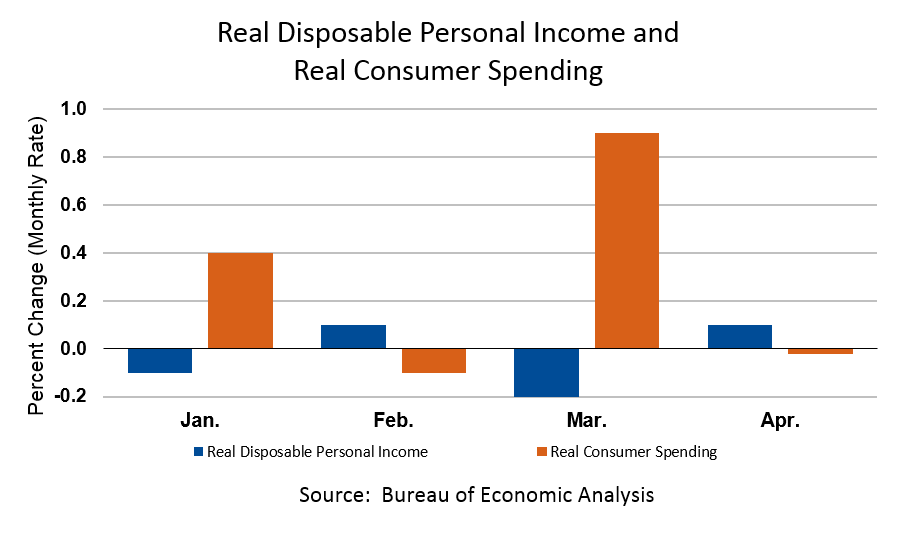
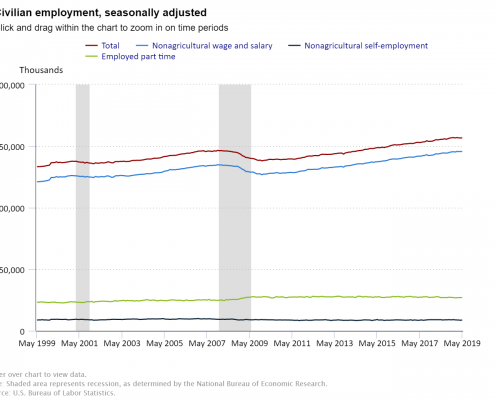
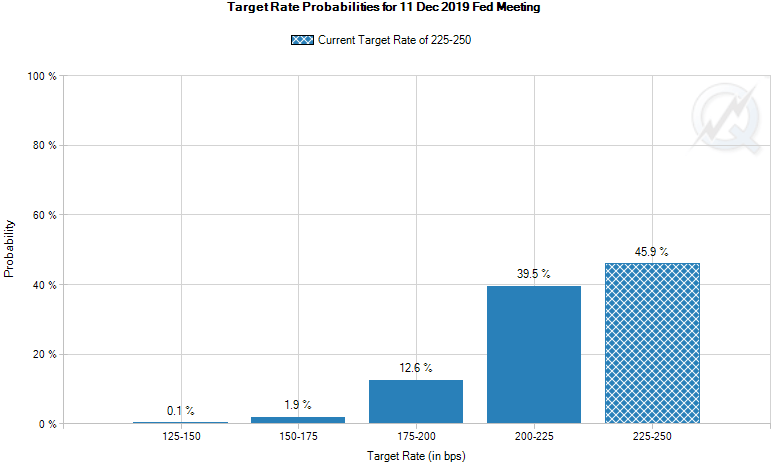
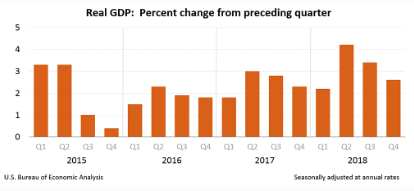
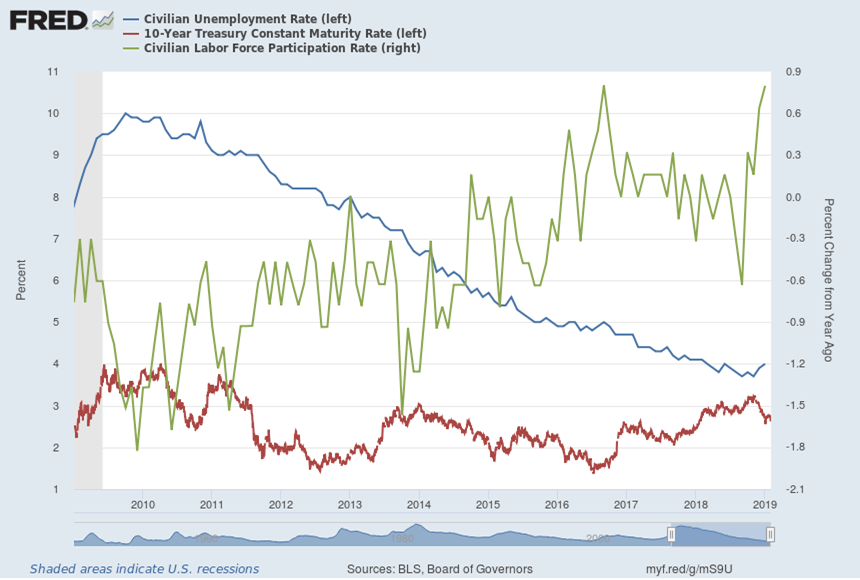
  • The U.S. economic menu included something for everyone: for the pessimist, softer than expected gain in overall jobs with only 130,000 payroll growth in August. For the optimist, the broader measure of civilian employment surged by 590,000. Manufacturing remains a worry as contraction in that sector continues. Despite the generally stable U.S. economy, the Fed cut rates by -0.25% in July and is expected to cut again in September.
  • Conclusion: Tariffs and political uncertainty are depressing an already delicate global appetite for risk. The U.S. is buffered by its large domestic market and expanding trade with alternative suppliers, but isn’t immune to a global slowdown. Lower interest rates may provide a brief energy boost, but won’t develop core strength in business investment. With no political solution in sight, prudent investors should diversify exposure to provide a steady diet of modest returns while avoiding the binge/purge cycle of ‘chasing yield’.

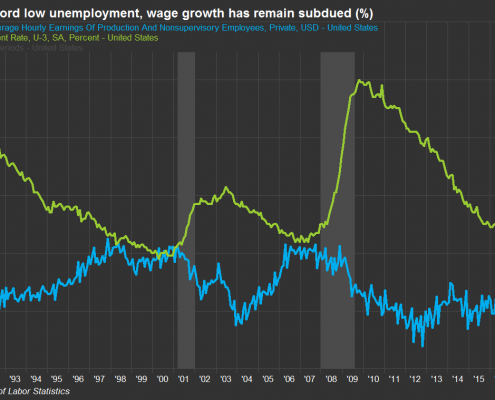
Stocks are near record levels, but investors are uneasy

4Q2019 repeats 4Q2018?

As reported in the Wall Street Journal on September 9, despite a buoyant stock market so far this month, some investors fear the market may repeat the ‘binge and purge’ cycle experienced in 2018.

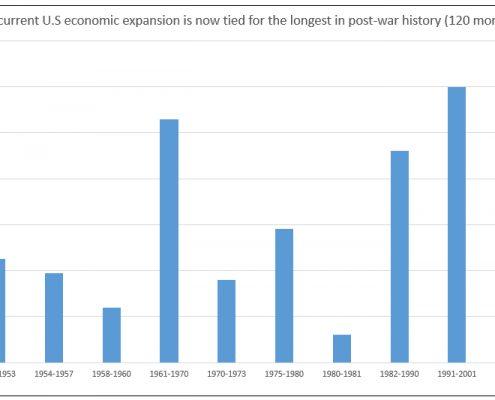
Looking as far back as 1928, September is historically the worst month of the year.[1] Given that most of the tensions which led to the market tumble last year are still present – trade tensions, global manufacturing slowdown, falling growth of corporate profits, and political uncertainty at home and abroad – concern may be warranted. Combine these headwinds with diminishing marginal returns from accommodative monetary policy, and we might finally be nearing the end of the longest economic expansion in recent memory. Not that we’re calling for a recession! Just that the growth engines of the global economy are beginning to run out of fuel.

[1] https://www.wsj.com/articles/stocks-are-back-near-records-but-memories-of-2018-leave-investors-uneasy-11568021402

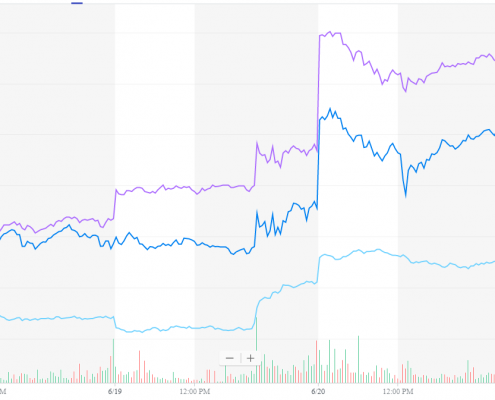
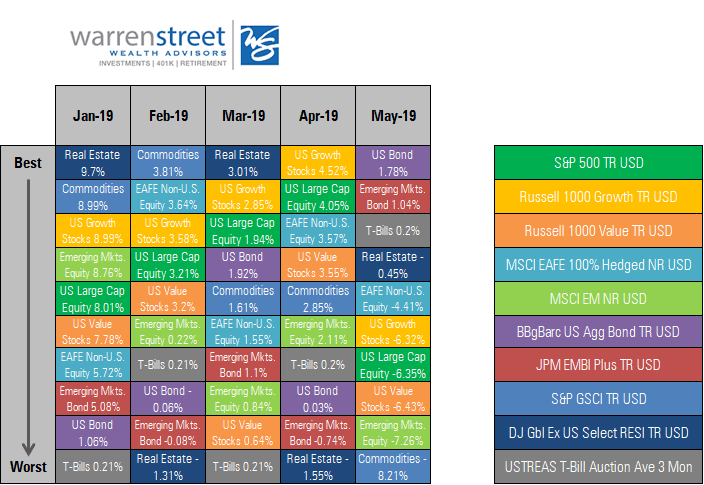
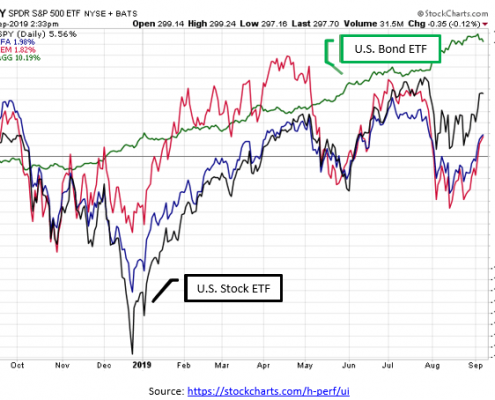
Bonds have been a dietary staple during stock market volatility in recent quarters.

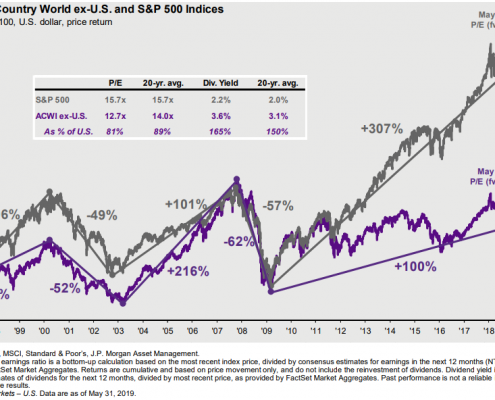
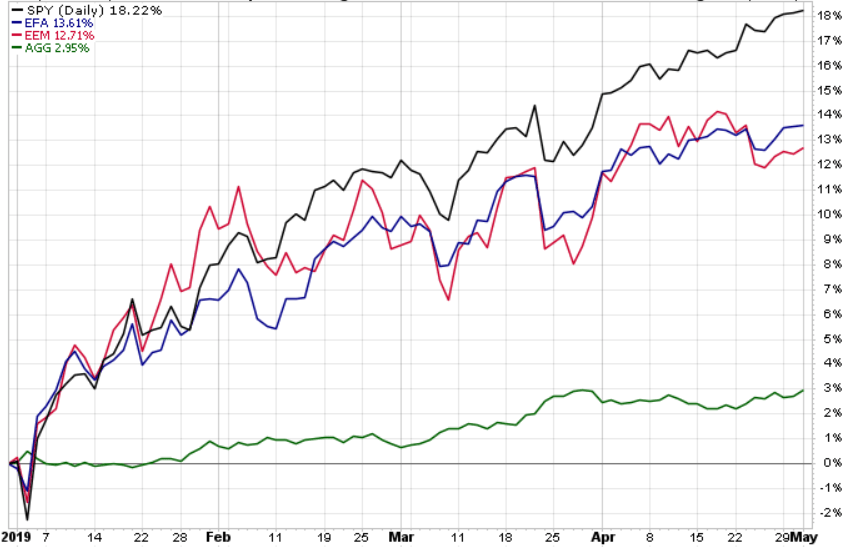
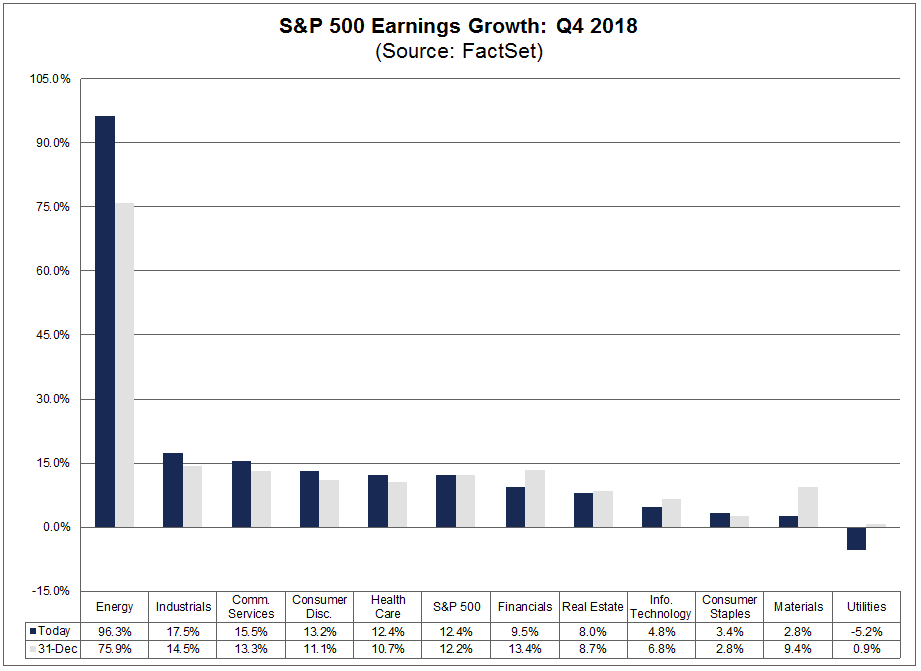
Despite the S&P 500 posting a year-to-date return of nearly 20% as of August 31st, bonds have actually outpaced stocks for the trailing 12-months. The severe tumble of the stock market in late 2018 and again in late July/early August gobbled up more losses than the 2019 recovery has been able to replenish. This despite continuing strength in the U.S. economy and corporate earnings generally surprising on the upside of – admittedly cautious – analyst expectations.

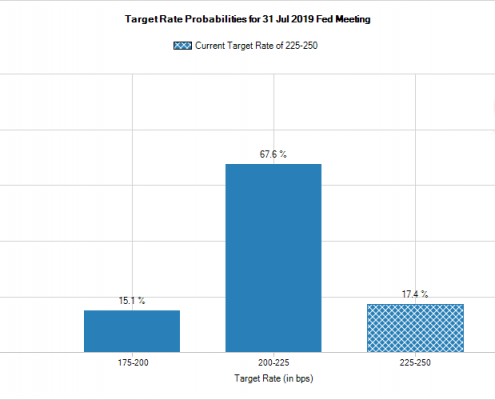
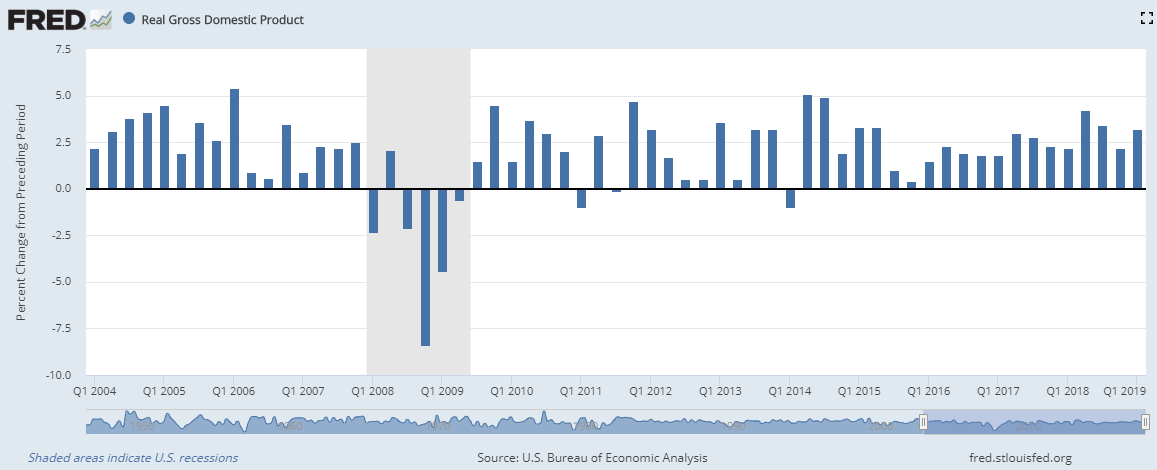
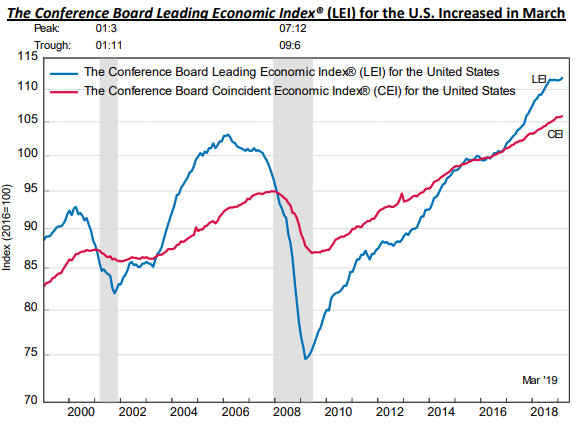
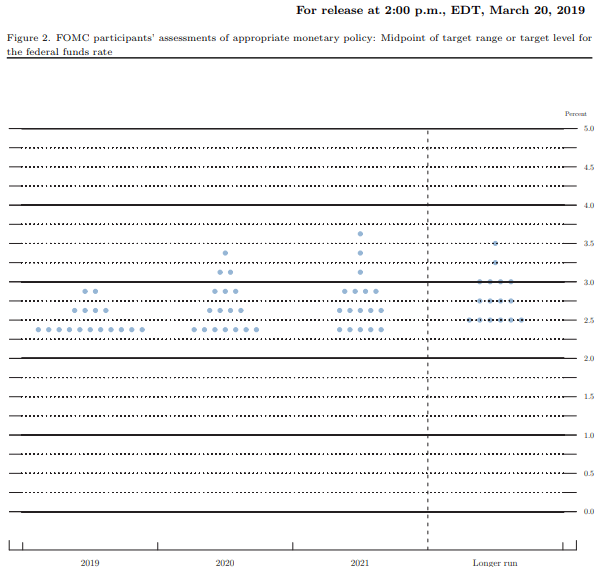
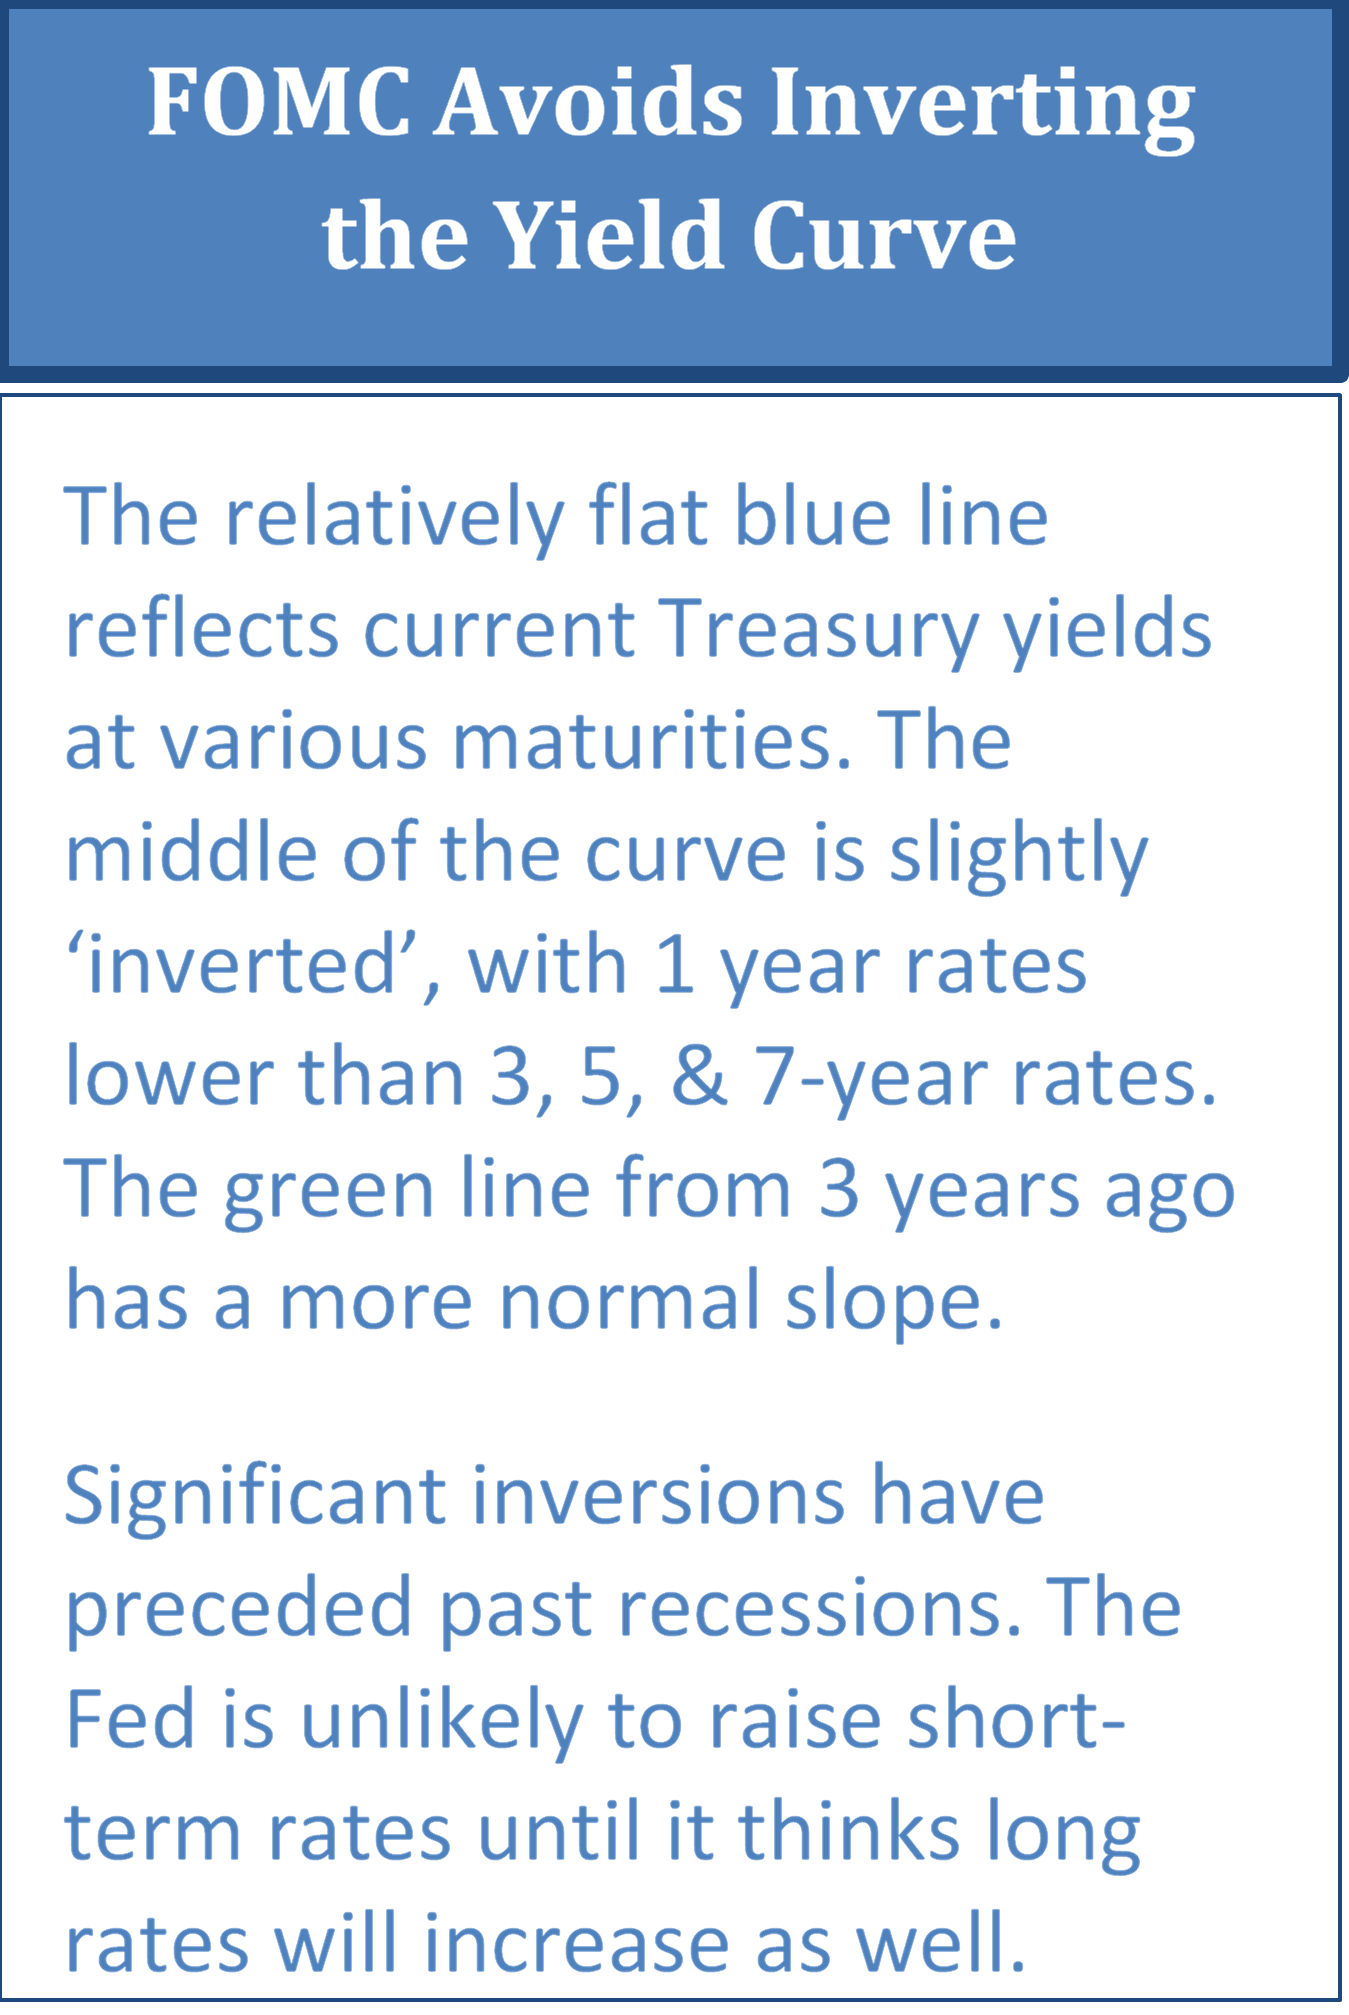
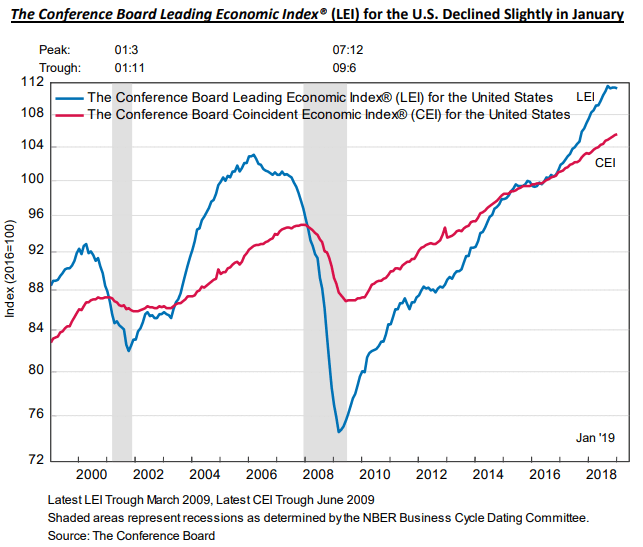
The Fed’s rate cut at the end of July sparked an increase in recession fears, though economic data remains modestly positive.

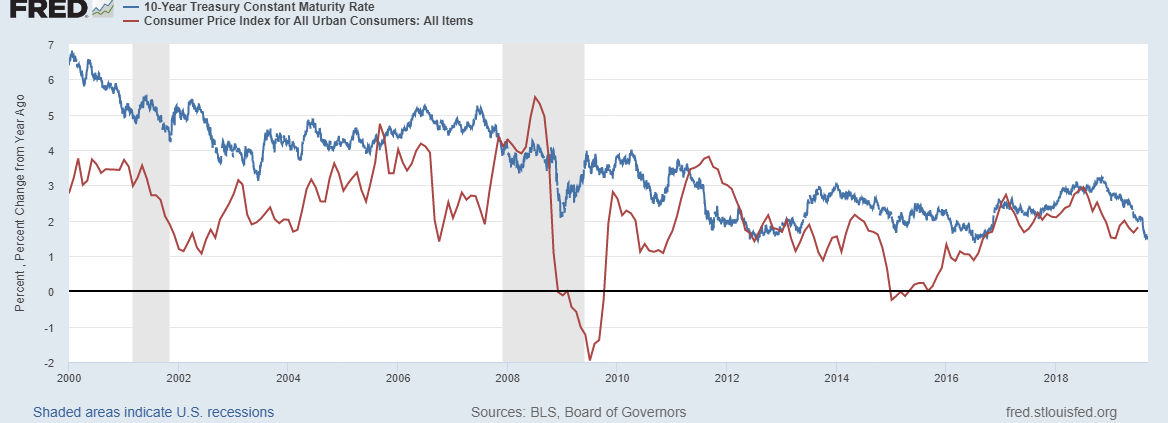
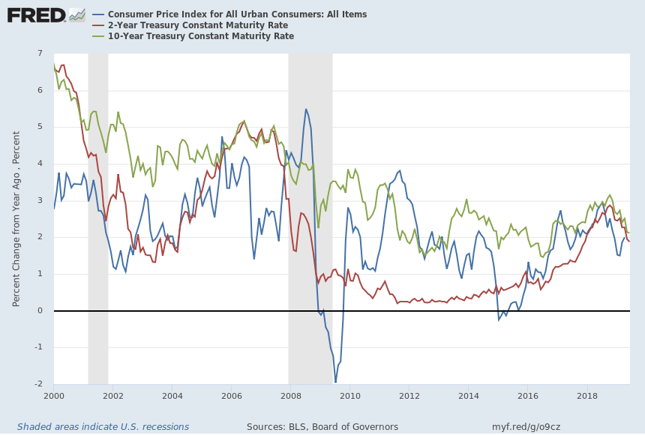
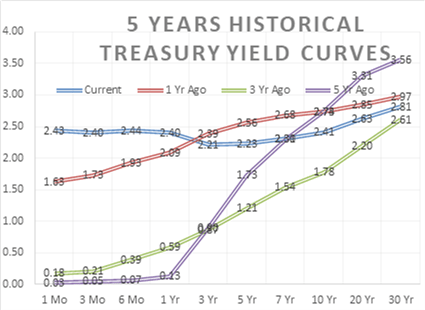
10-year Treasury yield barely above inflation

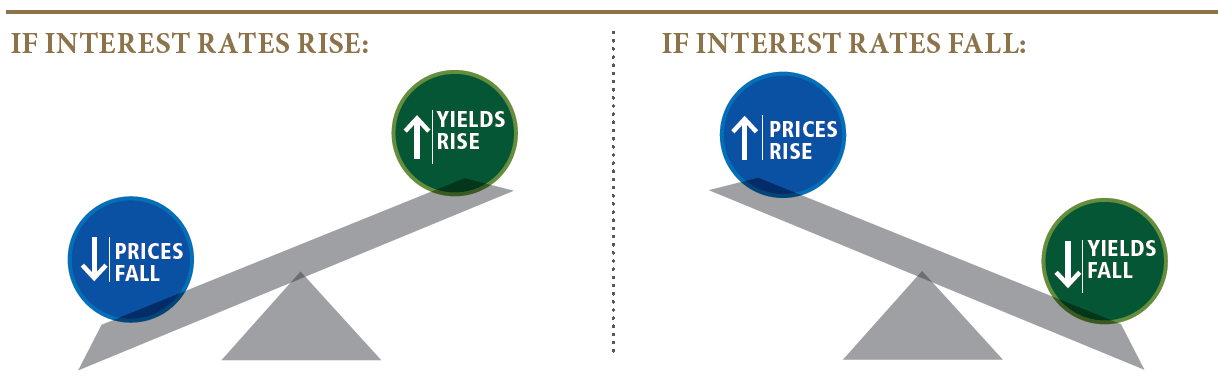
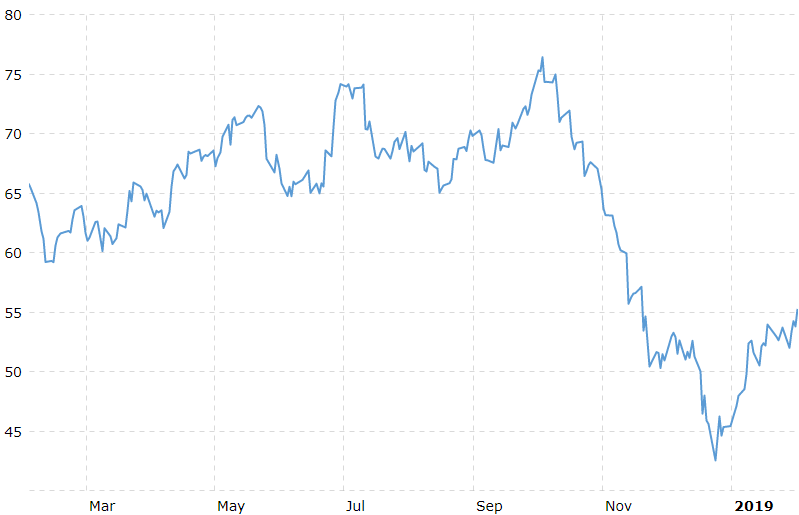
Decreasing short-term interest rates are unlikely to spark business appetites for borrowing or lending. While 2% short-term rates are great for speculators, they aren’t that much more enticing than 2.25% or 2.50% interest rates for strategic business investments. In fact, 10-year Treasury bond yields dropped so low in September that they provided no more than 0.25% returns above inflation. While marginal borrowers may consume more debt at these rates, long-term investors will need to look beyond the safest assets for a risk/reward balance that preserves purchasing power while promoting healthy growth.

Manufacturing businesses suffer from a restrictive diet of trade tariffs and global uncertainty.

While the U.S. economy overall remains on solid footing, trade-related businesses are hungry.

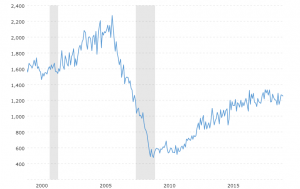
Housing starts stabilize

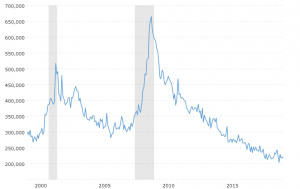
Jobless claims remain low

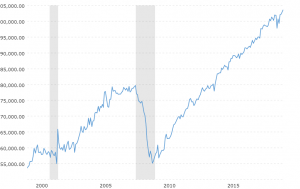
Retail sales rebound

Housing starts are stable, retail sales have rebounded, and initial claims for unemployment are the lowest in more than a decade…


…but U.S. manufacturers are in desperate need of an economic shot of Red Bull.

Rising global trade tensions in the wake of U.S. tariffs on steel, aluminum, and lumber imports, as well as those targeted specifically at China, are directly impacting manufacturing activity. According to the National Association for Business Economics (NABE)[1], 76% of goods-producing sector panelists and 42% of TUIC (transportation, utilities, information, communications) panelists reported negative net tariff impacts at their companies.

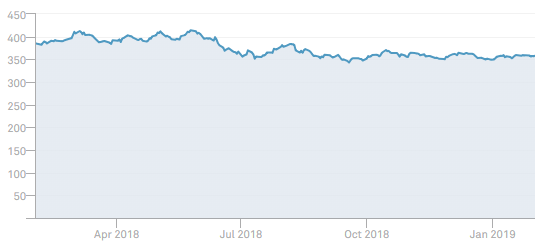
This impact is illustrated by the significant drop in durable goods orders over the past year or so.

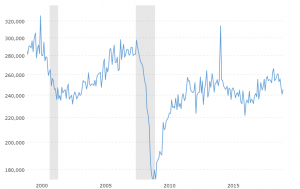
Durable goods orders fall sharply

[2] https://nabe.com/NABE/Surveys/Business_Conditions_Surveys/July_2019_Business_Conditions_Survey_Summary.aspx

[Preceding charts source www.macrotrends.net]

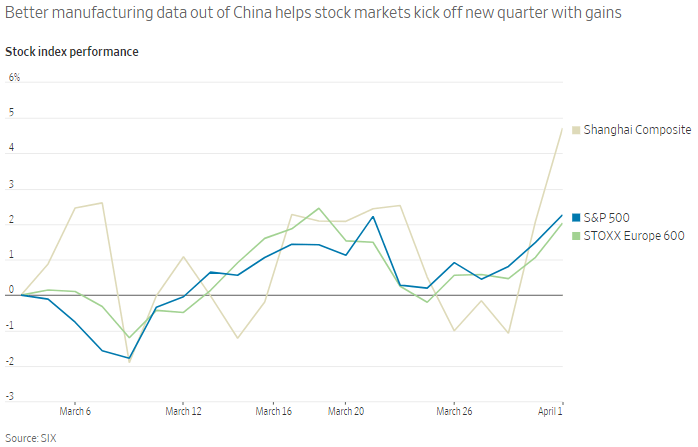
Increasing tariffs are not just eating the lunch of U.S. manufacturing companies. Global exporters are suffering greatly from decreased trade around the world. If we look back at the recovery from the Great Recession, emerging economies such as China are credited with helping the developed world get back on its feet. China in particular built roads, airports, and housing developments with abandon, which boosted earnings for global manufacturing companies, particularly steel and machinery.

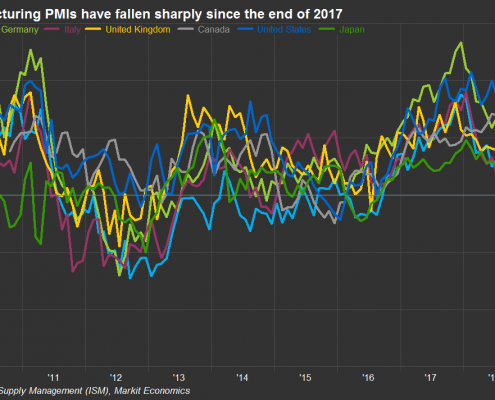
But the Chinese economy has had its fill of infrastructure spending, reducing its appetite for imported goods going forward. Combined with the trade war between China and the U.S., exporters have lost a major customer. Eurozone manufacturers have already fallen into ‘contraction’ territory (PMI below 50), and the rest of the world isn’t much better.[3] And Fed Chairman Powell, if you’re listening, lower interest rates won’t have any effect on this trend! No matter how low rates go, businesses won’t go back to the buffet table when demand for their products is already satisfied.

[3] https://www.wsj.com/articles/chinas-power-to-boost-global-economy-is-fading-11564738205?mod=article_inline

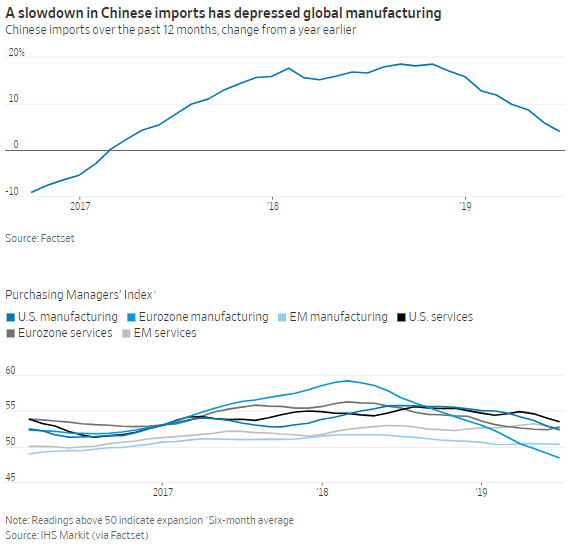
Slowdown in China depresses global manufacturing

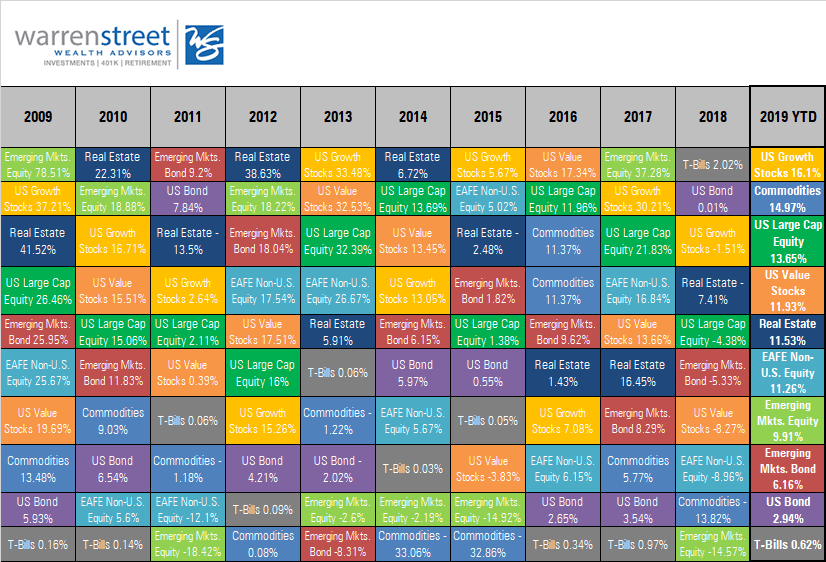
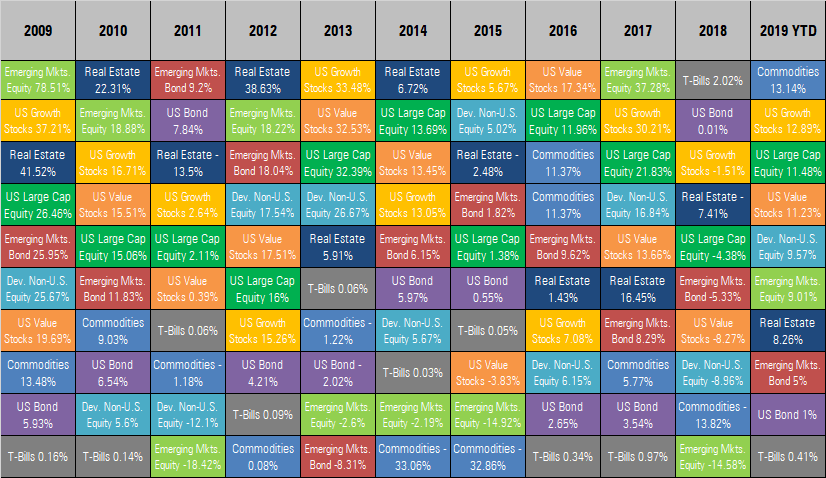
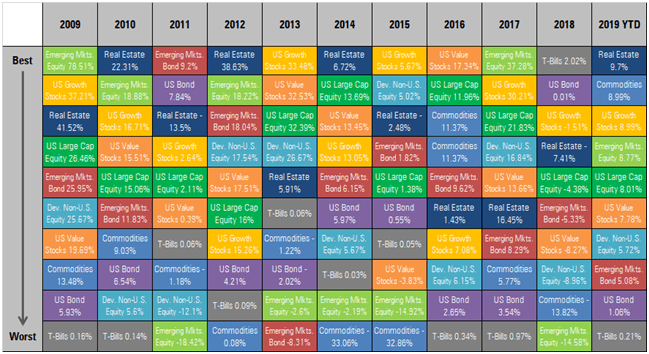
In an uncertain global economic environment with a reactionary U.S. stock market, diversification is even more important.

Barring major disruptions in trade negotiations, a disorderly ‘Brexit’, or increases in geopolitical unrest, the U.S. stock and bond markets could continue on their upward path for the rest of the year.

That being said, the chance of one of these elements going wrong is significant. Investors should continue to make healthy investment decisions to navigate this uncertain period. The best way to do this is to diversify.

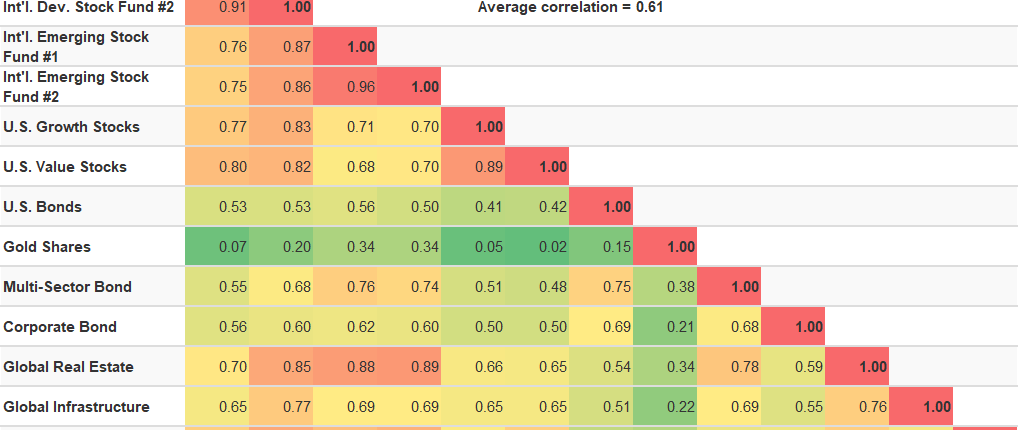
Source: www.portfoliovizualizer.com

A balanced menu of stocks, bonds, and alternative asset classes such as natural resources can provide welcome reduction in volatility while still supporting the pursuit of gains suitable for most investors’ appetites. Which isn’t to say even the most well-diversified investors won’t experience some indigestion along the way! But putting your investment eggs in several market baskets can avoid catastrophic losses and help you achieve a healthy balance of risk and return over the long term.

Marcia Clark, CFA, MBA

Senior Research Analyst, Warren Street Wealth Advisors


DISCLOSURES

Investment Advisor Representative, Warren Street Wealth Advisors, LLC., a Registered Investment Advisor

The information presented here represents opinions and is not meant as personal or actionable advice to any individual, corporation, or other entity. Any investments discussed carry unique risks and should be carefully considered and reviewed by you and your financial professional. Nothing in this document is a solicitation to buy or sell any securities, or an attempt to furnish personal investment advice. Warren Street Wealth Advisors may own securities referenced in this document. Due to the static nature of content, securities held may change over time and current trades may be contrary to outdated publications.

Form ADV available upon request 714-876-6200

Did the Fed make a mistake? – “A Few Minutes with Marcia”

Welcome back to A Few Minutes with Marcia. My name is Marcia Clark, senior research analyst at Warren Street Wealth Advisors.

Today we’re going to spend a few minutes considering the pros and cons of the Federal Reserve Open Market Committee holding short-term interest rates steady at its June meeting. Most of my comments today are based on the FOMC announcement published on June 19, the press conference with Chairman Jerome Powell shortly thereafter, and remarks by Federal Reserve Governor Lael Brainard on June 21st.

Watch:


On June 19, the Federal Reserve Open Market Committee announced its decision to keep short-term interest rates unchanged at 2.25%-2.5%. Did they make a mistake?

To answer this question, let’s put ourselves in the shoes of the Fed and attempt to base our opinion on the available data. The Fed should reduce rates if they see the economy struggling. Is that what they see?

During a speech in Cincinnati on June 21st, Fed Governor Lael Brainard stated his assessment that the most likely path for the economy remains solid. He noted strength in consumer spending and consumer confidence, as well as unemployment at a 50-year low.

He did note a few areas of concern: cautious business investment due to policy uncertainty, slow growth overseas, and muted inflation.

  • Mr. Brainard said: “The downside risks, if they materialize, could weigh on economic activity. Basic principles of risk management in a low neutral rate environment with compressed conventional policy space would argue for softening the expected path of policy when risks shift to the downside.” But what does he mean by ‘compressed conventional policy space’?

The Fed has limited room to maneuver because interest rates are already low, and inflation and employment have not responded to changes in interest rates as predictably as they have in the past. 

  • On the plus side, this means the labor market can strengthen a lot without an acceleration in inflation
  • On the other hand, this low sensitivity along with already low interest rates gives the Fed less ability to buffer the economy in a downturn


If the Fed doesn’t get their interest rate call right, the economy could begin to spiral too far up or too far down.

Let’s take a deeper look at why low interest rates present a challenge for the Fed.

  • In the past, the Federal Reserve has cut interest rates 4 to 5 percentage points in order to combat past recessions
  • The chart on slide 6 shows the current Fed Funds rate sitting at less than half where it was before the last two recessions. 
  • Clearly there is less room to run if a recession hits


The chart also shows GDP beginning to stabilize at the end of 2016. With GDP on a more steady path, back in 2017 the Fed started raising short-term interest rates toward a more normal level in order to have some ‘dry powder’ for the next recession.

How did we get to this delicate balance point?

In December 2018, the Fed said more rate hikes were appropriate given the strengthening economy. The stock market reacted badly as at the same time trade talks with China were going nowhere and portions of the Treasury yield curve were inverted. Recession fears were on everyone’s mind.

In March 2019, Federal Reserve officials reassure markets that they will be “patient” with increasing short-term interest rates. To quote the FOMC statement after the March meeting: “the case for raising rates has weakened…” Notice that they didn’t say the case for cutting rates has strengthened.

And in June, the FOMC held interest rates steady and stated that the current level of interest rates is consistent with its mission to promote full employment and price stability. In its post-meeting statement, the committee said that the timing and size of future adjustments will be based on economic conditions relative to these two objectives. 

After the announcement, both stocks and bonds reacted positively to the decision, with the stock market indexes touching new highs before falling back a bit at the end of the week. 

Commentators speculated that the markets reacted well because a rate cut could be imminent. Equally likely, however, is that the markets reacted to the lack of a rate hike and prospects that a recession is not around the corner. 

During a press conference after the announcement, Fed chairman Jerome Powell responded to a question by saying that being independent of political pressure or market sentiment has served the country well and would do so in the future. He stated that the FOMC will react to data and trends that are sustainable rather than individual data points that can be volatile

But despite all the evidence, as we approach the end of June an astonishing 100% of futures investors are betting on a rate cut in July. These investors are wrong. 

Why am I so sure they won’t cut rates when commentators and the futures market clearly think differently?

You may have heard the expression ‘pushing on a string’. What this means is that applying force to something with no rigidity won’t have any impact – the string absorbs the force and the force doesn’t go any further. This is the current situation with monetary policy.

Imagine pushing a sofa across your carpeted living room versus pushing a mattress across the same room.

Once the feet of the sofa get out of the dent they made in the carpet, the sofa will move fairly easily. That’s because the sofa is rigid – when you apply force at one end, the sofa moves away from the force.

But a mattress is much more resistant to shifting. That’s because much of the force you apply is absorbed by the cushioning already in the mattress. The mattress will often bend before it will move. The force doesn’t go anywhere or accomplish anything.

The current U.S. economy is like the mattress in this example. The U.S. economy has plenty of available capital and interest rates are already low. Reducing the Fed Funds target from 2.375% to 2.00% is unlikely to accomplish much other than encouraging unwise borrowing and ultimately sparking inflation.

Yes, bad things can happen to our economy and the Fed needs to guard against a recession. But a recession overseas is much more likely than in the U.S., and no U.S. recession has ever been caused by a recession overseas. Dropping interest rates to ease market concerns or satisfy political sentiment is not the Fed’s mandate and would be counterproductive.

Barring some catastrophic political event or natural disaster, the U.S. economy is unlikely to falter between now and mid-July. 

Recognizing the Fed’s dual mandate of stable prices and full employment are both being met at the current level of short-term interest rates, right now the downside risk of lowering rates outweighs the potential stimulus benefit. The FOMC should keep the Fed Funds rate steady when they meet in July.

This has been ‘A Few Minutes with Marcia’. I hope you are a bit clearer on how to assess the likelihood of Fed policy decisions going forward. As always, comments and questions are welcome!

Sources:


Marcia Clark, CFA, MBA
Senior Research Analyst
Warren Street Wealth Advisors

Warren Street Wealth Advisors, a Registered Investment Advisor. The information contained herein does not involve the rendering of personalized investment advice but is limited to the dissemination of general information. A professional advisor should be consulted before implementing any of the strategies or options presented. Any investments discussed carry unique risks and should be carefully considered and reviewed by you and your financial professional. Past performance may not be indicative of future results. All investment strategies have the potential for profit or loss. 


DISCLOSURES

Investment Advisor Representative, Warren Street Wealth Advisors, LLC., a Registered Investment Advisor

The information presented here represents opinions and is not meant as personal or actionable advice to any individual, corporation, or other entity. Any investments discussed carry unique risks and should be carefully considered and reviewed by you and your financial professional. Nothing in this document is a solicitation to buy or sell any securities, or an attempt to furnish personal investment advice. Warren Street Wealth Advisors may own securities referenced in this document. Due to the static nature of content, securities held may change over time and current trades may be contrary to outdated publications.

Form ADV available upon request 714-876-6200

The bulls are back! But for how long?

Key Takeaways

  • The U.S. economy just exceeded the record for the longest business cycle expansion since economists started recording expansions in the 1930s (120 months plus 1 day)
  • Global trade tensions are impacting manufacturing sectors all around the world; only the U.S. and France show continued expansion, with Germany falling the most
  • Despite these concerns, June 2019 was among the strongest months for the U.S. stock market since 1955, driven largely by the FOMC decision to keep interest rates low and expectations of moderating trade tensions between the U.S. and China
  • An astonishing 100% of futures markets participants expect the Fed to cut the Federal Funds rate between 0.25% and 0.50% in July. Conventional wisdom states that when 100% of market participants expect something, it’s time for rational investors to exit.
  • Conclusion: Forecasts for multiple cuts in the Federal Funds rate are overdone; investors should be prepared for the stock market to react badly if expected rate cuts don’t materialize in July.

When the FOMC announced they would not raise the Federal Funds rate in June, global stock markets cheered.

Despite continuing uncertainty about trade tariffs, the decision not to raise rates was a relief to investors. Stock prices in both Europe and the U.S. jumped immediately after the announcement and held their gains through the rest of the week. Treasury bond prices rallied as well, bringing the 10-year interest rate below 2% for the first time since November 2016.

Source: finance.yahoo.com

This enthusiasm may be warranted as the U.S. economy has reached the longest expansion since economists started recording expansions in the 1930s (120 months plus 1 day), edging past the expansion of 1991 to 2001.

But the markets seem a bit schizophrenic lately in their response to economic data.

Longest expansion since 1930s

After their meeting in mid-June, Federal Reserve officials indicated that monetary policy can remain accomodative because concerns about a weakening economy had increased.

Here is the schizophrenic part: If the economy is indeed slowing, shouldn’t the stock market be cautious since corporate profits are expected to slow? But despite a few bad days and weeks from time to time, the U.S. stock market has hit new highs in 2019. If the Fed becomes more confident about the economy and raises interest rates slightly, this should signal stronger future corporate profits and boost the stock market. But instead of cheers, the prospect of the Fed continuing to ‘normalize’ short-term interest rates has been met with stock market tumbles.

This fearful reaction might be based on historical precedents which are no longer relevant. Some past expansions were indeed derailed by the Fed increasing rates too much. But the last 3 recessions in the U.S. were not sparked by interest rate increases but by market excesses: the Dot Com boom and bust in 1999-2000 and the housing price bubble in 2007-2008 being prime examples.

To better gauge when and if the economic expansion has run its course, investors would be wise to worry less about the Federal Funds rate and more about asset values, business activity, and the strength of labor markets.

According to Dr. David Kelly, chief global strategist for J.P. Morgan Asset Management, the four key areas to watch in regard to ‘expansion killers’ are home building, business fixed investment, motor vehicle sales, and change in inventories.

Dr. David Kelly’s ‘expansion killers’

Recessions since the late 90s have been associated less with interest rates and more with booms and busts in at least one of these areas. Since none of these factors are in ‘boom’ territory, it’s difficult to imagine a ‘bust’ scenario around the corner. As Dr. Kelly said, it’s hard to hurt yourself when jumping out a basement window.

The only leading indicator sitting on the second floor – rather than the basement – is the level of U.S. stock prices relative to earnings. As reported by Ned Davis Research, S&P 500 valuations in June were higher than average, but not by much. Whether you look at current earnings or forward earnings projections, the stock market seems to be fairly valued.

U.S. stock market valuation seems fair

In any case, the Fed may have less ability to influence the economy than people think.

These days inflation seems more responsive to changes in global dynamics such as oil prices rather than domestic economic factors. Changing the Federal Funds rate isn’t likely to make much difference in the current economic environment.

Low wage growth keeps inflation under control

Despite record low unemployment, wage growth has remained subdued helping keep inflation low as participants have begun returning to the job market after being sidelined during the ‘Great Recession’ of 2008-2009.

Range-bound oil prices are also putting downward pressure on inflation. OPEC has been trying to limit oil production for 2 years now, with mixed results. Their goal is to balance excess supply with less demand given the slowing Chinese economy, tariffs, and other political concerns. Despite these efforts, oil supplies are plentiful and prices remain restrained.

U.S. oil production offsets OPEC cuts

Has the Fed done too much? Or perhaps too little? When looking at the Federal Funds rate from a historical perspective, the FOMC has been extraordinarily cautious in its pace of increasing interest rates. Fed governors could certainly make a mistake, but it seems like their slow and steady pace is a wise approach for the foreseeable future. There’s no urgent need to raise rates, and limited value in lowering rates.

FOMC has been cautious ‘normalizing’ interest rates

The primary risk to the global economy, particularly the manufacturing sector, isn’t interest rates but rather trade tensions. The U.S. and France are the only developed economies with manufacturing sectors still in expansion territory. Overseas, Germany’s manufacturing sector has fallen the most as much of its manufactured goods have traditionally been exported to the U.S. and other countries.

With most of the developed world struggling to stay in positive territory, global demand and supply dynamics are likely to keep U.S. inflation near or below the Fed’s 2% target indefinitely.

Global manufacturing feels the bite of tariffs

Despite the modestly positive economic landscape, an astonishing 100% of Eurodollar futures participants expect the Fed to cut the rates between 0.25% and 0.50% in July.

Since the Fed’s decision in June to keep interest rates the same, futures market participants began enthusiastically betting on not just one 0.25% cut, but two cuts in the Federal Funds rate when the FOMC meets in July. Conventional wisdom states that when 100% of market participants expect something, it’s time for rational investors to exit.

After the first flurry of press reports forecasting a rate cut in July, more Fed officials have been speaking publicly about their base case economic scenario being steady, not requiring a rate cut. In recent days futures markets have slowly begun migrating away from projecting two rate cuts in July to only one, but even one cut isn’t justified by the data…at least not yet.

Futures expectations for July rate cuts

If we look forward to the end of the year, according to the CME Group ‘Countdown to FOMC’ as of July 1st over 13% of futures market participants think the Fed Funds rate will end the year between 2% and 2.25% (0.25% below the current level); another 13% believe the rate will be between 1.25% and 1.50% (1% below the current level!); and the median expectation is split with about 35% forecasting a Fed Funds rate between 1.5% and 1.75% (0.75% below the current level) and another 35% forecasting the Fed Funds rate to be between 1.75% and 2.0% by December (0.50% below the current level).

Barring a steep recession in the near term, expectations for multiple cuts in the Federal Funds rate are misguided. As my colleague at WSWA put it, the Fed is stuck in the unenviable position of a parent in the supermarket with a fractious child demanding candy before dinner. The right thing is to say No, but it’s difficult for both the parent (the Fed) and bystanders not to give in to the pressure.

Futures forecast for rate hikes by December


With all this uncertainty, where can investors find good opportunities?

The answer is: In the global equity markets, particularly in Europe. The U.S. market should be fine going forward, but the best returns may have already come and gone. Though European economies are having a tough time right now, the European stock markets have been punished perhaps more than is warranted. In fact, the price of European stocks as of May 31st is less than 13 times compared to the U.S. stock market at close to 16 times earnings.

International stock valuation cheaper than U.S.

The way ahead in Europe is not going to be smooth, but long-term investors should consider dipping into international markets where stock valuations are more attractive. Overseas countries are generally behind the U.S. in their business cycles and have more growth to come.

Conclusion: Investors and the Fed should stay the course. Sometimes the best decision is to do nothing…for now.

Yes, the global economy is struggling right now. Corporations and governments have been issuing too much debt. Trade tensions and uncertainty make it difficult for businesses to develop long-term growth strategies. Political tensions across Europe and the U.K. are adding uncertainty to global economies.

Despite these concerns, the Fed should not lower interest rates. In fact, there is a case to be made to raise rates to balance outcomes between savers and speculators, plus keep some dry powder for the next recession.

Long-term investors should consider international assets. This is not the environment to make big bets either in or out of the financial markets. Instead, investors should stay engaged in the markets and be selective about segments likely to provide a reasonable risk/return profile over the remaining business cycle. With government bond yields extremely low and U.S. stock prices fully valued, carefully selected international securities may be the right choice for patient investors able to handle some bumps along the way.

Marcia Clark, CFA
Senior Research Analyst

DISCLOSURES

Investment Advisor Representative, Warren Street Wealth Advisors, LLC., a Registered Investment Advisor

The information presented here represents opinions and is not meant as personal or actionable advice to any individual, corporation, or other entity. Any investments discussed carry unique risks and should be carefully considered and reviewed by you and your financial professional. Nothing in this document is a solicitation to buy or sell any securities, or an attempt to furnish personal investment advice. Warren Street Wealth Advisors may own securities referenced in this document. Due to the static nature of content, securities held may change over time and current trades may be contrary to outdated publications.

Form ADV available upon request 714-876-6200

April showers bring May flowers?…or thunderstorms??

Key Takeaways

  • The stock market stumbled in May after strong performance in April. The decline was likely due to concerns over the impact of proposed tariffs on Mexican goods, especially given that Chinese trade negotiations are still unresolved.
  • Treasury yields hit new lows in May as investors fled stock market volatility. However, a 10-year Treasury yield of 2.1% is not sustainable when inflation is hovering around the same level. We expect Treasury rates to increase rather than decrease from here.
  • Futures contracts indicate an 80% chance of the FOMC decreasing interest rates in July. This expectation is not supported by the economic data nor the plentiful level of liquidity already in the system. Futures investors are inferring more into dovish Fed comments than they should.
  • Despite pockets of weakness, the U.S. economy is still on track to grow by about 2% in 2019.
  • Conclusion: Stock market recoveries based on expectations of falling interest rates are vulnerable to ‘headline risk’, but the underlying economic fundamentals remain modestly positive.


When 1st quarter GDP came in at 3.2% many commentators expected an adjustment downward. That revision came in May…to 3.1%

1st quarter GDP adjusted by a scant -0.1%

Despite persistent pessimism about the imminent demise of the U.S. economy, we at Warren Street Wealth stand by our assessment that the economy will continue to grow at a modestly positive pace. Even with the drag on growth from increasing trade tariffs, the International Monetary Fund forecasts U.S. GDP to end 2019 at 2.3%, which is about average for the past few years.

We should be ready for a bumpy ride along the way, however! With global growth clearly slowing – Eurozone GDP is forecast to be only 1.3% this year and China is slowing to about 6.3% – major factors such as oil prices and other commodities are struggling to find a new equilibrium between global supply and demand.

Some market watchers see falling oil prices as a sign of recession, but we believe the energy market will find the proper balance once the long-term impact of current geopolitical tensions is better understood.

Oil prices add to market volatility


Though consumer spending was down in April, spending was strong in March. April’s decline is most likely due to consumers taking a breath after enjoying some extra purchases in March when wages began rising, rather than the beginning of a downward trend.

And don’t overlook the increase in disposal income in April. It isn’t huge, only +0.1%, but to quote one of our clients: “up is up, and up feels good!”

Consumer spending takes a breath after spiking in April


Another area which disappointed investors in May was job growth, which came in much lower than expected at +75,000. The unemployment rate remained steady at 3.6%, however.

Job growth slows, but is still trending higher


So is the economic glass half full or half empty? We’re going with half full. Patient investors who can withstand the market zigging and zagging based on startling headlines or surprising Twitter posts should be OK in the end.


If consumers are still buying and people are still working, where is the real pain in the economy?

Businesses who rely on global trade, either for inputs into their manufacturing process or to sell their finished goods, are feeling the pinch of rising tariffs. Manufacturers who need raw materials such as steel and aluminum are paying higher prices. Farmers growing soy beans and corn can barely make enough money to cover their expenses as the price of labor and farm equipment goes up while demand for their crops goes down.

As reported in the Wall Street Journal, manufacturers in the U.S. and China are still in growth territory with the Purchasing Managers Index slightly above 50, but Europe is clearly struggling.

We’re keeping a close eye on international markets in case weakness there begins to put more pressure on the U.S. economy.

European manufacturing dips into recession


The final factor we’re watching is the level of interest rates.

Without getting into a debate about whether the current inversion of short-term Treasury rates is forecasting a recession or not – see ‘A Few Minutes with Marcia’ video on inverted yield curves – 10-year Treasury rates at around 2.1% are simply not sustainable.

Negative interest rates in other developed countries and instability in our own stock market have led to high demand for ‘safe’ assets. But with Treasury yields barely keeping up with inflation, at some point U.S. investors will be forced to look elsewhere to preserve purchasing power.

When they do, selling pressure will push Treasury prices down and yields up.

2 yr. and 10 yr. Treasury rates hover near inflation


Because of mixed economic data and a slightly inverted yield curve, pessimists are expressing their opinion through Federal Funds futures contracts. 

As reported by the Chicago Mercantile Exchange ‘Countdown to FOMC’, as of June 10 over 80% of futures contracts were betting on the Fed decreasing short-term rates when the FOMC meets in July. We don’t agree.

Despite Fed chairman Jerome Powell’s accommodating tone in recent weeks, there is already more than enough liquidity in the financial system to support growth. A decrease in rates would just put upward pressure on inflation, potentially above the Fed’s target rate of 2%.

Fed Funds futures investors bet on falling rates


If we’re correct and the Fed does not decrease rates in July, we may see another dip in the stock market as investors re-calibrate their expectations. For now, just hold tight, watch the data, and wait for spring rains to bring summer sunshine…eventually…

Marcia Clark, CFA, MBA

Senior Research Analyst, Warren Street Wealth Advisors


DISCLOSURES

Investment Advisor Representative, Warren Street Wealth Advisors, LLC., a Registered Investment Advisor

The information presented here represents opinions and is not meant as personal or actionable advice to any individual, corporation, or other entity. Any investments discussed carry unique risks and should be carefully considered and reviewed by you and your financial professional. Nothing in this document is a solicitation to buy or sell any securities, or an attempt to furnish personal investment advice. Warren Street Wealth Advisors may own securities referenced in this document. Due to the static nature of content, securities held may change over time and current trades may be contrary to outdated publications.

Form ADV available upon request 714-876-6200

April 2019 Market Commentary

April 2019 Market Commentary

Key Takeaways

    • 1st quarter GDP beat expectations at 3.2%, due in part to increasing net exports and inventories
    • The U.S. stock market reached new highs as economic data and corporate earnings were stronger than expected, though stock prices of companies with disappointing results have been punished
    • Despite slowing GDP in China and continuing budgetary and political challenges throughout Europe, economic growth overseas remains modestly positive
    • The Conference Board’s Leading Economic Indicators Index® increased in February and March, though is expected to weaken slightly going forward; new home sales and job growth beat expectations
    • Though central banks are on hold for now, interest rate ‘normalization’ will resume when inflation gains traction, which could happen later this year due to tight labor markets and rising commodity prices
  • Conclusion: Enjoy the party! Global stock markets have had a good run so far, and recent earnings announcements and economic data suggest a positive environment for the rest of the year.

The death of the U.S. economy has been greatly exaggerated.

1st quarter GDP beat expectations at 3.2%, due in part to increases in net exports and inventories. This strong growth came despite the consensus view earlier in the year that the U.S. economy was nearing a recession. In fact, the U.S. economy is still benefiting from several sources of stimulus such as low interest rates, 2017 corporate tax cuts, and deregulation. While it’s unlikely we’ll see such strong GDP numbers going forward, there’s no sign yet that these supportive factors have fully played themselves out.

Time to celebrate! The U.S. economy is not dead!

The strong GDP growth was also reflected in the U.S. stock market.  As of April 26, 77% of S&P 500 companies reporting actual earnings during the 1st quarter of 2019 were higher than expected. The chart below compares projected quarterly corporate earnings (gray bar) to actual earnings (blue bar) over the past few years. Actual earnings surpassed estimated earnings in the 4th quarter of 2018 and are looking to do the same in the 1st quarter of 2019. Add to this the size of the positive surprise so far in 2019 being larger than the historical average, and you have the U.S. stock market hitting new highs in April.

But it isn’t all roses and sunshine. The U.S. stock market has rewarded upward earnings surprises for sure, but has been unusually harsh with companies reporting disappointing earnings. According to the Wall Street Journal, the stock price of companies reporting actual earnings below estimates has fallen an average of 3.5% in the two days before and after their earnings announcement, compared to a historical average decline of only 2.5%. Investors don’t seem convinced that corporate profits are going to continue to grow.

One indicator of this lack of trust in the strength of the economy is very low bond yields. Despite decent earnings growth and high stock prices, the yield on the 10-year Treasury bond remains very low at about 2.5%, barely above inflation. The fact that investors are willing to buy bonds at this very low yield indicates skepticism about where the global economy is headed and how quickly we’re likely to get there.

Countries outside the U.S. are also facing economic uncertainty. Europe continues to struggle with trade tariffs and political unrest, and tensions between the U.S. and China remain unsettled. The U.K. hasn’t yet figured out how to exit the European Union gracefully, Italy missed its budget deficit target (again), and business sentiment in Germany is falling.

One bright spot is stronger-than-expected first quarter growth in China. But international investors are now worried that Chinese authorities will slow the pace of policy easing and the economy will fall back. While Europe and the U.K. seem to be navigating their challenges well enough, heaven help us if the expected resolution of the U.S.-China trade talks gets derailed! Given the uncertain state of global economies, skittish investors may run for the sidelines at the slightest negative news about escalating trade tensions.

But don’t let me be a ‘Debbie Downer’! Global stock markets are doing great so far this year.

If the year ends with no more gains than we already have, the S&P 500 return for the first four months of 2019 will be in the top third of historic returns for an entire year. As you can see in the graph below, developed and emerging global markets are also having a good run in 2019 (blue and red lines). Even bond market returns are positive, as shown by the green line at the bottom of the graph.

https://stockcharts.com/h-perf/ui


There is one cautionary note on the U.S. stock market, however: higher-than-average stock valuations. According to Factset, the forward 12-month Price/Earnings ratio for S&P 500 companies has risen to 16.8. This is higher than both the 15-year and 10-year average, and a signal that the market may not have much more room to run.

So far, so good…but for how long?

In mid-April the Conference Board announced its Leading Economic Indicators Index® (LEI) for the 1st quarter of 2019. The LEI posted a gain of 0.4% in March after increasing 0.1% in February, primarily due to strength in the labor markets, improved consumer outlook, and better-than-expected financial conditions. Eight out of the 10 LEI factors were positive in March, with 2 factors holding steady (average weekly manufacturing hours and building permits.) New home sales also rose unexpectedly in March, the third gain in a row. The three-month average sales rate is close to its best since December 2007.

Despite the recent strength in economic data, the trend in the LEI is leveling out, suggesting the U.S. economy will slow toward its long-term potential growth rate of about 2% by year end. This trend is reflected in the reduced pace of home price appreciation in March and a slight drop in labor participation.

The Fed echoed this ‘slow growth’ story in the statement released after the May 1st FOMC meeting. The committee highlighted a slowdown in household spending and business investment, as well as inflation below its 2% target, but indicated this weakness was probably “transient” and short term rates were appropriate at the current level.

All in all, the data continue to support the conclusion we’ve been talking about since late 2018 – the U.S. economy is slowing, but a recession is not imminent. In fact, the surprise that might spook investors later this year isn’t recession, but inflation.

With stronger than expected economic data so far in 2019, is inflation around the corner?

The tight labor market and increasing commodity prices might catch up with us later this year. As shown on the graph below, the cost of personal consumption has fallen recently but ticked up again in March (blue line). The Employee Compensation Index increased 0.7% for the quarter, though the 12-month growth rate slowed a bit (red line.) And the job report released in early May reported non-farm payrolls up 263,000, while the unemployment rate fell to 3.6%, the lowest level since 1969. It’s reasonable to expect higher wages to boost consumer purchases going forward, which may enable businesses to pass the increased labor cost on to consumers.

If you add increasing commodity prices such as oil (red line) and copper (blue line) to the rising wage trend, we may finally see the increase in inflation many of us have been watching for during the past few years of the economic recovery.

What is the end result? If commodity prices remain high and sales of goods and services absorb price pressure from increased labor and input costs (inflation), the Fed may have to revisit its mission to ‘normalize’ interest rates to keep the U.S. economy from overheating later this year. Market participants aren’t expecting this. Investors tend to react badly when caught by surprise, so we’re keeping a close watch on the data in the hope of being one step ahead of the crowd when the time comes to head for the exits.

Source: https://www.cmegroup.com/trading/interest-rates/countdown-to-fomc.html

Conclusion: Enjoy the ride! (for now)

While we can’t predict when the party will end, that’s no reason not to enjoy ourselves in the meantime. A higher proportion of people are participating in the workforce than at any time since the 2008-2009 recession. Wages are rising, political tensions are easing, corporate profits aren’t as bad as feared, and interest rates remain low. What’s not to like?!

Just keep an eye out for warning lights as we get closer to the end of the year.

ASSET CLASS and SECTOR RETURNS as of APRIL 2019

Source: Morningstar Direct

Source: S&P Dow Jones Indices


Marcia Clark, CFA, MBA
Senior Research Analyst
Warren Street Wealth Advisors

Warren Street Wealth Advisors, a Registered Investment Advisor. The information contained herein does not involve the rendering of personalized investment advice but is limited to the dissemination of general information. A professional advisor should be consulted before implementing any of the strategies or options presented. Any investments discussed carry unique risks and should be carefully considered and reviewed by you and your financial professional. Past performance may not be indicative of future results. All investment strategies have the potential for profit or loss. 


DISCLOSURES

Investment Advisor Representative, Warren Street Wealth Advisors, LLC., a Registered Investment Advisor


The information presented here represents opinions and is not meant as personal or actionable advice to any individual, corporation, or other entity. Any investments discussed carry unique risks and should be carefully considered and reviewed by you and your financial professional. Nothing in this document is a solicitation to buy or sell any securities, or an attempt to furnish personal investment advice. Warren Street Wealth Advisors may own securities referenced in this document. Due to the static nature of content, securities held may change over time and current trades may be contrary to outdated publications.

Form ADV available upon request 714-876-6200


March 2019 Market Commentary

Key Takeaways

    • The rally in U.S. stocks slowed in March but still posted the best 1st quarter in recent memory at 13.65%, though stock markets remain volatile as investors seem to overreact to fears of the Fed increasing interest rates too much or not increasing rates at all
    • A slightly better-than-expected jobs report for March helped calm fears about mixed economic data in the U.S., supporting the Fed’s decision to keep short-term interest rates low for the foreseeable future
    • The OECD lowered its forecast for European GDP growth to a paltry 1.0% in 2019 and 1.2% in 2020; German government bonds fell into negative territory after the ECB reported weak manufacturing data
    • Overall, improved labor conditions, lower headline inflation, and accommodative monetary policy should help support real income growth and household spending in most developed countries


  • Conclusion: Recent market swings seem driven more by fear than by fundamentals. Economic data isn’t great, but the data doesn’t support a forecast for a global recession; U.S. markets are likely to hang on to gains until or unless weakness in the economy becomes more clear.


Is the U.S. economy getting better? Or getting worse?

The S&P 500 had its best 1st quarter return in recent memory, yet the Federal Reserve Bank kept interest rates low to avoid derailing the economy. Which of these forward-looking indicators is correct? To answer this question, let’s start at the beginning. You may have learned in school that GDP – the primary measure of economic strength – is simply the value of all goods and services sold in a country over a given period of time. In essence, GDP represents the value of business transactions. These transactions flow into company financial statements and impact the ability of these companies to pay dividends or launch new ventures. This increased cash flow is recognized by investors, who become willing to pay more for shares of those businesses in the stock market, pushing stock prices up. If the economy is up, stock prices are up too.

Easy, right? All the dominoes line up and we understand how the market works…or maybe not?

Here is the conundrum: stock prices are a ‘leading economic indicator’ because investors buy today expecting gains in the future. Interest rates are also leading indicators because investors need to forecast future interest rates – which typically move up and down with economic activity – before they’re willing to tie up their money for 10 or 20 years. Stock and bond prices don’t usually go up together.

Source: https://www.pimco.com/en-us/resources/education/everything-you-need-to-know-about-bonds

If interest rates go up, prices of existing fixed-rate bonds go down in order to compete with new bonds issued with higher coupon (interest) rates. But rising interest rates usually indicate more demand for funds, which is often associated with a strong economy, which means more profits, and consequently higher stock prices.

The upshot of all this is when stock prices go up, bond prices are usually flat or negative. Conversely, when stock prices go down, bond prices are usually positive as investors sell volatile stocks and seek safer assets such as government bonds.

Source: https://stockcharts.com/h-perf/ui

As you can see from the chart above, bond prices as represented by the long-term Treasury ETF (ticker ‘TLT’ – blue line) usually go up when stock prices go down (represented by the Dow Jones Industrial Average – black line), and vice versa. This effect was particularly dramatic during the 4th quarter of 2018.

Despite the strong start for stocks in 2019, if you look back 6-months from October to March, bonds have been among the best performing asset classes. Bonds may not be sexy, but they sure are welcome when markets get rough! But wait – look at the red box in February and March. Bond and stock prices are moving together. Why??

The charts below from the Bureau of Economic Analysis may hold some of the answers. In a nutshell, the problem is Change. And I don’t mean the kind of change you find in your sofa cushions…

Chart 1: The U.S. economy is growing, but slower than in recent quarters.


Consumer spending takes a breath after spiking in April

Chart 2: Disposable income is increasing, but consumer spending is down.

Chart 3: Companies are adding value to GDP, but at a slower pace than previously.

The economic data is okay, but clearly slowing from the strong levels of 2017-2018. Does ‘slowing’ economic activity mean a recession is around the corner? I don’t think so, and many commentators are coming around to this view. What’s really moving the market, then? In addition to economic fundamentals, the stock market seems to be overreacting to the possibility of interest rates going up…or going down. Does being afraid of both situations make any sense? Probably not.

If the Fed increases rates too aggressively, they could indeed stall the economy. But we should take comfort in the persistent ‘data dependent’ stance of the Fed. They have no intention of being aggressive with interest rate hikes, so the stock market should probably find something else to worry about. In fact, institutional investors seem to agree that short-term rates are going nowhere any time soon. Federal Funds futures contracts are predicting the Fed will decrease rates by the end of 2019, though the Fed’s own ‘dot plot’ shows a possibility of one rate increase by the end of the year.

Source: https://www.cmegroup.com/trading/interest-rates/countdown-to-fomc.html

Source: https://www.federalreserve.gov/monetarypolicy/files/fomcprojtabl20190320.pdf

The Fed is also cautious about raising short-term rates too quickly and causing the Treasury yield curve to become ‘inverted’. An inverted yield curve is one where short-term interest rates are higher than longer term rates. This isn’t normal! Investors and lenders usually require higher rates to lock up their money for a longer period of time. An inverted curve is usually driven by…here’s that word again…Change.

The yield curve can invert under three basic scenarios:


  • The Fed is aggressively increasing short-term interest rates to cool down an overheated economy


  • Investors are demanding less return for longer maturities because they believe inflation, and consequently future interest rates, will be lower than they are currently


  • Differing supply and demand pressures on the short and long portions of the yield curve, sometimes driven by interest rate differentials between the U.S. and other developed countries


An inverted yield curve has preceded many recessions in the past few decades, which is why it makes people uncomfortable. But the inversion has happened as much as 2 years before the recession, so I’m not sure that the curve is actually predicting anything. It’s more helpful to analyze the economic situation driving the curve shape, rather than drawing conclusions from the curve alone. You might take comfort in knowing that post-inversion recessions have only happened when the 10-year Treasury yield was at least 0.50% below the Fed Funds rate, which we’re nowhere near. Right now my money is on Option #3 – a supply demand imbalance, not an imminent recession. Nonetheless, the current Treasury curve is slightly inverted between the 1 year and 5 year maturities and the Fed doesn’t want it to get worse and spook investors.

Source: Morningstar.com

It doesn’t make much sense for investors to be afraid of interest rates going up and also afraid of interest rates going down. But that seems to be the case at the moment and is a key driver of recent volatility in the U.S. stock market. Let’s be ‘data dependent’ for a minute and draw our own conclusions based on what we can see in the global economic landscape:

  1. The Fed is being cautious about raising or lowering interest rates because economic data doesn’t point strongly either up or down and they don’t want to spook the financial markets
  2. Though corporate earnings forecasts are lower than 2018, the majority of S&P 500 companies reporting slower earnings projections for the 1st quarter of 2019 have experienced positive stock price movement; S&P 500 gains year-to-date have been felt broadly across many sectors
  3. U.S. manufacturing output slipped to its lowest level in 2 years, despite trade tensions between the U.S. and China moderating somewhat rather than getting worse
  4. Challenges persist overseas, particularly in Europe, as trade tariffs hit European and Asian businesses harder than the U.S.; factory output in the Eurozone fell in March at the fastest pace in 6 years
  5. Manufacturing data in China, the second largest economy in the world, was stronger than expected in March; the Chinese economy is expected to slow to a still robust 6% GDP growth in 2019 and beyond
  6. European markets are stabilizing as the U.K. Parliament seems to be making progress identifying a viable ‘Brexit’ strategy; economic disaster in Europe due to stalled trade with Britain seems unlikely
  7. Trade tariffs aside, improved labor conditions, lower headline inflation, and accommodative monetary policy should help support real income growth and household spending in most developed countries
  8. Emerging economies are avoiding much of the global slowdown as many smaller countries benefit from strong capital investment, improving income growth, and economic and political reforms in recent years

What conclusions can we draw from all this data?

The economic data is certainly mixed, but most indicators point to slower growth in 2019, not a recession. From what we can see today, global economies, and consequently financial markets, should stay in modestly positive territory for the near term. We can sleep well at night knowing the ship is headed in the right direction…for now.


ASSET CLASS and SECTOR RETURNS as of MARCH 2019

Source: Morningstar Direct

Source: S&P Dow Jones Indices

Marcia Clark, CFA, MBA
Senior Research Analyst
Warren Street Wealth Advisors

Warren Street Wealth Advisors, a Registered Investment Advisor. The information contained herein does not involve the rendering of personalized investment advice but is limited to the dissemination of general information. A professional advisor should be consulted before implementing any of the strategies or options presented. Any investments discussed carry unique risks and should be carefully considered and reviewed by you and your financial professional. Past performance may not be indicative of future results. All investment strategies have the potential for profit or loss. 

DISCLOSURES

Investment Advisor Representative, Warren Street Wealth Advisors, LLC., a Registered Investment Advisor


The information presented here represents opinions and is not meant as personal or actionable advice to any individual, corporation, or other entity. Any investments discussed carry unique risks and should be carefully considered and reviewed by you and your financial professional. Nothing in this document is a solicitation to buy or sell any securities, or an attempt to furnish personal investment advice. Warren Street Wealth Advisors may own securities referenced in this document. Due to the static nature of content, securities held may change over time and current trades may be contrary to outdated publications.

Form ADV available upon request 714-876-6200


Market Volatility – “A Few Minutes with Marcia”

Volatility measures the frequency and magnitude of price movements, both up and down, that a financial instrument experiences over a certain period of time. The more dramatic the price swings, the higher the level of volatility.

Learn the basics of market volatility with Marcia Clark, CFA, MBA.

Watch:

For those who prefer to read!

Welcome to A Few Minutes with Marcia. My name is Marcia Clark, Senior Research Analyst at Warren Street Wealth Advisors. Today we’re going to talk about the 4th quarter 2018 stock market dive and 1st quarter 2019 rebound in an attempt to understand more about market volatility.

Prior to 2018, the stock market had experienced 2 years of unusually low volatility, despite a few bumps along the way. After a mixed start to 2018, the Dow Jones Industrial Average looked like it was back to its winning ways, then came the 4th quarter tumble. Investors were caught by surprise by the huge swings in market prices – volatility – and started selling stocks like crazy. To better understand these market dynamics, let’s put the recent activity into context.

You may have heard of a common measure of market volatility called the ‘VIX’ – the Chicago Board Options Exchange volatility index. The VIX measures expected future volatility by evaluating the prices of put and call options traded on the exchange. If you’re looking at the slideshow, you can see how much calmer the VIX index was during the quiet years of the stock market, especially in 2017. As the market swooped up in late 2017, expected future volatility spiked shortly thereafter – remember that volatility can spike when prices go up as well as down.

When the market gave back some of its gains in early 2018, the volatility index fell back as well. Then came the market tumble in late 2018. The VIX index starts jumping around like a Richter scale during an earthquake. As we move into 2019, even with the recent pick up in volatility the graph shows that the VIX is at a pretty normal level compared to prior years. We’re just not used to ‘normal’ volatility anymore.

Where do we go from here? No one knows for sure, and if anyone says they can predict the future they’re kidding themselves and their clients. What we can say is that financial markets react to rumors and headlines, many of which don’t fundamentally change the financial landscape. This ‘knee jerk’ reaction causes market volatility, and this volatility is normal. In fact, active investment managers appreciate market volatility, because market dips based on headlines rather than fundamental changes in the economic landscape give investors with a strong stomach and an evidence-based outlook the ability to buy good assets at cheap prices. If all goes well, those assets will recover their value plus more over time, and patient investors will be rewarded.


Marcia Clark, CFA, MBA
Senior Research Analyst
Warren Street Wealth Advisors

Warren Street Wealth Advisors, a Registered Investment Advisor. The information contained herein does not involve the rendering of personalized investment advice but is limited to the dissemination of general information. A professional advisor should be consulted before implementing any of the strategies or options presented. Any investments discussed carry unique risks and should be carefully considered and reviewed by you and your financial professional. Past performance may not be indicative of future results. All investment strategies have the potential for profit or loss. 


DISCLOSURES

Investment Advisor Representative, Warren Street Wealth Advisors, LLC., a Registered Investment Advisor

The information presented here represents opinions and is not meant as personal or actionable advice to any individual, corporation, or other entity. Any investments discussed carry unique risks and should be carefully considered and reviewed by you and your financial professional. Nothing in this document is a solicitation to buy or sell any securities, or an attempt to furnish personal investment advice. Warren Street Wealth Advisors may own securities referenced in this document. Due to the static nature of content, securities held may change over time and current trades may be contrary to outdated publications.

Form ADV available upon request 714-876-6200

2019 Started with a Roar!

WSWA Monthly Market Commentary for February 2019

Key Takeaways

    • Commodities took the lead in February with a year-to-date return of 13.14% as oil prices recovered from the supply/demand imbalance during the second half of 2018
    • The S&P 500 index is on pace for its biggest early-year advance in nearly 30 years, due in part to diminished investor fears about the impact of trade tensions and slowing pace of interest rate hikes
    • Forward-looking economic data is mixed: S&P 500 companies expect earnings growth to slow, but the Conference Board’s Leading Economic Indicators remain strong
    • Overseas tensions continue as the U.K. has yet to approve a ‘Brexit’ plan, trade tariffs put pressure on global economic growth, and high levels of public and private debt reduces central bank flexibility
    • Conclusion: Global economies are slowing but unlikely to enter a recession in 2019, providing support for U.S. financial markets. Market performance around the world is likely to be positive though with mixed results across developed and emerging economies.

Energy takes the lead with an impressive year-to-date return over 23%.

2019 started with a roar as commodities streaked off the starting line, gaining 13.14% in January and February (combined). The biggest winner was the Energy sector leaving everything else in the dust with an impressive 23.48% return. The rebound in oil prices was fueled in part by ongoing supply reductions by OPEC and diminishing trade tensions between the U.S. and China. Going forward, U.S. shale oil production capacity should keep a lid on oil prices despite efforts by OPEC countries to keep prices higher.

wti

Source: www.cnbc.com

1. https://us.spindices.com/performance-overview/commodities/sp-gsci
2. Source: Morningstar Energy sector analyst report

Global stocks were not left in the dust.

Despite the recent downturn, the S&P 500 is on pace for its strongest start in recent memory. This impressive performance was felt broadly across market sectors, led by Industrial companies and followed closely by Energy, Technology, and Consumer Discretionary firms.

Global stocks

Thankfully, U.S. stock market volatility as measured by the Chicago Board Options Exchange Volatility Index (VIX) calmed down from the frantic pace of the 4th quarter, perhaps due to investor fatigue as much as anything else. In truth, news has indeed gotten better: the FOMC indicated it would remain patient with the pace of normalizing interest rates; trade negotiations with China are progressing toward a workable conclusion; and corporate earnings for the 4th quarter are coming in better than investors feared.

vix

Source: www.bloomberg.com

3. https://www.wsj.com/articles/history-shows-stock-rally-could-have-more-legs-11550840401

International stocks are also benefiting from economic and political tailwinds, pulling slightly ahead of the U.S. in February with a return of 3.58% versus 3.21% for the S&P 500. The U.S. remains in the lead year-to-date: +11.48% compared to +9.57% for the developed markets equity index (MSCI ACWI.) Emerging Markets stocks are solidly in the middle of the pack at 0.22% in February and 9.01% year-to-date. U.S. bonds lagged the field with a negative return of -0.06% in February and 1.0% year-to-date, despite over $25 billion of inflows from mutual fund investors fleeing the stock market volatility of the 4th quarter 2018.

Asset Class Winners and Losers as of February 2019

Asset Class Winners and Losers as of February 2019

Source: Morningstar Direct

4. Source: Morningstar Direct
5. https://ici.org/research/stats/flows

With such a great start to the year, you might be wondering “where do we go from here?”

As reported in the Wall Street Journal and calculated by Dow Jones Market Data, the U.S. stock market continues in the same direction it started 64% of the time. Whether this relationship will apply in 2019 depends to some degree on the cause of the strong start. Given the sharp sell-off in the 4th quarter of 2018, some of the rally in early 2019 is likely attributed to stock prices finding a more rational foundation after being oversold, with the remainder based on fundamental factors outlined above. These aren’t powerful reasons for the rally to continue the rest of the year, but no reason to decline either.

It is encouraging to see Industrials leading the way rather than Technology, as the returns of industrial companies tend to be more closely tied to longer term economic trends. The breadth of the rally is also hopeful, as the number of stocks rising versus falling each day hit new highs in February.

Another bright spot is the Conference Board’s ‘Leading Economic Indicators’ index which remains strong despite declining a bit in January.

conference board

6. Source: Dow Jones Market Data

What could go wrong?

On the less optimistic side of the equation, most S&P 500 companies are forecasting earnings growth to slow in 2019. Overseas, economic tensions persist as the U.K. has yet to come up with a ‘Brexit’ deal acceptable to both the European Union and the British Parliament, and trade tariffs are hitting European automakers particularly hard. Add to this the worrisome growth of debt among many public and private entities worldwide, including the U.S. government, leaving central banks with less flexibility if the global economy stumbles.

The International Monetary Fund recently published an eye-opening study about the amount of debt accumulated around the world. (see chart below) The large light blue circle in the ‘Advanced Economies’ section at the top of the chart represents U.S. public and private debt at 256% of GDP. Japan is the green circle at the top right with nearly 400% debt to GDP(!), and Germany is the medium blue circle at the top left with 171% debt.

The dark blue circle in the middle ‘Emerging Markets’ section represents the debt load of mainland China at 254%. The lower section reflects ‘Low Income’ countries including Bangladesh, the light blue circle in the middle with 76% debt, and Vietnam in dark blue at the far right of this group with 189% debt to GDP.

Global Public and Private Debt as a Percent of GDP

Global Public and Private Debt as a Percent of GDP

7. https://blogs.imf.org/2019/01/02/new-data-on-global-debt/

Is all this debt a problem, especially for the U.S. government with over $22 trillion debt outstanding?

You might be comforted to know that though the U.S. government debt load is growing ever higher – due in some part to the ever-expanding U.S. economy – the interest servicing cost is only 1 ½% of GDP, compared to about 3% of GDP in the much higher interest rate environment of the 1980s and 1990s.

 interest rate

Source: www.treasurydirect.gov

As long as government borrowing and spending doesn’t ‘crowd out’ the private sector capacity to lend and spend, the debt shouldn’t be a problem. However, if government debt becomes so large that the government’s need to borrow pushes up interest rates for the rest of us, the economy could slow, kicking off a vicious cycle of unsustainable borrowing to keep the economy afloat. But there’s no need to panic just yet! Government debt is nowhere near the danger level and is unlikely to get there any time soon.

How do we weigh the positive and negative economic data?

Based on the available information, it’s hard to say whether 2019 will be an outstanding year for financial assets, below average, or somewhere in between. The International Monetary Fund is forecasting an economic slowdown – not a recession – across most developed markets in 2019 and 2020 (including Europe and the U.S.)

Growth Projections

On balance, there is enough positive data to support the case that a recession is not on the horizon. This outlook is becoming more widely held, which should enable the financial markets to hold their position and cross the finish line in positive territory by the end of 2019.

As always, the investment team at Warren Street Wealth Advisors will keep a sharp lookout for confirming or contrary evidence as the year unfolds, and will base our investment decisions on the best information we can find. While the future remains unclear, we promise to keep you informed as we journey forward.

8. https://www.treasurydirect.gov/NP/debt/current
9.https://www.ftportfolios.com/Commentary/EconomicResearch/2019/2/22/debt,-the-economy-and-stocks
10. https://www.investopedia.com/terms/c/crowdingouteffect.asp

Quiz:

Referring to the IMF ‘Debt Around the World’ blog post at https://blogs.imf.org/2019/01/02/new-data-on-global-debt/, which of the following countries has the largest debt as a percent of GDP, including both government and private entities? (Hint: click on the link, then move your mouse over the circles to see the details for each country)

  1. United States
  2. China
  3. Japan
  4. Germany

If you’re the sort of person who likes to draw your own conclusions, we highly recommend the IMF website from which we source much of our global information. Click on this link to see global economic data: https://www.imf.org/external/datamapper/NGDP_RPCH@WEO/OEMDC/ADVEC/WEOWORLD

Answer below…


Marcia Clark, CFA, MBA
Senior Research Analyst
Warren Street Wealth Advisors

Warren Street Wealth Advisors, a Registered Investment Advisor. The information contained herein does not involve the rendering of personalized investment advice but is limited to the dissemination of general information. A professional advisor should be consulted before implementing any of the strategies or options presented. Any investments discussed carry unique risks and should be carefully considered and reviewed by you and your financial professional. Past performance may not be indicative of future results. All investment strategies have the potential for profit or loss. 


DISCLOSURES

Investment Advisor Representative, Warren Street Wealth Advisors, LLC., a Registered Investment Advisor

The information presented here represents opinions and is not meant as personal or actionable advice to any individual, corporation, or other entity. Any investments discussed carry unique risks and should be carefully considered and reviewed by you and your financial professional. Nothing in this document is a solicitation to buy or sell any securities, or an attempt to furnish personal investment advice. Warren Street Wealth Advisors may own securities referenced in this document. Due to the static nature of content, securities held may change over time and current trades may be contrary to outdated publications.

Form ADV available upon request 714-876-6200


Quiz Answer: Japan


WSWA Monthly Market Commentary

WSWA Monthly Market Commentary for January 2019

Key Takeaways

  • All major asset classes were up strongly in January, one of the best yearly starts in recent memory, despite the month-long partial government shutdown in the U.S. and continuing uncertainty internationally about the economic impact of trade tariffs and the U.K. ‘Brexit’ negotiations
  • Global real estate took the lead with a monthly return of 9.7%, followed by commodities and U.S. growth stocks at 9% each. The S&P 500 posted an 8% return for the month
  • Recession fears in the U.S. receded as job growth was strong despite the unemployment rate edging up to 4%;Corporate profits continued to grow in the 4th quarter of 2018, though will slow in 2019
  • Fears of a recession due to rising interest rates diminished with Federal Reserve officials holding short-term rates steady at their January meeting and commenting on being ‘patient’ with future rate increases

What a way to start the year!

All major asset classes were up strongly in January, one of the best yearly starts in recent memory, despite the month-long partial government shutdown in the U.S., continuing uncertainty about trade tariffs’ impact on international growth, and the failure of U.K. ‘Brexit’ negotiations.

Global real estate took the lead among major asset classes with a monthly return of 9.70%, followed by commodities and U.S. growth stocks at 8.99% each. The S&P 500 gained 8.01% for the month, with emerging markets equities up 8.77% and developed international equities up 5.72%. U.S. bonds also had a strong month, rising 1.06%.

Morningstar Direct

Source: Morningstar Direct

Among commodities, crude oil prices led the way with a strong rebound from the December 24th low of $42.53, ending the month at $53.79. The S&P GSCI Agriculture index, the second largest component of the S&P GSCI index, stabilized after declining steadily in recent years[1].

West Texas Crude Oil Price

Source: www.macrotrends.net

GSCI Agriculture Index

GSCI Agriculture Index

International equity markets are well priced for future growth.

Emerging Markets equities (EEM) led the international equity markets in January, followed by the MSCI All Country World Index (ACWI), with Europe, Australasia, and Far East (EAFE) markets not far behind.


[1]https://us.spindices.com/indices/

European markets posted solid returns despite Prime Minister Theresa May’s Brexit plan being voted down by Parliament. After the Brexit agreement was rejected, Prime Minister May survived a ‘no confidence’ vote and promised renewed efforts to negotiate an acceptable exit plan with European Union leadership.

According to Harris Associates, manager of the Oakmark International fund, international markets have been the victim of “overly emotional equity markets” in recent months[2] and U.K. businesses are generating the highest percent free cash flow in the world (6%[3]). Prominent companies such as Daimler, Lloyds, and Tencent are trading at significant discounts to intrinsic value, and the Oakmark International portfolio has a Price/Cash Flow ratio of 4.8x compared to 7.5x for the world, indicating the shares held in the fund are priced significantly lower than the world markets.

Oakmark International, MSCI ACWI, EAFE, and Emerging Markets Equity Returns

Oakmark International

Source: https://stockcharts.com/h-perf/ui

Worries about a near-term recession in the U.S. receded as corporate earnings continued to grow in the 4th quarter of 2018 and employers added more new jobs than expected.

Unemployment in the U.S. remained near historic lows, edging up to 4%[4] due to the temporary addition of government workers furloughed during the partial government shutdown. The labor participation rate continued to increase slowly and job creation exceeded expectations in January with 304,000 jobs added[5].

Fears of rising interest rates derailing the U.S. economy diminished with Federal Reserve officials holding short-term rates steady at their January meeting and commenting on being ‘patient’ with future interest rate increases[6].


[2]https://www.im.natixis.com/us/markets/finding-value-in-overly-emotional-equity-markets
[3] As presented Natixis National Sales Meeting January 10, 2019 Source: Corporate Reports, Empirical Research Partners Analysis as of November 30, 2018. Excluding financials and utilities; data smoothed on a trailing six-month basis.
[4]https://www.wsj.com/articles/global-stocks-edge-up-after-a-january-surge-in-the-u-s
[5]https://www.bls.gov/news.release/empsit.nr0.htm
[6]https://www.federalreserve.gov/monetarypolicy/fomcpresconf20190130.htm

U.S. Unemployment Rate, Participation Rate, and 10-yr. Treasury Yield

Corporate earnings for the 4th quarter were generally near the 5-year average with 10 of the 11 S&P sectors reporting year-over-year earnings growth.

Energy, Industrials, and Communication Services led the way with double-digit growth rates in the 4th quarter, though earnings estimates for 2019 are trending lower across most sectors[7].

4th Quarter 2018 Actual Earnings Growth vs. 12/31/2018 Projections

2019 Forecast Earnings Growth vs. 12/31/2018 Projections


[7]https://insight.factset.com/earnings-season-update-february-1-2019
The investment team at Warren Street Wealth Advisors held the line through a difficult 4th quarter of 2018, reaping the reward with a strong start to 2019.

Despite some negative headlines in December, the U.S. economy does not seem poised for a recession and we will remain fully invested across market sectors until evidence to the contrary becomes clear. With the Federal Reserve cautious on raising interest rates, job growth and wages increasing, and trade talks moving forward, we expect market volatility in 2019 to settle closer to historic norms, though not without some bumps along the way.

Despite recent weakness in overseas markets relative to the U.S., we are strong in our conviction that international markets are poised to rebound as stock prices stabilize at attractive levels, particularly in Europe and Emerging Markets, and negative headlines diminish. While economic and fundamental data appear mixed globally, we continue to be broadly diversified as international markets work through the next phase of political and economic developments.

As always, if you have any concerns or questions, the investment and financial planning teams at Warren Street Wealth Advisors want to hear from you! Call, write, or drop by our Tustin or El Segundo offices any time. We are here to help.


Marcia Clark, CFA, MBA
Senior Research Analyst
Warren Street Wealth Advisors

Warren Street Wealth Advisors, a Registered Investment Advisor. The information contained herein does not involve the rendering of personalized investment advice but is limited to the dissemination of general information. A professional advisor should be consulted before implementing any of the strategies or options presented. Any investments discussed carry unique risks and should be carefully considered and reviewed by you and your financial professional. Past performance may not be indicative of future results. All investment strategies have the potential for profit or loss. 


Does PG&E’s Recent Bankruptcy Announcement Scare You?

Here Are The Things All Employees Should Be Aware of Regardless of Where You Work

By Justin D. Rucci, CFP® 

As many of you are likely aware, PG&E recently announced a bankruptcy filing as the result of roughly $30B in potential liabilities stemming from recent California wildfires. Regardless of whether or not you work for a public utility, it is only natural to have questions around what to expect or what precautions you should be taking with your own money. With that said, below are some items you will want to remain cognizant of should more wildfires occur or things change.

Things to Think About:

401k

While your 401(k) account is technically “tied” to your employer, your contributions and vested matching contributions will not be at creditor risk should your company go bankrupt. As part of the Employee Retirement Income Security Act of 1974(ERISA), your 401(k) assets are required by law to be held in trust separate from the company. This means the assets are not commingled with the company’s general operating funds and are not accessible to the company should they need operating capital or funds to pay creditors. Your investments within the 401(k) are always subject to your own investment risk, so be sure to contact Warren Street Wealth Advisors if you would like guidance on the plan’s investment options.

Pension

Pension plans are another common concern for those worried about their company potentially filing for bankruptcy. Luckily ERISA comes into play here as well. As part of the enacting of ERISA, a government agency titled the Pension Benefit & Guaranty Corp.(PBGC) was formed. This agency is designed to step in to pay benefits should a private pension plan fall to bankruptcy. This agency will step in to pay receipt of your pension benefits at normal retirement age, annuity benefits to your survivors, disability benefits, and most early retirement benefits. The PBGC will not however pay for severance packages, vacation pay, or similar benefits. While benefits are guaranteed by the PBGC, they do enforce limits on what is covered by the agency, meaning it is possible that you would not necessarily receive your entire benefit. Maximum benefit guarantees can vary, but more information is available on the PBGC website here.

Retirement

How should you time your retirement if you are worried about your company going bankrupt? The short answer is, you probably shouldn’t dictate your retirement decision based solely on the possibility of a corporate bankruptcy. While the possibility of benefits being cut and severance package offerings are very real for companies that are struggling financially, often times it makes sense to take an individualized approach to analyze the situation before making a rash decision on retirement. Pension plans may change from a defined benefit annuity stream to a cash balance “lump sum” in some cases, but this does not necessarily mean it is time to retire. I would recommend speaking to an advisor should you have questions about your specific company and situation to determine what the best course of action may be for you.

What Should I Do?

For those interested in learning more about retirement and would like to meet with professional advisors, Warren Street Wealth Advisors hosts many events throughout the year. You can view our upcoming events here.

If you have any questions, contact info@warrenstreetwealth.com or call 714-876-6200. We are well versed in interpreting company benefits and are happy to talk through any of your questions or concerns.


Justin D. Rucci, CFP®
Wealth Advisor
Warren Street Wealth Advisors


Justin is an Investment Advisor Representative of Warren Street Wealth Advisors, a Registered Investment Advisor. The information contained herein does not involve the rendering of personalized investment advice but is limited to the dissemination of general information. A professional advisor should be consulted before implementing any of the strategies or options presented.

Any investments discussed carry unique risks and should be carefully considered and reviewed by you and your financial professional. Past performance may not be indicative of future results. All investment strategies have the potential for profit or loss. Changes in investment strategies, contributions or withdrawals may materially alter the performance, strategy, and results of your portfolio. Historical performance results for investment indexes and/or categories, generally do not reflect the deduction of transaction and/or custodial charges or the deduction of an investment-management fee, the incurrence of which would have the effect of decreasing historical performance results. Economic factors, market conditions, and investment strategies will affect the performance of any portfolio and there are no assurances that it will match or outperform any particular benchmark. Nothing in this commentary is a solicitation to buy, or sell, any securities, or an attempt to furnish personal investment advice. We may hold securities referenced in the blog and due to the static nature of the content, those securities held may change over time and trades may be contrary to outdated posts.


Sources

https://www.bankrate.com/retirement/your-pension-when-the-unexpected-happens/

https://money.usnews.com/money/blogs/on-retirement/2010/12/14/what-happens-to-my-pension-if-my-company-goes-bankrupt-