March Market Madness

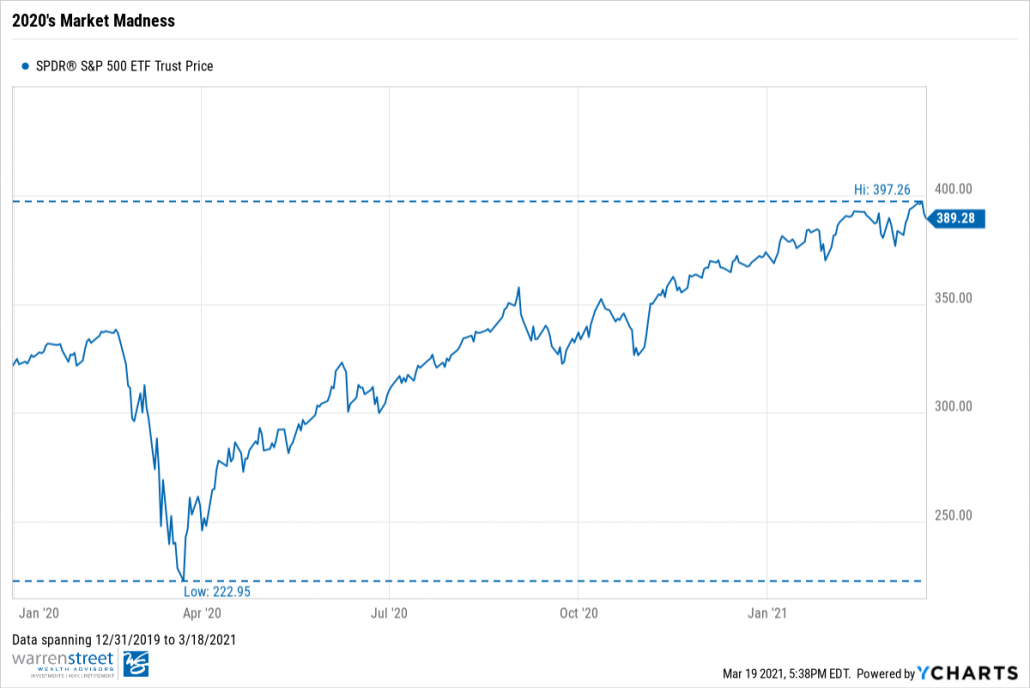
During this time last year, the NCAA canceled March Madness. With college basketball off the table, we were given a different type of madness: Market Madness. The S&P 500 drew down a total of 34% from peak to trough as COVID-19 wreaked havoc across global markets. This week marked the one year anniversary of that drawdown’s market bottom.

In September 2020, we wrote about the astounding fiscal and monetary policy action delivered by both the Federal Reserve and congressional lawmakers in response to the coronavirus. Although we complimented both the central bank and congress, the 2020 Most Valuable Player award quite honestly belongs to Jerome Powell and the Fed.

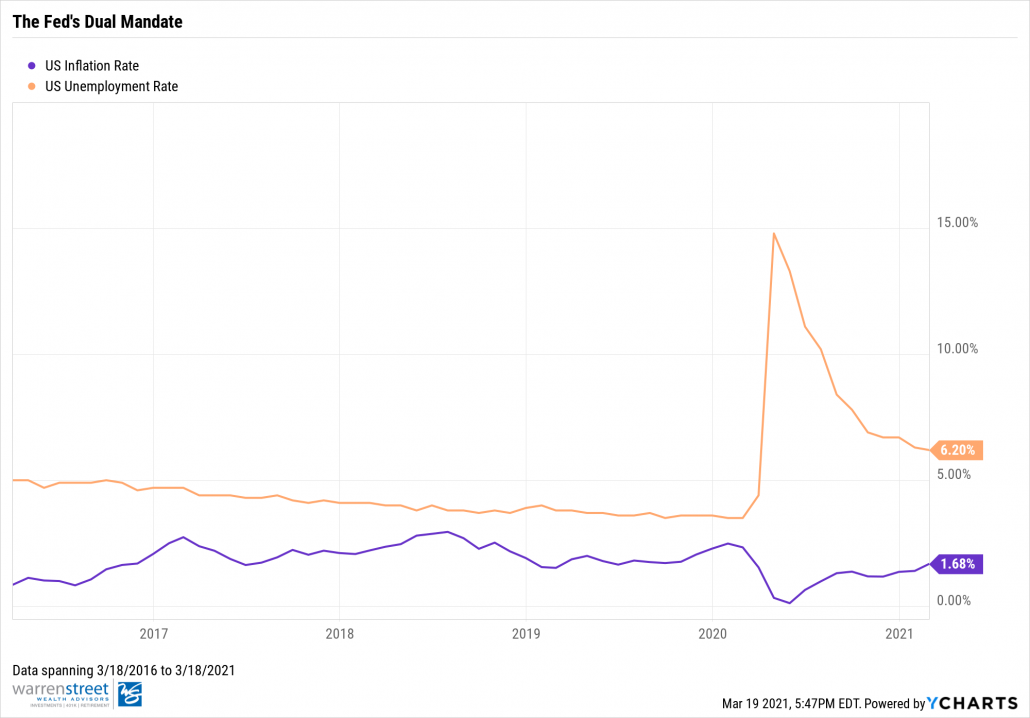
Today, after fending off last March’s Market Madness, the ball is no longer in the Fed’s court. Instead, The Fed is embodying a more reactive approach, awaiting signs of inflation to cross their 2% target before considering rate hikes or tools such as yield-curve control. Now, it’s our congressional leaders’ turn to play offense using fiscal policy. Their most recent time-out play is the $1.9 trillion stimulus package with embedded $1,400 stimulus payments expected to boost inflation.

Is Inflation Bad?

Let’s take a step back and consider why the Fed is setting a target with inflation. It’s important to distinguish that inflation isn’t as daunting as what’s ingrained in our history books. Sure, the inflationary tales of Zimbabwe and the Weimar Republic might seem scary, but the truth is such situations are rare and due to mismanaged policy in less-developed nations. Typically, mild inflation is a sign of rising consumption and increased demand. Today, this type of inflation can be recognized as reflation1; and in our case, reflation would signify that a return to normalcy is en route. 

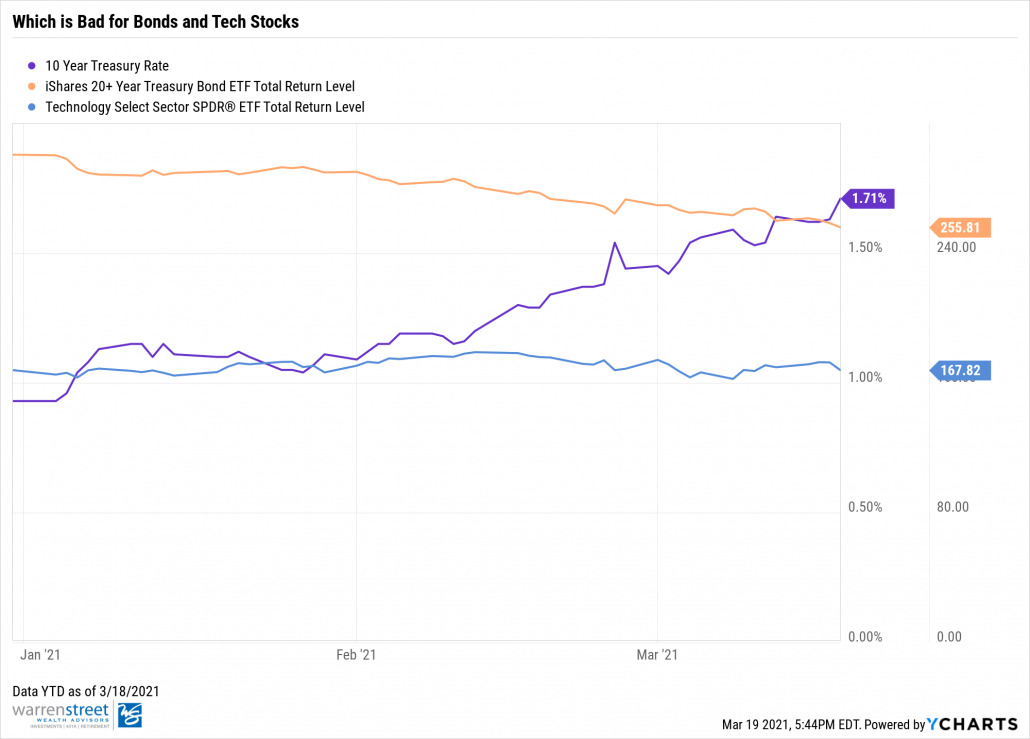
Market expectations for inflation are no laughing matter. A re-opening is expected to usher in increased spending in the form of pent-up demand. Input prices such as lumber and copper are already soaring. The five year breakeven treasury rate, which measures investor expectations for inflation, rose to its highest over point ever since 2014. Bonds, whose kryptonite is inflation, witnessed a sell-off that trickled into tech stocks.

But are markets correct to expect this much inflation? Or are markets overshooting their expectations by falling for this inflation pump fake? Perhaps our stay-at-home habits will prevail in the long-run and spending will not stay elevated, resulting in lower inflationary pressures. If so, we could see a rebound in bond prices and tech names. Nevertheless, this is the hotly debated topic among investors at the moment. 

Run The Play

This brings us back to the analogy with our administration’s most recent time-out-play. The $1.9 trillion relief bill is bringing hope to the workers, businesses, institutions, and communities that have struggled throughout this pandemic. As you can see in the chart below, the $1,400 stimulus payments represent a large percent of the package totalling $422 billion. It makes sense for investors to expect increased inflation as consumers now have higher disposable incomes and propensity to consume – but there is a catch.

Source: Committee For a Responsible Federal Budget (CRFB)

What will happen to actual inflation if these stimulus payments don’t make it back into the economy, but instead find their way into the stock market? A survey by Deutsche Bank revealed that individuals between the ages of 25 to 34 intend on placing 50% of the received payment into the stock market. Ultimately, the survey found that younger and high income earners eyed the stock market as the targeted destination for this income.

Source: Deutsche Bank Asset Allocation, dgDIG, RealVisionFinance
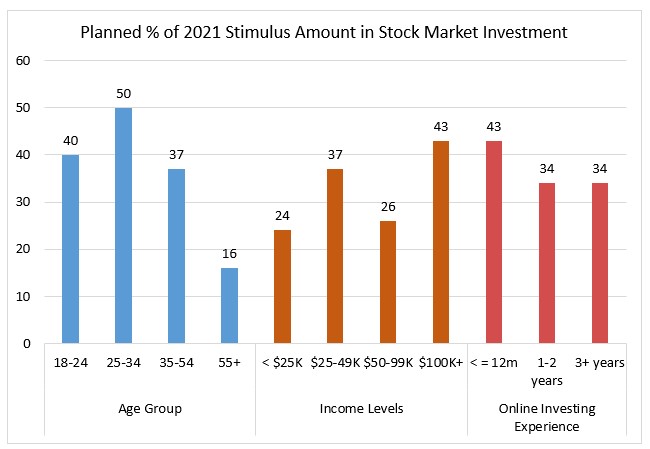
Data presented on 3/08/2021

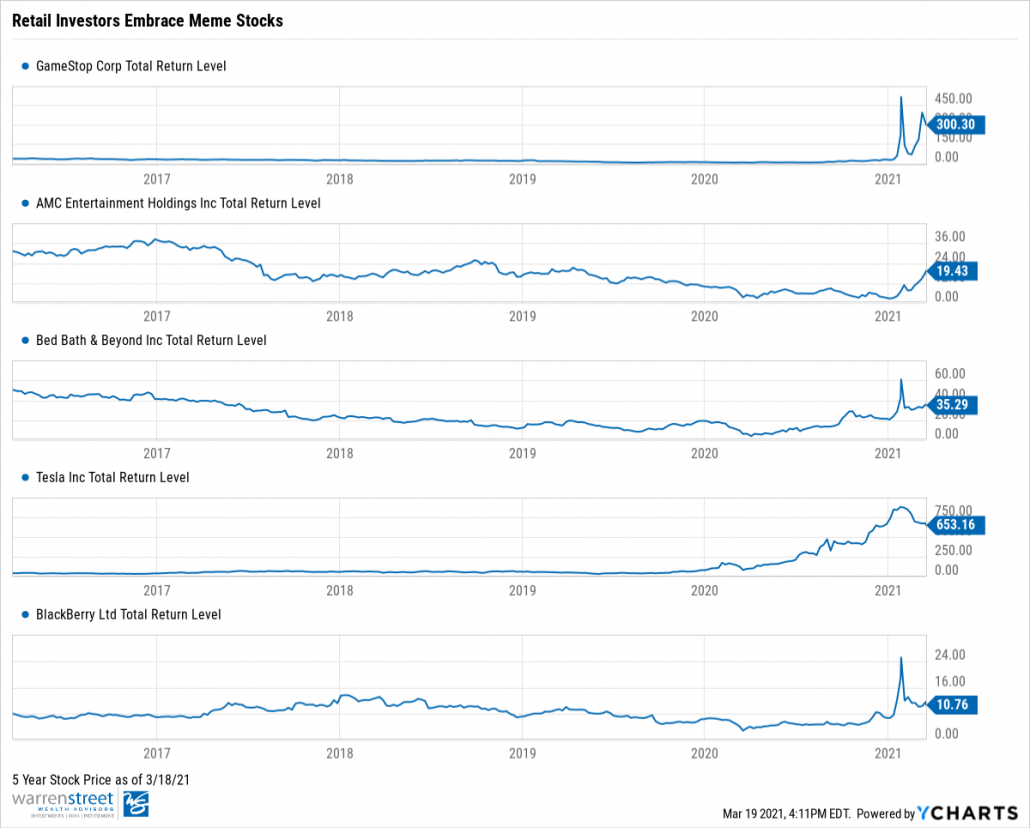
The Deutsche Bank survey, like any other, is going to be scrutinized for sampling error, but we don’t see something like the above being too far-fetched. The recent retail frenzy with “meme stocks2” like GameStop, Blackberry, and AMC has given rise to retail investing. Popular communities like r/WallStreetBets on Reddit have become a breeding ground for investors to commingle. Even more likely are your neighbors, who watched people get rich on the market’s 2020 rally, itching to pummel some of their stimulus money into the S&P 500.

These $1,400 payments are intended to increase demand for goods and prompt businesses to hire more workers, eventually raising wages. If these payments seek risk-assets instead, we could see a halt in the reflation narrative and a prolonged unemployment recovery.

Another risk to consider is the risk of financial stability. We’re seeing speculative behavior, especially from retail investors piling into stocks with less regard for the underlying fundamentals. At the end of the day, it’s quite possible to see a lack of wage growth in the economy while management teams of inefficient and highly-indebted companies get rewarded for little to no profitability.

The Bottom Line

We aren’t here to debate whether or not you should save or spend the money, let’s leave that to Reddit and Twitter. However, should a substantial portion of stimulus payments see capital markets as a more attractive destination than the underlying economy, the risks to reflation and financial stability must not be overlooked.     

We’ll see whether or not the $1.9 trillion time-out play will win the economic recovery game and prevent further Market Madness… if not, let’s hope it at least takes us into overtime.

Footnotes:

  1. Reflation represents increased price levels as a result of monetary or fiscal policy as a means to combat deflation.  
  2. “Meme stocks” are stocks that have gained traction from retail audiences such as Reddit or investment communities. GameStop and AMC are just a few of the many names with this retail comradery, earning these stocks the nickname “meme stocks” and causing a surge in prices throughout early 2021.

Sources: 

Committee For a Responsible Congressional Budget 

Deustche Bank Survey

YCharts

Phillip Law, Portfolio Analyst

Wealth Advisor, Warren Street Wealth Advisors

Investment Advisor Representative, Warren Street Wealth Advisors, LLC., a Registered Investment Advisor

The information presented here represents opinions and is not meant as personal or actionable advice to any individual, corporation, or other entity. Any investments discussed carry unique risks and should be carefully considered and reviewed by you and your financial professional. Nothing in this document is a solicitation to buy or sell any securities, or an attempt to furnish personal investment advice. Warren Street Wealth Advisors may own securities referenced in this document. Due to the static nature of content, securities held may change over time and current trades may be contrary to outdated publications. Form ADV available upon request 714-876-6200.

Recovery Rebate Stimulus Payment

The American Rescue Plan Act of 2021 is now a done deal. Among the items of greatest interest to most Americans is a third round of stimulus checks—or IRS “recovery rebates”—of up to $1,400 for every “eligible individual.”

That is the quick take but what is the fine print?

How Much Will You Receive?

Each eligible individual in your household should receive $1,400. Eligible individuals include:[1]

  1. You, as an individual taxpayer
  2. Your spouse (if you are filing a joint tax return)
  3. Any dependents you are claiming on your tax return, regardless of their age

For example: A married couple filing jointly and claiming three dependents on their tax return would be eligible for $1,400 x 5 = $7,000. This is the case even if the dependent is, say, an adult child in college, or a parent in assisted living.

The catch? Whether you receive a full, a partial, or no rebate depends on your Adjusted Gross Income (AGI) on your tax return:

If you are …You receive a full rebate if your AGI is … You receive a partial rebate if your AGI is …You won’t receive a rebate if your AGI is …
Single, or married filing separateUnder $75,000$75,000–$80,000Over $80,000
Head of householdUnder $112,500$112,500–$120,000Over $120,000
Married, filing jointly Under $150,000$150,000–$160,000Over $160,000

Which AGI are we talking about? Technically, the stimulus payment is a 2021 Recovery Rebate, but like our Great American Pastime (baseball), you actually get up to three “at bats,” or years in which to qualify for a full or partial rebate.

At Bat #1: Your 2019 or 2020 Tax Return, Already Filed

Initially, the IRS will look at the AGI reported on the most recent tax return you’ve already filed, whether that’s your 2019 or 2020 return. If your AGI falls within the “full rebate” parameters above, you can expect to receive your full 2021 Recovery Rebate. Where will the money go? If the IRS has a checking account on file for you, they should be able to issue a direct deposit into that account. Otherwise, they should mail you a check or debit card to your address on file.

Note: Even if you end up reporting higher income in subsequent years, you will get to keep the full amount of any payment you receive from At Bat #1. The IRS will not come after you, asking for you to pay it back.

At Bat #2: Your 2020 Tax Return, To Be Filed What if you’ve not yet filed your 2020 tax return, but your 2019 income was too high to qualify you for a full rebate? Good news: You get another chance once you file your 2020 return. At that time, the IRS will perform an “additional payment determination.” If your 2020 return qualifies you for a higher rebate than your 2019 return did, the IRS will essentially send you the difference, again via direct deposit or mail. You could receive:

  • A full or partial payment: If you received nothing based on your 2019 return, but you now qualify for one or the other based on your 2020 income.
  • A second partial payment: If you already received a partial payment, but you now qualify for more based on your 2020 income.
  • Nothing: If your AGI is still too high to qualify.

Note: To qualify for an additional payment determination, be sure to file your 2020 tax return on a timely basis, even if the filing deadline ends up being extended beyond April 15, 2021. We can provide additional information about specific deadlines as needed.

At Bat #3: Your 2021 Tax Return

What if neither your 2019 tax return nor your 2020 return qualify you for a full rebate? You still have one more chance. If your 2021 income is low enough to qualify, you will be able to file for a credit on your 2021 tax return for any amounts not already received. 

Additional Ideas: What’s a Taxpayer To Do?

You may have noticed, the range for receiving a partial payment is very narrow, which means fewer taxpayers will fall into it. Most of us will either qualify for a full rebate … or none at all.

If you do fall into the partial-rebate range, the amount you’ll receive will be calculated based on a straight percentage.

For example: A couple filing jointly with no dependents reports an AGI of $155,000, smack in the middle of the $150,000-$160,000 range. This means half of their rebate will be phased out. Instead of receiving $1,400 x 2 = $2,800, they’ll receive half of that, or $1,400.

Also, the tight, cliff-like gap between receiving a full payment versus nothing at all means a little tax planning could go a long way between now and year-end, especially if your annual income is close to qualifying you for a recovery rebate.  If this applies to you, please reach out to us soon to explore any 2020 or 2021 tax-planning opportunities that may help. Even if your income falls well within the “yes” or “no” recovery rebate ranges, please let us know if we can address any additional questions or comments. It is what we are here for!

[1] Nonresident alien individuals, and estates or trusts are explicitly excluded.


Reference Materials:

Emily Balmages, CFP®, CRTP

Wealth Advisor, Warren Street Wealth Advisors

Investment Advisor Representative, Warren Street Wealth Advisors, LLC., a Registered Investment Advisor

The information presented here represents opinions and is not meant as personal or actionable advice to any individual, corporation, or other entity. Any investments discussed carry unique risks and should be carefully considered and reviewed by you and your financial professional. Nothing in this document is a solicitation to buy or sell any securities, or an attempt to furnish personal investment advice. Warren Street Wealth Advisors may own securities referenced in this document. Due to the static nature of content, securities held may change over time and current trades may be contrary to outdated publications. Form ADV available upon request 714-876-6200.

DIY Credit Repair

Credit scores sometimes feel like the GPAs of high school. It’s just a number but also has a lot of power of what you can be approved for (like GPAs determine what colleges you can get into). If you’ve struggled with credit, it may be tempting to call the 800 number you hear on the radio promising you an overnight solution to repair your credit. As tempting as it is, do not do it! Most of these are just scams that will get you to spend money you don’t need to.

You can work on repairing your credit yourself and you should. 

Step #1 – Monitor your credit

The first step is seeing where you are at. You can get copies of your full credit reports from all the credit bureaus (Experian, TransUnion, and Equifax) by going to annualcreditreport.com or calling 877-322-8228. You are able to get your reports for free once a year via Annual Credit Report. 

You can also sign up for a reputable credit monitoring service. These services help you by sending alerts anytime there is suspicious activity on your credit and also giving you the ability to check in often. You can find a list of some options here.

Step #2 – Dispute any errors

Once you have your reports, you should review them for accuracy. Confirm that your name, address, social security number, and all other personal information is correct. Then review all the accounts reported including balances. If you see any errors, you can tell the credit bureaus in writing what information you think is incorrect. Make sure to include copies of supporting documents (bank statements, credit card statements, etc). You can find a sample letter for disputing errors on your credit report from the Federal Trade Commission here.

According to the Federal Trade Commission, credit reporting companies must investigate the items you question within 30 days unless they consider your dispute frivolous. Once the investigation is complete, the credit reporting company must also give you the results in writing and give you another free copy of the report. 

Step #3 – Control the things you can control

While sometimes there can be errors on your credit report that negatively affect you, a lot of the time your scores can be in your control. If you have a poor credit score because of things like missing payments, maxing out accounts, or applying for too much credit in a short period of time, work on improving these behaviors: 

  • Always try to pay your bills on time even if it’s just the minimum payments. 
  • Work on paying off your debt, especially high interest credit card debt.
  • Avoid applying for new credit. If you are trying to get a handle on your credit, one of the best things you can do is break the cycle of continuing to apply for new credit. 

For more information, or if you have any questions, please reach out to your trusted wealth advisor at Warren Street Wealth Advisors.

Veronica Torres

Director of Operations, Warren Street Wealth Advisors

Investment Advisor Representative, Warren Street Wealth Advisors, LLC., a Registered Investment Advisor

The information presented here represents opinions and is not meant as personal or actionable advice to any individual, corporation, or other entity. Any investments discussed carry unique risks and should be carefully considered and reviewed by you and your financial professional. Nothing in this document is a solicitation to buy or sell any securities, or an attempt to furnish personal investment advice. Warren Street Wealth Advisors may own securities referenced in this document. Due to the static nature of content, securities held may change over time and current trades may be contrary to outdated publications. Form ADV available upon request 714-876-6200.

Is Tesla Flying Too Close to the Sun?

743%. That’s how much Tesla stock (Ticker: TSLA) returned in 20201. Most of us are aware of the bifurcation between the market’s seemingly invisible ceiling and the economy’s continued disarray, but nobody could have foreseen that Elon Musk and his army of “musketeers” would be amongst those most rewarded for owning increased allocations of TSLA stock.

In fact, 2020 was an eventful year for the electric vehicle company. Among a series of roller coaster weeks, a stock split announcement, and raging debate over analyst price targets, perhaps TSLA’s most noteworthy 2020 phenomenon was its inclusion in the S&P 500 Index – a profound move that has us concerned over the stock’s perceived immortality at the forefront.

On December 21, 2020, the S&P 500 Index committee formally added the “profitable” carmaker to the index after denying TSLA index entry earlier in the year. The circumstances around this inclusion eerily resembles something we’ve seen before. Does “You’ve Got Mail” ring a bell? That’s right – we see multiple uncanny parallels between the TSLA and former net stock giant: American Online (AOL).

Echoes of The Past

On December 23, 1998, Standard & Poor’s announced it would make American Online the first “net” stock featured in the S&P 500 Index. Leading up to the announcement, AOL rallied 510% year-to-date2, before ending the year with a return of 585%. Compare this to TSLA, which had run-up 388%3 by the time the committee made its announcement on November 16, 2020. As mentioned previously, TSLA’s 2020 return was 743%. Notice here that a large proportion of TSLA’s 2020 return came in the last month and a half in the year…talk about upward volatility.

Arguably, the most intriguing similarity between these two stocks is the amount of price action driven by momentum and fear of missing out (FOMO). Investors overlooked red flags related to both AOL’s fundamentals and underlying profitability of tech stocks. AOL eventually lost 91%4 of its market value after a failed merger with Time-Warner cable. Meanwhile, valuations of tech stocks (represented by the Nasdaq Index) peaked in early 2000 before seeing 78%5 of its value disintegrate. Fast forward to the end of 2020, you have Tesla, a company whose “profitability” is primarily tied to energy credits, octupling (8x) its stock price to levels many investors deem uncomfortable.

Will TSLA suffer the same fate as AOL and other dotcom counterparts? Obviously 2021 is a different year. The carmaker makes electric-powered cars, not an instant messaging platform. We do acknowledge that historical performance is not indicative of future performance; and that correlation does not equal causation. However, it’s important to remember that those who don’t learn from history are doomed to repeat it.

How Much TSLA Do You REALLY Own?

TSLA’s inclusion in the S&P 500 Index raises a new challenge for investors: hidden concentration risk. With TSLA now a part of the NASDAQ, Russell 1000, and widely regarded S&P 500, owning index funds inherently carries TSLA exposure. Borrowing from our friends over at WisdomTree, imagine a scenario where Portfolio A holds broad index funds in addition to a few well-known names.

What investors thought was a 2.50% allocation to TSLA is at 4.00%6. I know, I know. 4% doesn’t seem like a big deal. Besides, what investor puts 90% of their equity allocation into only broad U.S. ETFs? (You’d be surprised). The more important point though, is that volatile price action with TSLA can hide how much of the stock you really own.

At the end of 2019, TSLA shares were at $83.67. As of Friday, January 15, 2021 – the stock sits at $824.91 – almost ten times over its stock price just a year ago. Let’s say you owned Portfolio A on December 31, 2019. As of January 15 this year, TSLA would comprise 19% of Portfolio A’s exposure (see Appendix A). Obviously, price appreciation and concentration risk create their own problems (e.g., skewed returns, tax consequences), but when the underlying rationale for that price appreciation is in question by the investment community at large, you could have an even bigger problem on your hands.

 Will TSLA Fall Back Down to Earth?

Today, it seems as if TSLA has really shot over the moon, multiplying its stock price ten times in a little over a year. Will the carmaker continue to defy odds throughout 2021? Or, is Tesla a ticking-time bomb waiting to explode?

We at Warren Street Wealth Advisors aren’t equity research moguls here to publish a Buy, Sell, or Hold on this highly debated stock. However, we do acknowledge that no company is immune from idiosyncratic risk. Whether Tesla can stay above the influx of foreign competition (e.g., NIO, Volkswagen), or whether or not valuations are outstretched represent just a few of many risks to the company’s stock price.

One observation fueling TSLA’s controversy is that despite having a much larger market cap relative to other established vehicle manufacturers (see above), the company only generated $28.2 billion in sales7. Compare this to a combined $1.1 trillion in sales7 for all its auto competitors listed above. How can a company, which does a fraction of its competitors’ sales, be worth more than all of them combined? Again, TSLA isn’t just a car company – it’s thought to be a generational leader driving the next revolution in clean energy; but nevertheless, some food for thought while you’re on the road.

Tesla’s ride sure was wild in 2020, and nobody can guarantee what will happen in 2021. However, as prudent investors, it’s important to not overlook the implications that a high-flying stock can have on client portfolios. We’re not here to argue whether Tesla’s run has just begun or if the stock’s price is dangerously inflated. But if the latter of those two ideas rings true, the world could be shocked when it sees electricity and a bubble come together.

Footnotes:

  1. YTD total return as of 12/31/2020 sourced to YCharts.
  2. YTD total return for 12/23/1998 and 12/31/1998 sourced to historicalstockprice.com.
  3. YTD total return as of 11/16/2020.
  4. AOL’s market cap plummeted from $226 billion to roughly $20 billion in 2003, sourced to Bezinga.
  5. NASDAQ percent off high spanning 12/31/1997 to 12/31/2003.
  6. 4.04% is the summation of multiplying TSLA weight in index by index weight in portfolio.
  7. Trailing twelve-month figures.

Appendix A

For any questions regarding international investments, emerging markets, or wealth management, please call 714-876-6200 or email phillip@warrenstreetwealth.com

Phillip Law, Portfolio Analyst

Wealth Advisor, Warren Street Wealth Advisors

Investment Advisor Representative, Warren Street Wealth Advisors, LLC., a Registered Investment Advisor

The information presented here represents opinions and is not meant as personal or actionable advice to any individual, corporation, or other entity. Any investments discussed carry unique risks and should be carefully considered and reviewed by you and your financial professional. Nothing in this document is a solicitation to buy or sell any securities, or an attempt to furnish personal investment advice. Warren Street Wealth Advisors may own securities referenced in this document. Due to the static nature of content, securities held may change over time and current trades may be contrary to outdated publications. Form ADV available upon request 714-876-6200.

PPP Reboot – More Small Business Relief

Last week, the SBA reopened the Paycheck Protection Program (PPP) and will begin accepting applications for “Second Draw” forgivable PPP loans.  

Here is a summary of the eligibility rules for Second Draw loans.  Borrowers can draw loans of up to $2 million provided they: 

  1. Have previously received a “First Draw” PPP loan and used the full amount on eligible expenses  
  1. Have 300 or fewer employees
  1. Document at least a 25% reduction in gross receipts in comparable 2020 and 2019 quarters

PPP borrowers may have their loans forgiven if the proceeds are spent on the following expenses:  payroll (including benefits), mortgage interest, rent, utilities, worker protection costs related to COVID-19, uninsured property damage costs caused by looting or vandalism during 2020, and certain supplier costs and expenses for operations.   

To receive full forgiveness, borrowers must spend at least 60% of the funds on payroll expenses over an 8-24 week period.  

This is a high-level overview; if you have questions about the specifics as they apply to your business, please contact us. We are here to help!

Source: U.S. Small Business Administration

https://www.sba.gov/funding-programs/loans/coronavirus-relief-options/paycheck-protection-program/second-draw-ppp-loans

Emily Balmages, CFP®, CRTP

Wealth Advisor, Warren Street Wealth Advisors

Investment Advisor Representative, Warren Street Wealth Advisors, LLC., a Registered Investment Advisor

The information presented here represents opinions and is not meant as personal or actionable advice to any individual, corporation, or other entity. Any investments discussed carry unique risks and should be carefully considered and reviewed by you and your financial professional. Nothing in this document is a solicitation to buy or sell any securities, or an attempt to furnish personal investment advice. Warren Street Wealth Advisors may own securities referenced in this document. Due to the static nature of content, securities held may change over time and current trades may be contrary to outdated publications. Form ADV available upon request 714-876-6200.

Year-End Planning Checklist

2020 has been a strange year for all of us, and although some financial planning deadlines have been modified due to the CARES Act, most 12/31 deadlines remain in place.  Below are items we are considering as we wrap up the year with our clients.  Should you have questions about whether or how any of the items below apply to you, please reach out to us as we will be happy to assist.  

 2020 Year-End Planning Items with 12/31 Deadline

  1. Maxing out 401(k) contributions:  Employees can contribute up to $19,500 (plus $6,500 extra for those over 50), into their 401(k)s for 2020.   If you have not yet contributed the maximum amount and your cash flow allows, consider increasing your contributions now to reach the maximum contribution amount prior to year end.  
  1. 401(k) Matching:  If your company offers a 401(k) match, it makes sense to take advantage of the full match opportunity every year.  If you have not received the full match for 2020, let us review your company’s 401(k) plan rules to determine if you can contribute enough to receive the full 2020 match before year end.  
  1. Charitable Giving for 2020:  There are some additional charitable deductions this year as part of the CARES Act.  There is a $300 deduction for taxpayers who don’t itemize, and for clients interested in large donations, taxpayers can deduct up to 100% of their adjusted gross income (up from 60%) for cash donations made to public charities. For clients with taxable accounts, we frequently recommend donating appreciated securities instead of cash via a donor-advised fund (DAF).  This strategy works well when a taxpayer has highly appreciated securities in taxable accounts, and/or in a year when income is higher allowing a client to benefit from a larger charitable deduction.  
  1. Gifting:  The annual gift exclusion amount for 2020 is $15,000 per taxpayer to each recipient.  (Married couples can give $30k.)  Make your annual gifts prior to 12/31 if you haven’t already!  
  1. Tax Loss/Gain Harvesting:  At Warren Street, we employ a continuous monitoring of client accounts for tax loss harvesting opportunities.  Similarly, if a client is experiencing a particularly low tax year, it may be the right time to strategically harvest capital gains.  
  1. Roth Conversions:  Although market downturns are not fun, they can certainly provide an opportunity for strategic Roth Conversions.  This is an annual planning item that we analyze for every Warren Street client.  
  1. LLC / Entity Formation:  If you are in the process of business entity formation for 2020, you may need to have your documents signed and filed prior to the end of the calendar year.  

If you have any questions about the above checklist or any other year-end planning questions, please feel free to reach out to your trusted wealth advisor. We are here to help!

Emily Balmages, CFP®, CRTP

Wealth Advisor, Warren Street Wealth Advisors

Investment Advisor Representative, Warren Street Wealth Advisors, LLC., a Registered Investment Advisor

The information presented here represents opinions and is not meant as personal or actionable advice to any individual, corporation, or other entity. Any investments discussed carry unique risks and should be carefully considered and reviewed by you and your financial professional. Nothing in this document is a solicitation to buy or sell any securities, or an attempt to furnish personal investment advice. Warren Street Wealth Advisors may own securities referenced in this document. Due to the static nature of content, securities held may change over time and current trades may be contrary to outdated publications. Form ADV available upon request 714-876-6200.

How Will Emerging Markets “Emerge” From 2020?

It’s no doubt that U.S. equities remain the protagonist of the past decade. The longest U.S. economic expansion, coupled with the blossoming of numerous tech stocks like Amazon and Tesla, helped the S&P 500 climb to record highs. That was soon followed by the U.S. stock market’s astounding recovery in 2020, which continues to capture the attention of global investors.

Many forget, however, that the decade before looked entirely different. Back then, we had an entirely different “darling” called emerging markets which left the S&P 500 in the dust.

Data spanning 12-31-1999 to 12-31-2009

During the 2000’s, emerging market investments drastically outperformed the S&P 500 by 188.1% on a total return basis. Steadying economic data and optimistic outlooks for EM nations including Brazil, Russia, India, and China, or the BRIC nations, painted narratives of a new global convergence. Meanwhile, U.S. stocks continued limping from the aftermath of the dotcom bubble.

The Case for Emerging Markets

EM investments invest in the securities of a less developed country with improving economic conditions and increased involvement with the global economy. Aside from the BRIC nations, this includes countries such as Vietnam, Indonesia, Africa, and Argentina. EM regions are attractive for the following reasons:

  • Growing Contribution to GDP: Over the past few years, emerging economies contributed an increasingly higher percent share to global productivity. EM contribution to GDP was 56.9% in 2019, while advanced economies contributed 43.1%. The International Monetary Fund (IMF) forecasts this trend to continue into 2024, making emerging markets an attractive long-term investment opportunity.
Data as of 6-30-2020. Source: IMF
  • Favorable Demographics: 85% of the world’s population, or about 6 billion people, reside within emerging countries. Over 50% of the global population under the age of 30 live in EM nations. This will fuel a rising-middle class in years to come. Increased productivity amongst large-working populations will also uplift the region’s standard of living.
  • Hot Spot for Disruptive Innovation: Emerging markets typically lack the infrastructure and technologies of developed nations. This presents ample opportunity for the region’s younger, more tech-savvy population to embrace innovation. Global leaders including the World Bank have also recognized the tech disparity and have provided funding for infrastructure enhancements.

COVID-19 in Emerging Markets – Some Juggle While Others Struggle

Contrary to expectations, emerging markets have weathered the pandemic better than expected. A younger population and lower obesity rates have helped certain emerging countries wither down mortality rates. Accommodative fiscal and monetary policy through asset purchases and fiscal stimulus modeled after developed nations helped keep many economies afloat.

East Asian countries, China in particular, have exemplified great handling of the Coronavirus. As a result, EM has rallied 24.3% since the market bottomed (data spanning March 23 to December 8). China is also the only country expected to report positive GDP growth for 2020. Although it’s best to view Chinese data with a skeptical eye, investors cannot deny the nation’s swift return to economic activity.

Data as of 12-08-2020

Nevertheless, China’s success isn’t shared by all. Developing nations dependent on oil exports, tourism, or general commodities have and will continue to struggle as trade activity remains low. Certain EM hotspots including Russia and Brazil are also finding difficulty with containing virus spread. Highly indebted economies face risks of debt sustainability with limited room for policy enactment.

The Emerging Markets Story…to be Valued

EM equities experienced a mass exodus in March as investors questioned whether the infrastructure and economic inexperience of developing countries could properly combat the Coronavirus. Fund flows faced pressures until investors began acknowledging fruitful economic and health responses to COVID-19. Even after rallying this year, the long-term valuations for emerging markets look attractive.

Data as of 9-30-2020. Source: StarCapital

According to StarCapital research, emerging markets have the cheapest cyclically adjusted price to earnings ratio (CAPE) and price-to-book (P/B) ratio relative to developed countries over the next 10-15 years. Factor in the expected structural improvements, emerging markets exhibit ample opportunity for value appreciation should the demographic and technological trends fall in line. You may also find comfort in knowing that emerging markets are expected to have the sharpest recovery post COVID-19.

Data as of 10-16-2020. Source: Wall Street Journal

What Will the Next Decade Look Like?

Despite some commendable pandemic responses and attractive valuations over the next decade, it is imperative to consider COVID-19’s impact on the region’s secular trends. Take China’s “Great Rebalancing,” for example. After years of export-driven GDP growth, the country adopted a “Great Rebalancing” plan to generate their economic prowess from organic consumer-driven activity rather than overseas trade.

When the Coronavirus struck, both Chinese businesses and consumers halted activity. Unwilling consumers, shocked by the events in Wuhan, emptied the streets as factories shut down. Once a recovery was en-route, business activity quickly climbed back to pre-pandemic levels, but scarred consumers left their homes thrift-conscious and hesitant. This led some to believe that China’s “Great Rebalancing” plan was at stake.

The Chinese customer today, has regained confidence, mainly from the government’s ability to eliminate almost any possibility of second wave. As we said earlier, China’s success is not shared by all, and whether or not secular trends will hold in other emerging nations — who have varying health and economic conditions – will be a mixed bag.

Bringing It All Home

Although prudent investors can exploit opportunities in countries that have exhibited short-term resiliency, the ability to maintain a long-term perspective and understand the landscape of your investments is keen. Here at Warren Street Wealth Advisers, our focus is not only to avoid home-country bias and to uncover the next areas of outperformance, but also to educate our clients about our long-term decision making.

For any questions regarding international investments, emerging markets, or wealth management, please call 714-876-6200 or email phillip@warrenstreetwealth.com

Phillip Law, Portfolio Analyst

Wealth Advisor, Warren Street Wealth Advisors

Investment Advisor Representative, Warren Street Wealth Advisors, LLC., a Registered Investment Advisor

The information presented here represents opinions and is not meant as personal or actionable advice to any individual, corporation, or other entity. Any investments discussed carry unique risks and should be carefully considered and reviewed by you and your financial professional. Nothing in this document is a solicitation to buy or sell any securities, or an attempt to furnish personal investment advice. Warren Street Wealth Advisors may own securities referenced in this document. Due to the static nature of content, securities held may change over time and current trades may be contrary to outdated publications. Form ADV available upon request 714-876-6200.

What to Expect For Expense Deductions if You’ve Taken a Paycheck Protection Program Loan

Earlier in 2020 the “Paycheck Protection Program” was passed, which allowed for much needed aid for struggling small businesses during the Coronavirus pandemic. One of the main features of the Paycheck Protection Program was the ability to potentially have your loan amount forgiven, tax free. 

While this is a great benefit, one of the many grey areas that arose was whether or not expenses that were paid by the business using PPP funds were eligible for a tax deduction. While the funds may have been spent on business related items that would normally be tax deductible, it was unclear whether this same treatment would be available for those who received tax free PPP loan forgiveness.

On November 18th, 2020 the IRS and Treasury Department Secretary Steven Mnuchin issued some additional guidance to assist in clearing up some of the confusion. The statement issued expressed that “since businesses are not taxed on the proceeds of a forgiven PPP loan, the expenses are not deductible. This results in neither a tax benefit nor tax harm since the taxpayer has not paid anything out of pocket.” It then went on to state that “if a business reasonably believes that a PPP loan will be forgiven in the future, expenses related to the loan are not deductible, whether the business has filed for forgiveness or not.”  Therefore, they encouraged businesses to file for forgiveness as soon as possible. In the case where a PPP loan was expected to be forgiven, and it is not, the statement outlined that businesses will be able to deduct those expenses.

As you can imagine, this was not the desired outcome for many business owners. Currently there is a fight within Congress, the Treasury Department, as well as in the business and tax communities regarding this interpretation of the PPP language. Many in Congress from both sides of the aisle argue that this interpretation of the language in the Bill does not align with Congressional intent. For example, Senate Finance Committee Chairman Chuck Grassley (R-Iowa) and Ranking Member Ron Wyden (D-Ore.) released a joint statement expressing their opinion that the expenses should be considered deductible. With Congress currently negotiating both a spending bill and second stimulus package, many hope the rules around deductibility of these expenses will be specifically outlined soon.

If you are a business owner impacted by this, unfortunately the best course of action is to remain patient with hopes of some additional Congressional action coming shortly. As always with Congress, it is unclear when they will act and what will be in the final version of the Bill. Ideally, this will be addressed prior to Congress’ holiday adjournment on December 18th, 2020. For the time being we are forced to assume that these expenses will not be deductible until additional Congressional action says otherwise. As always, when it comes to anything tax-related, your best course of action is always to work directly with your CPA and tax professional.

Source – https://home.treasury.gov/news/press-releases/sm1187

Source – https://www.jdsupra.com/legalnews/the-irs-forgiven-ppp-loans-and-business-88352/#_edn25

Source- https://www.finance.senate.gov/chairmans-news/grassley-wyden-treasury-misses-the-mark-on-ppp-loan-expense-deductibility-guidance

Justin Rucci, CFP®

Wealth Advisor, Warren Street Wealth Advisors

Investment Advisor Representative, Warren Street Wealth Advisors, LLC., a Registered Investment Advisor

The information presented here represents opinions and is not meant as personal or actionable advice to any individual, corporation, or other entity. Any investments discussed carry unique risks and should be carefully considered and reviewed by you and your financial professional. Nothing in this document is a solicitation to buy or sell any securities, or an attempt to furnish personal investment advice. Warren Street Wealth Advisors may own securities referenced in this document. Due to the static nature of content, securities held may change over time and current trades may be contrary to outdated publications. Form ADV available upon request 714-876-6200.

Will Your Vote Move the Market?

Election seasons are highly polarized and leave investors from both sides of the political aisle paralyzed by what-ifs and fear of the other. This seems more true now than ever. Given COVID-19, supreme court implications, and an incredibly divided nation in terms of policy wishes, we expect a volatile finish to 2020. Due to an expected record number of mail-in ballots due to the election, it’s even possible the results aren’t known for days or even weeks. It’s normal to be concerned, but does the data support it? Does taking investment action make sense?

Believe it or not, I wrote the above days before President Trump and the First Lady contracted COVID-19. Can 2020 have any more twists and turns? Our team at Warren Street sends our thoughts and well wishes to them both, their families, and their staff. We hope a speedy and full recovery ensues. The diagnosis for President Trump is undoubtedly troubling given his age and possible pre-existing conditions, it’s sure to inject additional doubt into investors’ minds. CDC data however is still dramatically in his favor and it’s safe to assume he’ll receive best-in-class care. Historically, election seasons have in-fact provided for increased volatility in the markets. In addition, the dispersion in results and returns has been all over the map especially in the short term. You should find comfort however in the fact that long term returns have generally been positive regardless of who’s been at the Presidential helm or a split vs. unified congress. More details to come.

Let’s start with volatility (chart below). Taking a look back to 1929 you’ll see that the election year realized volatility exceeds non-election year volatility in September-November by a rather dramatic amount as measured by daily standard deviation in returns. I can’t say whether the current September 2020  volatility is caused or simply correlated to this phenomena. With U.S. stocks down over 7% 9/1-9/23 there’s plenty going on in the world to not simply chalk this up to election hysteria.

Now that volatility is out of the way, let’s talk returns, starting with short term returns. It is abundantly clear what investors prefer, and it isn’t what you’d think. The President is less significant than the balance of power. Returns tend to be best with a split congress, or in the best performing case a Democrat for President with a Republican congress. Why might that be? Gridlock. Investors love the status quo, but more so corporations love the predictability that comes with it. The ability to invest, forecast, and produce without the prospects of a changing playing field often lends itself to unimpeded growth.

We all learned in 2016 that polling is VERY fallible. Here we find ourselves again with a rapidly changing landscape of polling results, and most of which seem to be consolidating into the margin for error. Meaning both the Presidential and the Congressional races can go any which way. If we were betting, we’d likely expect a blue wave (Biden win and Democrats take over the Senate). Most of this is because incumbents just simply don’t win while in a recession, it’s only happened once in the last 100 years. The bad news, a Democratic sweep is actually one of the worst outcomes for investment markets historically over the corresponding 2 years (blue below) post election. The good news, you can barely tell a difference after 4 years (light blue below) regardless of who is in office, Presidential or Congressional.

Source: FMRCo

So what do we do now? Proceed with caution. Obviously this election is unparalleled in so many ways, and because of that we can’t solely rely on historical data to give us permission to proceed with blinders on. Having said that, you can make a bullish case for U.S. and Global securities regardless of who wins. What types of companies and which geographies you favor might look very different however. Each party has a different impact on tax code, currency stability, trade relations, etc. It’s important to construct your portfolio with these varied outcomes in mind and not be married to one outcome to succeed.

If you want to review your current investment posture as we head toward the stretch of election season 2020, please don’t hesitate to reach out to our team.

Blake Street, CFA, CFP®

Wealth Advisor, Warren Street Wealth Advisors

Investment Advisor Representative, Warren Street Wealth Advisors, LLC., a Registered Investment Advisor

The information presented here represents opinions and is not meant as personal or actionable advice to any individual, corporation, or other entity. Any investments discussed carry unique risks and should be carefully considered and reviewed by you and your financial professional. Nothing in this document is a solicitation to buy or sell any securities, or an attempt to furnish personal investment advice. Warren Street Wealth Advisors may own securities referenced in this document. Due to the static nature of content, securities held may change over time and current trades may be contrary to outdated publications. Form ADV available upon request 714-876-6200.